


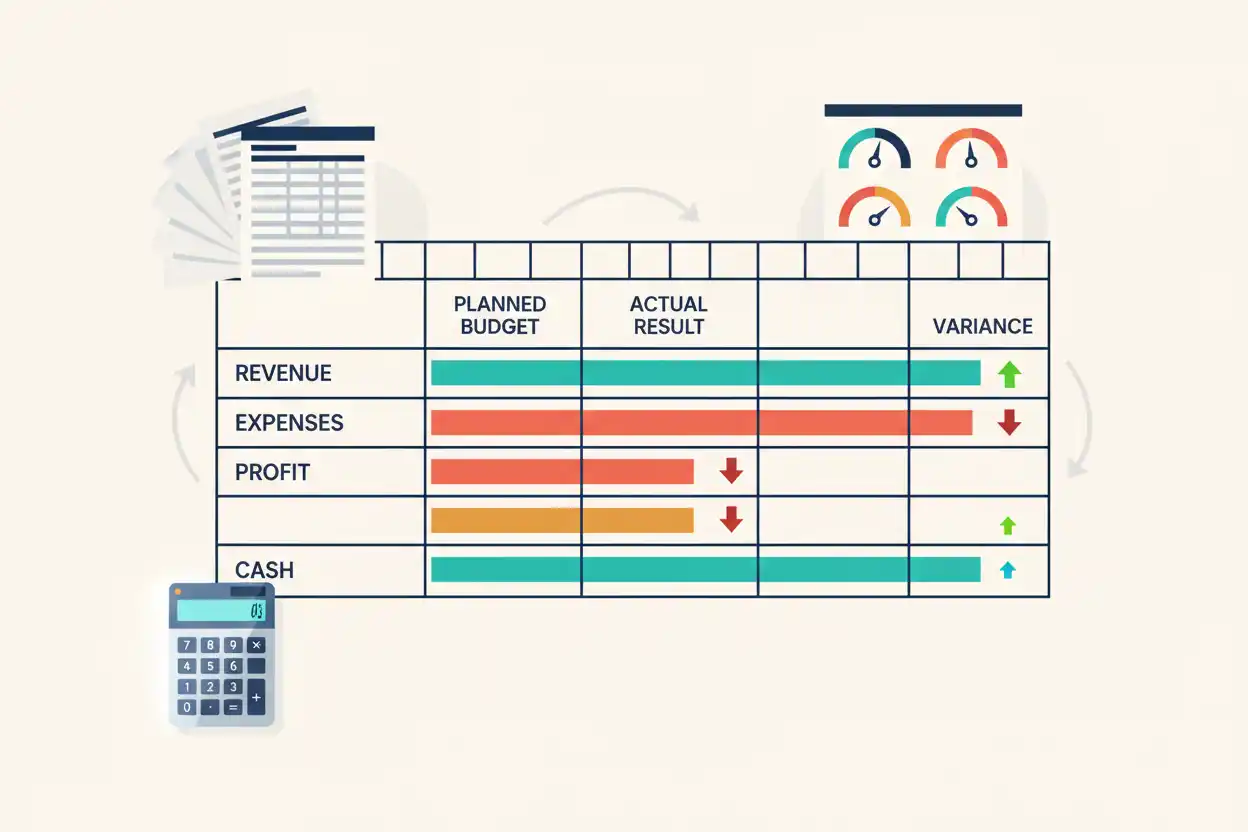
Budget variance measures the difference between an actual financial result and the amount originally budgeted or forecast for the same period.
Suppose a business budgets $500,000 of revenue but actually earns $540,000.
Budget Variance = Actual − Budget
= $540,000 − $500,000
= +$40,000
Revenue exceeded budget by $40,000.
For an expense, however, a positive actual-minus-budget number can be unfavorable because the business spent more than planned.
The arithmetic is simple. Interpretation depends on what is being measured.
Budget Variance Formula
A general formula is:
Budget Variance = Actual Amount − Budgeted Amount
Variance percentage:
Budget Variance % = (Actual − Budget) ÷ Budget × 100
These formulas produce signed results.
Whether a positive or negative result is favorable depends on the account.
Revenue Variance Example
Suppose:
Budgeted Revenue = $500,000
Actual Revenue = $540,000
Dollar variance:
+$40,000
Percentage variance:
$40,000 ÷ $500,000 × 100
= +8%
Revenue is 8% above budget.
Assuming the additional sales are economically desirable, this would usually be considered favorable.
Expense Variance Example
Suppose:
Budgeted Expense = $200,000
Actual Expense = $218,000
Using actual minus budget:
Variance = +$18,000
Percentage:
$18,000 ÷ $200,000 × 100
= +9%
The mathematical variance is positive, but the operational interpretation is generally unfavorable because expenses exceeded budget.
This is why reports should clearly distinguish the sign convention from the favorable/unfavorable label.
Favorable Expense Variance
Suppose:
Budgeted Expense = $200,000
Actual Expense = $185,000
Variance:
$185,000 − $200,000
= −$15,000
Percentage:
−7.5%
The negative numerical variance is favorable if lower spending achieved the intended operating result without causing other problems.
Profit Variance
Suppose:
Budgeted Profit = $80,000
Actual Profit = $95,000
Variance:
$95,000 − $80,000
= +$15,000
Percentage:
$15,000 ÷ $80,000 × 100
= 18.75%
Actual profit exceeded budget by 18.75%.
Budget Variance Does Not Explain the Cause
Suppose revenue is $40,000 above plan.
That could result from:
higher selling prices, higher unit volume, different product mix, new customers, currency effects, or a timing shift.
The variance tells management where actual results differed.
Further analysis determines why.
Price and Volume Variance
Suppose a business budgets:
5,000 Units at $100
Revenue budget:
$500,000
Actual results are:
5,200 Units at $105
Actual revenue:
$546,000
Overall revenue variance:
+$46,000
Part of the difference comes from higher volume, while another part comes from higher price.
Separating those drivers makes the variance more useful operationally.
Simplified Volume Effect
Using the budgeted price:
Volume Effect = (Actual Units − Budget Units) × Budget Price
(5,200 − 5,000) × $100
= $20,000 Favorable
The remaining difference is associated with price and interaction effects depending on the chosen variance framework.
Simplified Price Effect
Using actual units:
Price Effect = (Actual Price − Budget Price) × Actual Units
($105 − $100) × 5,200
= $26,000 Favorable
Together:
$20,000 + $26,000 = $46,000
This specific decomposition assigns the interaction to the price effect.
Other variance-analysis conventions can allocate interaction differently.
Fixed-Cost Variance
Suppose fixed operating costs were budgeted at:
$150,000
but actual cost is:
$158,000
Variance:
+$8,000 Unfavorable
Potential causes might include higher rent, unplanned professional fees, additional management salaries, repairs, or misclassification.
The variance should be traced to specific accounts rather than accepted as one unexplained total.
Variable-Cost Variance
Suppose variable costs were budgeted at:
$60 per Unit
for:
5,000 Units
Budget:
$300,000
Actual volume is 5,200 units with actual variable cost of $62 per unit.
Actual:
5,200 × $62
= $322,400
Simple total variance against the original static budget:
$322,400 − $300,000
= +$22,400
But part of the variance arises because more units were produced or sold.
A flexible budget can provide a more useful comparison.
Flexible Budget
A flexible budget adjusts expected variable costs for actual activity.
Using:
Budgeted Variable Cost = $60 per Unit
and:
Actual Volume = 5,200
Flexible-budget cost:
5,200 × $60
= $312,000
Actual cost:
$322,400
Flexible-budget variance:
$10,400 Unfavorable
This isolates the cost-rate or efficiency difference from the $12,000 of additional expected cost associated with producing 200 extra units.
Budget Variance and Capacity Utilization
Capacity utilization can explain some operating variances.
Suppose the budget assumes 70% utilization but actual utilization reaches 90%.
Higher output can produce favorable sales volume but also higher variable costs, overtime, maintenance, or production inefficiency.
A cost variance should therefore be interpreted alongside activity levels.
Budget Variance and Cash Accounting
Under cash accounting, a cash budget comparison can be heavily influenced by payment and collection timing.
Suppose budgeted cash receipts are:
$300,000
but actual receipts are:
$250,000
Cash receipt variance:
−$50,000
This may reflect lower sales, slower collection, or customer payments shifting into the next period.
The same accounting period could show a smaller revenue variance under accrual accounting.
Budget Variance and Balance Sheet
A balance sheet budget can compare planned and actual assets, liabilities, and equity.
Suppose budgeted accounts receivable is:
$120,000
but actual AR is:
$175,000
Variance:
+$55,000
If sales are close to budget, the large receivable variance can indicate collection delays rather than strong performance.
Budget Variance and Break-Even Sales
Suppose the budget expects break-even sales of:
$500,000
but actual cost conditions raise break-even sales to:
$560,000
Variance in required break-even revenue:
+$60,000
If actual sales are only $540,000, the company can miss profitability even though it exceeded the original break-even plan.
Updating break-even assumptions can therefore be part of meaningful budget control.
Budget Variance and Amortization Expense
Suppose budgeted amortization expense is:
$20,000
but actual amortization is:
$24,000
Variance:
+$4,000 Unfavorable for Accounting Profit
The variance may result from acquiring additional amortizable assets, changing useful-life estimates, or beginning amortization earlier than budgeted.
Because amortization is noncash in the recognition period, its cash-flow implication differs from a $4,000 cash expense overrun.
Materiality
Not every variance deserves equal management attention.
Suppose:
Office expense:
$500 Over Budget
Revenue:
$200,000 Under Budget
Both are unfavorable, but the second is likely far more significant.
Variance analysis is most useful when management prioritizes deviations based on size, risk, recurrence, controllability, and strategic importance.
Dollar Variance vs Percentage Variance
Suppose Account A is:
$10,000 Over a $1,000,000 Budget
Percentage:
1%
Account B is:
$5,000 Over a $20,000 Budget
Percentage:
25%
Account A has the larger dollar variance.
Account B has the larger proportional variance.
Both perspectives can matter.
Zero Budget Problem
Suppose an unplanned expense of:
$10,000
occurs against a budget of:
$0
Dollar variance is:
+$10,000
But percentage variance:
$10,000 ÷ $0
is undefined.
When the budget denominator is zero, report the dollar variance and explain the unplanned activity rather than forcing a percentage.
Negative Budget Values
Certain accounting lines can be negative, such as planned losses or contra accounts.
Standard percentage-variance formulas can become difficult to interpret when the denominator is negative.
In such cases, dollar variance and clearly defined management conventions are often more useful than a raw percentage.
Monthly Variance
Suppose monthly marketing budget is:
$20,000
Actual spending:
$23,000
Monthly variance:
+$3,000 Unfavorable
If annual marketing budget is $240,000, a one-month $3,000 overrun may still be manageable if later months offset it.
Monthly analysis should therefore distinguish timing differences from permanent annual overspend.
Year-to-Date Variance
Suppose six-month budgeted expense is:
$120,000
Actual:
$126,000
YTD variance:
+$6,000
Percentage:
5% Unfavorable
If the annual budget is $240,000, management can revise the forecast based on whether the six-month overrun is expected to continue.
Forecast vs Budget
A budget usually represents the approved plan.
A forecast is an updated expectation based on newer information.
Suppose budgeted annual revenue is:
$1,000,000
but after six months the latest forecast is:
$900,000
Actual results should still be compared with the original budget for accountability, while the updated forecast helps management plan future decisions.
The two comparisons serve different purposes.
Common Budget Variance Mistakes
A common mistake is labeling every positive variance favorable.
Another is comparing actual variable costs with a static budget without adjusting for activity.
Businesses can also focus on percentages while ignoring material dollar amounts, treat timing differences as permanent performance issues, or report variances without identifying the operational drivers behind them.
Frequently Asked Questions
What is budget variance?
It is the difference between an actual result and the amount budgeted for the same measure and period.
What is the formula?
Budget Variance = Actual − Budget
How do I calculate variance percentage?
(Actual − Budget) ÷ Budget × 100
Is a positive variance always favorable?
No.
What is a favorable revenue variance?
Actual revenue above budget is generally favorable, assuming the revenue is economically desirable.
What is a favorable expense variance?
Actual expense below budget is generally favorable when service levels and operations are not harmed.
What is a flexible budget?
It adjusts budgeted variable amounts to the actual activity level before comparing them with actual results.
Why separate price and volume effects?
They identify different causes of a revenue or cost variance.
What happens when the budget amount is zero?
Percentage variance is undefined; use the dollar difference and explanatory context.
Should variance be measured monthly or annually?
Both can be useful. Monthly results show emerging changes, while year-to-date and annual analysis provide broader context.
Is a budget the same as a forecast?
No. A budget is generally an approved plan, while a forecast updates expectations based on newer information.
Why investigate the cause of a variance?
The number shows that performance differed from plan; the cause determines what management should do about it.




