


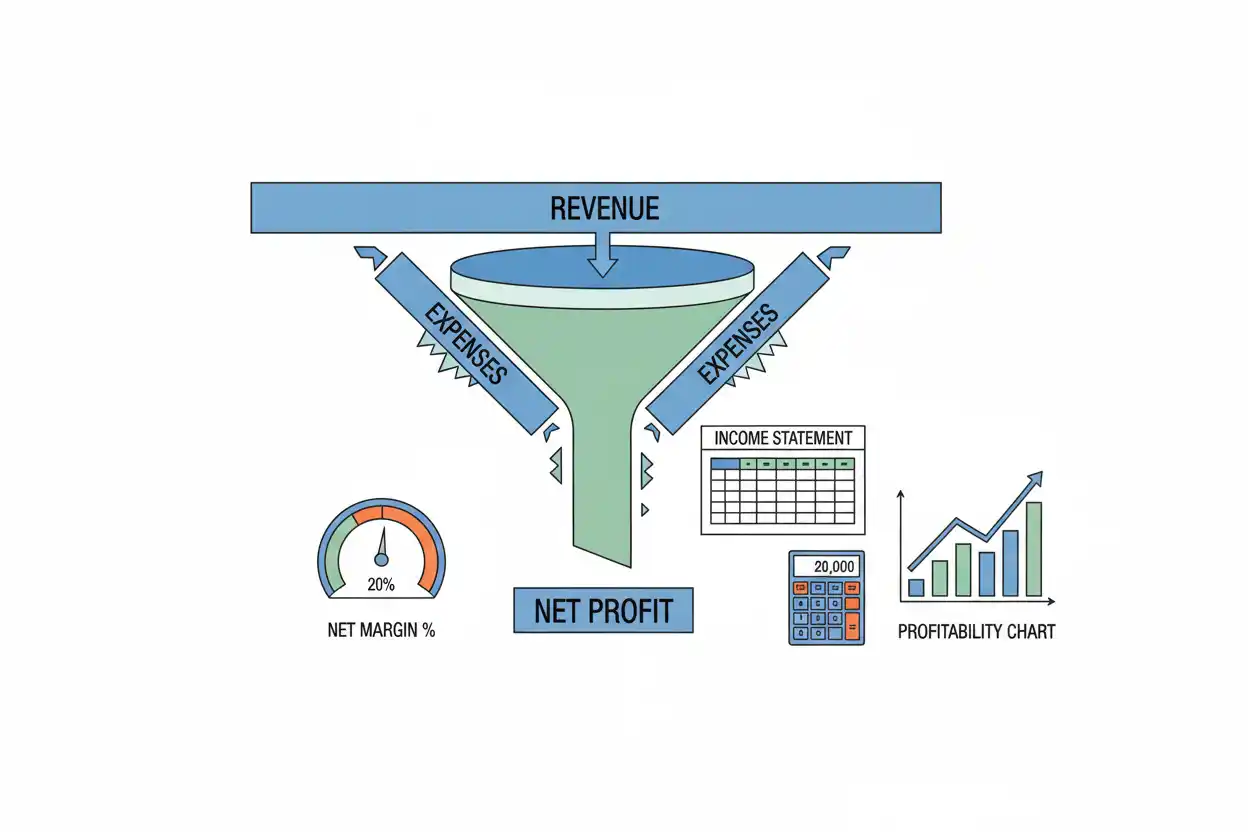
Net margin measures the percentage of revenue that remains as net income after all recognized expenses, interest, taxes, and other applicable gains or losses are included.
If a company earns $80,000 of net income from $1,000,000 of revenue, its net margin is 8%.
Net Margin = Net Income ÷ Revenue × 100
Net Margin = $80,000 ÷ $1,000,000 × 100 = 8%
An 8% net margin means the company retained approximately $0.08 of accounting profit for every $1.00 of revenue during the period.
Because net margin uses the final bottom-line result, it is broader than gross margin or operating margin. It incorporates the combined effects of product costs, operating expenses, financing costs, taxes, and other items that ultimately determine net income.
What Is Net Margin?
Net margin is a profitability ratio that compares a company’s final accounting profit with its revenue.
It answers:
How much of each dollar of revenue remained as net income after all recognized costs?
Suppose two companies each generate $2 million of revenue.
Company A earns $200,000 of net income.
Company B earns $60,000.
Their net margins are:
Company A Net Margin = $200,000 ÷ $2,000,000 × 100 = 10%
Company B Net Margin = $60,000 ÷ $2,000,000 × 100 = 3%
Both businesses have the same revenue, but Company A retains a much larger percentage of it as bottom-line profit.
That makes net margin useful for understanding profitability in proportion to business size rather than relying on net income dollars alone.
Net Margin Formula
The standard formula is:
Net Margin = Net Income ÷ Revenue × 100
Where:
Net income is the final accounting profit after recognized expenses and other applicable items.
Revenue is the company’s top-line income from its ordinary business activities for the same period.
Both amounts must cover the same reporting period.
If quarterly net income is used, it should be divided by quarterly revenue rather than annual revenue.
Net Margin Example
Suppose a company reports:
- Revenue: $1,500,000
- Net income: $120,000
Calculate:
Net Margin = $120,000 ÷ $1,500,000 × 100
Net Margin = 8%
The company generated an 8% net margin.
For every $100 of revenue:
$100 × 8% = $8
approximately $8 remained as net income.
The other $92 was absorbed by recognized product costs, operating expenses, interest, taxes, losses, and other applicable deductions.
Net Margin From an Income Statement
Net margin is usually calculated using figures from the income statement.
Consider:
| Income Statement Item | Amount |
|---|---|
| Revenue | $2,000,000 |
| Cost of goods sold | $1,100,000 |
| Gross profit | $900,000 |
| Operating expenses | $550,000 |
| Operating income | $350,000 |
| Interest and other net expenses | $50,000 |
| Income tax expense | $75,000 |
| Net income | $225,000 |
Net margin is:
Net Margin = $225,000 ÷ $2,000,000 × 100
Net Margin = 11.25%
The company converted 11.25% of revenue into final accounting profit.
What Does Net Margin Mean?
Net margin shows how efficiently revenue survives the entire income statement.
A 15% net margin means:
$0.15 of Net Income per $1.00 of Revenue
A 3% net margin means:
$0.03 of Net Income per $1.00 of Revenue
A negative net margin means the company incurred a net loss.
Higher net margin generally means a greater proportion of revenue remains after recognized costs, but a higher percentage should not automatically be interpreted as evidence that one business is superior to another.
Industries have different cost structures, capital requirements, competitive conditions, tax profiles, and business models.
Net Margin vs. Net Income
Net income and net margin describe the same bottom-line profitability from different perspectives.
Net income is a dollar amount.
Net margin is a percentage of revenue.
Suppose Company A earns $500,000 of net income from $10 million of revenue:
Net Margin = $500,000 ÷ $10,000,000 × 100 = 5%
Company B earns only $300,000 but generates $3 million of revenue:
Net Margin = $300,000 ÷ $3,000,000 × 100 = 10%
Company A has higher total net income.
Company B has the higher net margin.
Neither fact alone establishes which company is economically stronger. Company size, growth, capital requirements, cash flow, and sustainability also matter.
Net Margin vs. Operating Income
Operating income measures profit from operations before certain non-operating items such as interest and taxes.
Net margin uses final net income after those additional items are incorporated.
Suppose:
Revenue = $1,000,000
Operating Income = $180,000
Net Income = $120,000
Operating income represents 18% of revenue:
$180,000 ÷ $1,000,000 × 100 = 18%
Net margin is:
$120,000 ÷ $1,000,000 × 100 = 12%
The six-percentage-point difference reflects items occurring below operating income in this simplified example.
Net margin therefore captures more of the company’s financing, tax, and non-operating structure.
Net Margin vs. Gross Margin
Gross margin measures the percentage of revenue remaining after cost of goods sold.
Net margin goes substantially further.
Suppose:
Revenue = $1,000,000
Cost of Goods Sold = $600,000
Gross profit is:
$1,000,000 − $600,000 = $400,000
Gross margin is:
$400,000 ÷ $1,000,000 × 100 = 40%
Now suppose final net income is $100,000.
Net margin is:
$100,000 ÷ $1,000,000 × 100 = 10%
The company retains 40% of revenue after product costs but only 10% after all recognized costs.
This is why a high gross margin does not guarantee a high net margin.
Net Margin vs. Contribution Margin Ratio
The contribution margin ratio measures sales remaining after variable costs.
Net margin measures final accounting profit after the full set of recognized expenses.
A business might have a 60% contribution margin ratio but a low net margin because fixed costs, depreciation, interest, and other expenses are substantial.
The two ratios therefore answer different questions.
Contribution economics are useful for short-term operating decisions and cost-volume analysis.
Net margin describes final accounting profitability relative to revenue.
Negative Net Margin
Net margin becomes negative when the company reports a net loss.
Suppose:
Revenue = $800,000
Net Loss = $40,000
Then:
Net Margin = −$40,000 ÷ $800,000 × 100
Net Margin = −5%
The business lost approximately $0.05 for every $1.00 of revenue.
A negative margin does not automatically mean the business is insolvent or out of cash. It indicates an accounting loss for the period.
Cash resources, financing, asset sales, working-capital movements, and other factors can produce a different liquidity picture.
Net Margin and Operating Expenses
Operating expenses can materially change net margin.
Suppose a company has:
Revenue = $2,000,000
Net Income = $200,000
Current net margin:
$200,000 ÷ $2,000,000 × 100 = 10%
Now suppose recurring operating expenses increase by $50,000 while revenue and every other item remain unchanged.
Ignoring any related tax effect for simplicity:
New Net Income = $200,000 − $50,000 = $150,000
New net margin:
$150,000 ÷ $2,000,000 × 100 = 7.5%
A $50,000 increase in operating costs reduces net margin from 10% to 7.5%.
Improving Net Margin Through Cost Reduction
Suppose a company generates $5 million of annual revenue and earns $250,000 of net income.
Current net margin:
$250,000 ÷ $5,000,000 × 100 = 5%
Management eliminates $100,000 of recurring annual costs without reducing revenue.
Ignoring tax effects:
New Net Income = $250,000 + $100,000 = $350,000
New net margin:
$350,000 ÷ $5,000,000 × 100 = 7%
The margin improves by:
7% − 5% = 2 Percentage Points
Notice that this is a two-percentage-point increase, not merely a 2% relative increase.
Relative improvement is:
(7% − 5%) ÷ 5% × 100 = 40%
Both statements can be correct but describe different concepts.
Improving Net Margin Through Higher Prices
Suppose a company currently has:
- Revenue: $1,000,000
- Net income: $100,000
- Net margin: 10%
Assume prices increase sufficiently to add $50,000 of revenue without changing unit volume or costs.
New revenue:
$1,000,000 + $50,000 = $1,050,000
If the full additional amount reaches pretax profit in this simplified example:
New Net Income = $150,000
New net margin:
$150,000 ÷ $1,050,000 × 100 ≈ 14.29%
The price increase substantially improves margin.
In reality, price changes can affect customer demand, discounts, sales mix, taxes, commissions, and other costs, so the actual result may differ.
Revenue Growth Does Not Guarantee Higher Net Margin
Suppose revenue grows from $1 million to $1.5 million.
Year 1:
Revenue = $1,000,000
Net Income = $100,000
Net Margin = 10%
Year 2:
Revenue = $1,500,000
Net Income = $120,000
Net Margin = 8%
Net income increased by $20,000, but margin declined from 10% to 8%.
The company is earning more total profit while retaining less profit from each dollar of revenue.
This can happen when additional sales require greater discounts, higher labor expenses, rising acquisition costs, increased financing costs, or a less profitable product mix.
Lower Revenue Does Not Always Mean Lower Net Margin
The reverse is also possible.
Suppose revenue falls from $1 million to $900,000, but management removes substantial unprofitable activity.
Original:
Net Income = $50,000
Net Margin = $50,000 ÷ $1,000,000 = 5%
New:
Net Income = $72,000
Net Margin = $72,000 ÷ $900,000 = 8%
Revenue declined by 10%, but the company became more profitable as a percentage of sales.
Revenue growth and profitability quality therefore need to be assessed separately.
Net Margin and Labor Productivity
Improved labor productivity can support higher net margin when output or revenue grows faster than labor costs.
Suppose a manufacturer improves productivity from 5 units per labor hour to 6.
If labor cost per hour remains $30:
At 5 units per hour:
Labor Cost per Unit = $30 ÷ 5 = $6
At 6 units per hour:
Labor Cost per Unit = $30 ÷ 6 = $5
The labor-cost component decreases by $1 per unit.
If that efficiency translates into lower recognized costs without being offset elsewhere, net income and net margin can improve.
However, labor productivity is only one driver. Material costs, selling prices, overhead, interest, taxes, and product mix can offset the benefit.
Net Margin and Net Burn
Net margin should not be confused with net burn.
Net margin is based on accounting profit.
Net burn measures cash consumption after relevant operating cash inflows.
Suppose a company reports:
Revenue = $1,000,000
Net Income = $100,000
Net Margin = 10%
The company could still consume cash if customers have not paid, inventory increases significantly, capital expenditures are large, or debt repayments consume cash.
A positive net margin therefore does not prove that cash reserves are increasing.
Likewise, a company can report a negative net margin while temporarily generating cash because of customer prepayments or favorable working-capital movements.
Net Margin and Gross Burn
Gross burn measures cash spending before operating cash inflows are deducted.
Net margin measures accounting profitability as a percentage of revenue.
Suppose a startup spends $500,000 in cash per month, collects $450,000 from customers, and reports a small accounting loss after depreciation and other adjustments.
Its gross cash spending can remain substantial even if its accounting margin is approaching break-even.
This is why profitability ratios and burn metrics should be analyzed together but never substituted for one another.
How Interest Expense Affects Net Margin
Interest expense can reduce net margin even when operating performance is unchanged.
Consider two companies with identical operating results:
Revenue = $2,000,000
Operating Income = $300,000
Company A pays $20,000 of interest.
Company B pays $100,000.
Ignoring taxes and other items:
Company A:
Net Income = $300,000 − $20,000 = $280,000
Net Margin = $280,000 ÷ $2,000,000 = 14%
Company B:
Net Income = $300,000 − $100,000 = $200,000
Net Margin = $200,000 ÷ $2,000,000 = 10%
The operating business is identical, but financing structure creates different net margins.
How Taxes Affect Net Margin
Taxes also affect final margin.
Suppose pretax income is $200,000 on $1 million of revenue.
Before tax:
Pretax Profit Margin = $200,000 ÷ $1,000,000 = 20%
If recognized income tax expense is $50,000:
Net Income = $200,000 − $50,000 = $150,000
Net Margin = $150,000 ÷ $1,000,000 × 100 = 15%
Taxes reduce the final margin by five percentage points in this simplified example.
Tax calculations can be considerably more complex in practice, so the recognized net-income figure should normally be taken from the applicable financial statements rather than estimated from a headline tax rate alone.
One-Time Gains Can Raise Net Margin
Suppose normal operations produce $100,000 of net income before a one-time $200,000 gain from an asset sale.
Revenue is $2 million.
Without the gain:
Net Margin = $100,000 ÷ $2,000,000 = 5%
Including the gain:
Net Income = $300,000
Reported Net Margin = $300,000 ÷ $2,000,000 = 15%
Reported net margin triples.
That does not mean recurring operating profitability tripled.
Analysts should inspect whether unusual gains or losses materially affected the bottom line.
One-Time Losses Can Reduce Net Margin
Suppose the company normally earns $300,000 on $3 million of revenue:
Normal Net Margin = 10%
A one-time $150,000 legal settlement reduces reported net income to $150,000:
Reported Net Margin = $150,000 ÷ $3,000,000 = 5%
The reported result is valid, but the recurring economics may be stronger than the single-period margin suggests.
This is why trend analysis and income-statement context matter.
Net Margin Trend Example
Consider:
| Year | Revenue | Net Income | Net Margin |
|---|---|---|---|
| Year 1 | $4,000,000 | $240,000 | 6.0% |
| Year 2 | $4,500,000 | $337,500 | 7.5% |
| Year 3 | $5,000,000 | $450,000 | 9.0% |
Net margin rises from 6% to 9%.
The increase is:
9% − 6% = 3 Percentage Points
Relative improvement:
(9% − 6%) ÷ 6% × 100 = 50%
Revenue also increases, so both total profit and profit retained per revenue dollar are improving.
The next analytical step would be determining what caused the improvement—pricing, product mix, cost control, financing, taxes, operating leverage, or another factor.
Example of Falling Net Margin
Suppose:
| Year | Revenue | Net Income | Net Margin |
|---|---|---|---|
| Year 1 | $3,000,000 | $300,000 | 10% |
| Year 2 | $3,600,000 | $288,000 | 8% |
| Year 3 | $4,200,000 | $252,000 | 6% |
Revenue rises every year, yet net income and net margin fall.
The business is expanding its top line but converting less of that revenue into bottom-line profit.
Possible causes include increased labor costs, discounting, rising operating expenses, more expensive financing, unfavorable product mix, or higher taxes.
The margin trend reveals deterioration that revenue growth alone would hide.
Net Margin and Business Scale
A low net margin business can still generate significant net income if its sales volume is very large.
Suppose a retailer generates $1 billion of revenue with a 2% net margin:
Net Income = $1,000,000,000 × 2% = $20,000,000
A smaller business generating $50 million at a 20% margin produces:
Net Income = $50,000,000 × 20% = $10,000,000
The smaller company has a much higher margin but only half the total net income.
Margin and scale therefore need to be evaluated together.
What Is a Good Net Margin?
There is no universal percentage that defines a good net margin.
A sustainable 5% margin may be attractive in a high-volume industry with intense competition and low capital requirements.
A 5% margin may be weak in a business where competitors commonly retain much more revenue as profit.
Useful comparisons include:
- the company’s own historical margins;
- genuinely comparable competitors;
- business-model economics;
- planned or forecast margins;
- margin through different economic cycles; and
- the amount of capital required to generate the profit.
The quality and durability of the margin are often more important than an isolated percentage.
High Net Margin Does Not Always Mean Low Risk
A company can have a high net margin but substantial business risk.
Revenue may depend on one major customer.
Demand may be volatile.
The company may require little current spending because necessary investment has been deferred.
A temporary tax benefit or one-time gain may inflate profit.
The company could also have weak cash collection despite strong accounting earnings.
Margin should therefore be interpreted with cash flow, revenue concentration, balance-sheet strength, and operating data.
Low Net Margin Does Not Always Mean Poor Performance
Low-margin businesses can operate successfully when they have strong volume, rapid inventory turnover, efficient capital use, stable demand, and disciplined cost control.
The important issue is whether the margin is sufficient for the risks and capital required by the business model.
A 3% margin on enormous, repeatable sales can create substantial economic value.
A 30% margin on very small, unstable revenue may produce less total profit.
Percentage Points vs. Percent Change
Margin analysis commonly creates confusion between percentage points and percentage change.
Suppose net margin rises from 10% to 12%.
The margin increased by:
12% − 10% = 2 Percentage Points
Relative percentage growth is:
(12% − 10%) ÷ 10% × 100 = 20%
Saying the margin “rose 2%” is ambiguous.
For precise financial analysis, state whether the change is in percentage points or relative percentage terms.
Common Net Margin Mistakes
A common mistake is dividing net income by something other than comparable revenue.
Another is using revenue from one period and net income from another.
Businesses can also confuse net margin with gross margin, operating margin, or contribution margin ratio.
Another error is assuming a higher margin always means higher total profit.
One-time gains and losses can distort a period’s margin, while differences in financing and taxes can make similar operating businesses report different net margins.
Finally, positive net margin should not be interpreted as proof of positive cash flow.
Frequently Asked Questions
What is net margin in simple terms?
Net margin is the percentage of revenue remaining as net income after all recognized expenses and other applicable items are included.
What is the net margin formula?
Net Margin = Net Income ÷ Revenue × 100
What does a 10% net margin mean?
A 10% net margin means the company earned approximately $0.10 of net income for every $1.00 of revenue.
How do you calculate net margin from $500,000 of revenue and $40,000 of net income?
Net Margin = $40,000 ÷ $500,000 × 100 = 8%
The net margin is 8%.
Can net margin be negative?
Yes.
If the company reports a net loss, its net margin is negative.
For example, a $20,000 net loss on $400,000 of revenue produces:
−$20,000 ÷ $400,000 × 100 = −5%
Is net margin the same as net income?
No.
Net income is a dollar amount.
Net margin expresses net income as a percentage of revenue.
Is net margin the same as gross margin?
No.
Gross margin considers revenue after cost of goods sold.
Net margin considers the final net income after the broader set of recognized expenses.
Does higher revenue always increase net margin?
No.
If expenses grow faster than revenue, net margin can decline even while sales increase.
Can net margin improve when revenue falls?
Yes.
If costs decline faster than revenue, the business can retain a greater percentage of each revenue dollar as profit.
Does depreciation affect net margin?
Depreciation expense can reduce net income and therefore reduce net margin when it affects the period’s earnings.
It remains a noncash expense when recorded.
Does debt affect net margin?
Debt can affect net margin through interest and other financing-related expenses.
Two companies with identical operating income can therefore have different net margins.
Is net margin a cash-flow metric?
No.
Net margin is based on accounting profit. Cash receipts and payments can occur at different times from revenue and expense recognition.
Why compare net margin over time?
Trend analysis reveals whether the company is retaining more or less profit from each dollar of revenue.
That can expose changes in cost structure or profitability that revenue growth alone may hide.




