


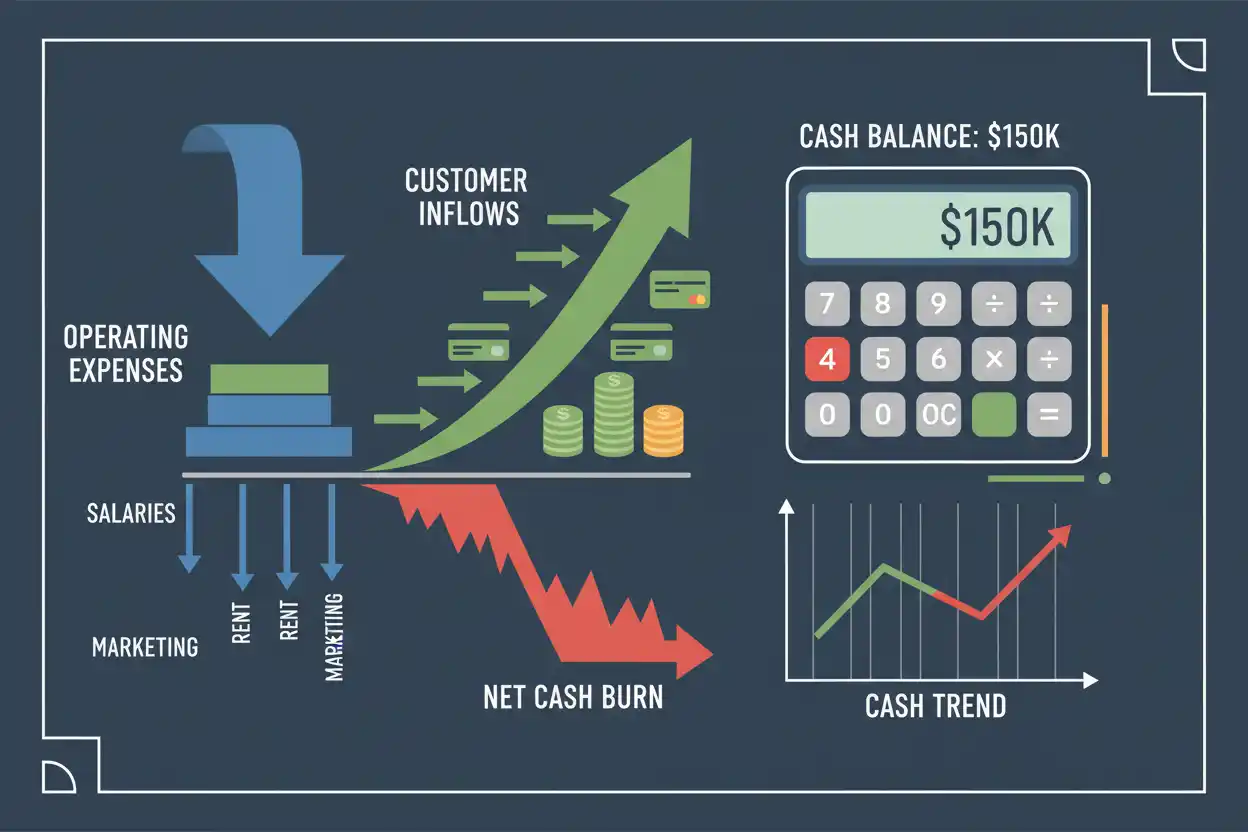
Net burn measures how much cash a business consumes during a period after relevant operating cash inflows are deducted from its cash outflows. It is commonly expressed as a monthly amount and is especially useful for startups and other businesses that are spending more cash than they currently generate from operations.
If a company spends $300,000 during a month and receives $220,000 of operating cash inflows, its net burn is $80,000.
Net Burn = Cash Outflows − Operating Cash Inflows
Net Burn = $300,000 − $220,000 = $80,000
The business consumed $80,000 of net cash during the month.
Net burn is fundamentally a cash metric. It should not be confused with accounting loss, net income, or the amount shown as expenses on an income statement.
What Is Net Burn?
Net burn shows the rate at which a company is using its cash reserves after considering cash generated by normal operations.
It answers a practical question:
After operating cash comes in and cash goes out, how much cash is the business actually consuming?
Suppose a startup has monthly cash outflows of $500,000 but collects $425,000 from customers.
Its gross spending is $500,000, but its net cash consumption is only:
$500,000 − $425,000 = $75,000
That $75,000 is the company’s net burn under this operating-cash convention.
The distinction from gross burn is important. Gross burn focuses on cash spending before inflows are deducted. Net burn considers the cash generated by operations as well.
Net Burn Formula
A common formula is:
Net Burn = Operating Cash Outflows − Operating Cash Inflows
For several months:
Average Monthly Net Burn = Total Net Cash Burn During Period ÷ Number of Months
Another practical method is to measure the reduction in cash attributable to operations over a period, provided financing, acquisitions, asset sales, and other non-operating cash movements are removed or treated consistently.
The definition should therefore be documented before comparing periods or companies.
Net Burn Example
Assume a startup records the following monthly cash movements:
| Cash Movement | Amount |
|---|---|
| Customer cash receipts | $180,000 |
| Payroll payments | $160,000 |
| Marketing payments | $55,000 |
| Software and cloud costs | $30,000 |
| Rent and facilities | $20,000 |
| Professional services | $15,000 |
| Other operating cash outflows | $10,000 |
Total operating cash outflows are:
$160,000 + $55,000 + $30,000 + $20,000 + $15,000 + $10,000 = $290,000
Operating cash inflows are:
$180,000
Net burn is therefore:
Net Burn = $290,000 − $180,000 = $110,000
The company consumed $110,000 of cash during the month from the operating activities included in the calculation.
Net Burn vs. Gross Burn
Gross burn and net burn answer related but different questions.
Suppose:
Gross Cash Outflows = $300,000
Operating Cash Inflows = $225,000
Gross burn is:
$300,000
Net burn is:
$300,000 − $225,000 = $75,000
Gross burn tells management how large the company’s spending structure is.
Net burn shows how much of that spending remains unfunded by operating cash inflows.
A company can therefore have high gross burn but relatively low net burn if customer receipts are strong.
Net Burn Example With Two Companies
Consider two companies:
| Company A | Company B | |
|---|---|---|
| Monthly cash outflows | $400,000 | $400,000 |
| Operating cash inflows | $360,000 | $100,000 |
| Net burn | $40,000 | $300,000 |
Both companies spend the same $400,000 per month.
Their gross burn is identical.
Yet Company A consumes only $40,000 of net cash while Company B consumes $300,000.
That difference has major implications for financing needs and liquidity.
How to Calculate Average Monthly Net Burn
Monthly cash movements can fluctuate, so a multi-month average can provide a more representative result.
Suppose net burn is:
| Month | Net Burn |
|---|---|
| January | $120,000 |
| February | $90,000 |
| March | $105,000 |
| April | $85,000 |
Total net burn:
$120,000 + $90,000 + $105,000 + $85,000 = $400,000
Average monthly net burn:
$400,000 ÷ 4 = $100,000
The company averaged $100,000 of net burn per month.
The trend also matters: monthly burn fell from $120,000 to $85,000, suggesting that the cash deficit was improving during the period.
What Does Positive Net Burn Mean?
Under the convention used here, positive net burn means cash outflows exceeded operating cash inflows.
For example:
Cash Outflows = $250,000
Operating Cash Inflows = $190,000
Net Burn = $60,000
The company consumed $60,000 of net cash.
A positive net burn is common for early-stage companies that are investing ahead of revenue, but persistent burn requires sufficient cash reserves or future financing.
What Does Zero Net Burn Mean?
Zero net burn occurs when the relevant cash inflows equal cash outflows.
Cash Outflows = $200,000
Operating Cash Inflows = $200,000
Net Burn = $0
At that level, the business is neither consuming nor generating net cash from the activities included in the burn calculation.
This does not necessarily mean accounting profit is zero.
Cash timing, noncash expenses, inventory movements, receivables, payables, capital expenditures, and other items can cause cash results and accounting earnings to differ.
What Does Negative Net Burn Mean?
If operating cash inflows exceed cash outflows, the calculation becomes negative.
Suppose:
Cash Outflows = $180,000
Operating Cash Inflows = $230,000
Then:
Net Burn = $180,000 − $230,000 = −$50,000
Rather than consuming cash, the business generated $50,000 of net cash under the defined calculation.
In practice, management may describe this as positive cash generation rather than “negative burn.”
Clear labeling prevents confusion.
Net Burn Is Not the Same as Net Income
Net income is an accounting measure.
Net burn is a cash measure.
A company can report a net loss while having relatively low net burn if part of the accounting loss consists of noncash expenses.
It can also report net income while consuming cash if receivables rise, inventory absorbs cash, capital expenditures are substantial, or other cash uses exceed incoming cash.
For example, suppose a company reports a $20,000 accounting profit but also:
- increases receivables by $60,000;
- purchases $50,000 of additional inventory; and
- pays $30,000 for other cash commitments.
Profit alone does not reveal the resulting liquidity pressure.
This is why the cash flow statement and burn analysis provide information that the income statement cannot supply by itself.
Net Burn vs. Net Margin
Net margin measures net income as a percentage of revenue.
Net burn measures cash consumption.
Suppose a company reports:
Revenue = $1,000,000
Net Income = $100,000
Its net margin is:
Net Margin = $100,000 ÷ $1,000,000 × 100 = 10%
But if cash collections lag behind recognized revenue and the company spends heavily on inventory or capital expenditures, it could still consume cash during the same period.
A positive net margin therefore does not guarantee negative or zero net burn.
Likewise, a company can have a negative accounting margin while burn improves because customer cash receipts rise or certain expenditures decline.
Net Burn and the Income Statement
The income statement records revenue and expenses according to the applicable accounting basis.
Net burn uses cash inflows and outflows.
Consider a company that records:
- Revenue: $250,000
- Expenses: $300,000
- Net loss: $50,000
Suppose $30,000 of those expenses are noncash depreciation.
If all other relevant amounts were paid or collected immediately, the simplified cash deficit could be closer to:
$300,000 − $30,000 − $250,000 = $20,000
The company reports a $50,000 accounting loss but only $20,000 of simplified cash burn from those items.
Real businesses can have additional working-capital and financing differences, so the relationship is often more complex.
Depreciation Does Not Directly Increase Net Burn
Depreciation reduces accounting earnings but does not itself represent cash leaving the business when the expense is recorded.
Suppose:
Net Loss = $80,000
and included in that loss is:
Depreciation Expense = $35,000
The $35,000 expense is relevant to accounting profit but does not by itself add $35,000 to cash burn.
The cash purchase of the underlying asset occurred separately.
This distinction is critical when moving from accounting results to cash-consumption analysis.
Net Burn and Inventory
Inventory can create significant net burn because purchasing stock often requires cash before the products generate customer receipts.
Suppose a retailer normally spends $200,000 per month but buys an additional $150,000 of seasonal inventory in October.
If the purchase is paid immediately:
Additional Cash Outflow = $150,000
The products may remain inventory rather than becoming immediate cost of goods sold, but cash has already left the business.
This can temporarily increase net burn even if the inventory is expected to generate profitable sales later.
Inventory Carrying Cost and Net Burn
Inventory carrying cost can add ongoing cash pressure through storage, insurance, handling, security, and other expenditures.
Suppose reducing excess inventory allows a business to cut:
- warehouse expense by $8,000 per month;
- handling labor by $5,000;
- insurance and related cash costs by $2,000.
Monthly cash-cost reduction:
$8,000 + $5,000 + $2,000 = $15,000
If customer receipts remain unchanged, net burn can decline by approximately $15,000 per month.
Not every inventory carrying cost is a cash expense, however. Opportunity-cost components should not automatically be inserted into a cash-burn calculation.
Net Burn and Labor Productivity
Improving labor productivity can allow a business to generate more output without increasing labor input proportionally.
Suppose a company currently generates 50,000 units using 10,000 labor hours:
Labor Productivity = 5 Units per Hour
If output rises to 60,000 units with the same 10,000 hours:
Labor Productivity = 6 Units per Hour
That 20% productivity improvement may help the company support more revenue without equivalent payroll growth.
If cash inflows rise faster than payroll and other expenditures, net burn can improve.
However, reducing staff is not the same as improving productivity. Productivity measures output relative to labor input, while net burn measures cash consumption.
Net Burn and Revenue Growth
Revenue growth can reduce net burn when it translates into additional cash collections without an equal or larger increase in spending.
Suppose monthly cash inflows rise from $100,000 to $180,000 while cash outflows rise from $250,000 to $270,000.
Original net burn:
$250,000 − $100,000 = $150,000
New net burn:
$270,000 − $180,000 = $90,000
Although spending increased by $20,000, net burn improved by:
$150,000 − $90,000 = $60,000
The business is consuming less net cash because inflows grew much faster than outflows.
Growing Revenue Can Also Increase Burn
Revenue growth does not always reduce net burn immediately.
A business may need to spend cash first on:
- inventory;
- hiring;
- advertising;
- commissions;
- fulfillment;
- infrastructure; or
- customer implementation.
Suppose monthly operating cash inflows rise by $50,000 but supporting growth requires an additional $80,000 of cash spending.
Net burn worsens by $30,000.
The key question is whether the additional spending is expected to create sustainable future cash generation.
Net Burn and Working Capital Timing
Cash collections and payments can materially change monthly net burn even when the underlying business has not changed much.
Suppose customers normally pay within 30 days but begin paying within 60 days.
Revenue recognition may remain strong while cash inflows slow.
Similarly, negotiating longer supplier payment terms can temporarily reduce cash outflows.
Burn analysis should therefore distinguish structural changes from timing changes.
A one-month improvement caused entirely by delaying supplier payments is different from an improvement caused by stronger customer collections or permanently lower operating costs.
Net Burn and Forecast Variance
A company can compare actual net burn with its expected cash consumption using forecast variance.
Suppose management forecasts net burn of $100,000 but actual net burn is $125,000.
Forecast Variance = $125,000 − $100,000 = $25,000
Percentage variance:
$25,000 ÷ $100,000 × 100 = 25%
Actual net burn was 25% higher than forecast.
Management should then identify whether the variance came from weaker customer collections, higher payroll, marketing overspend, inventory purchases, delayed launches, or another driver.
Net Burn Before and After Cost Reduction
Suppose a company has:
Cash Outflows = $350,000
Operating Cash Inflows = $225,000
Current net burn:
$350,000 − $225,000 = $125,000
Management removes $40,000 of recurring monthly cash expenditures without affecting incoming cash.
New outflows:
$350,000 − $40,000 = $310,000
New net burn:
$310,000 − $225,000 = $85,000
Net burn improves by:
$125,000 − $85,000 = $40,000
The cash effect equals the recurring reduction because operating inflows remained unchanged.
Net Burn Before and After Higher Collections
Now suppose management keeps cash outflows at $350,000 but increases customer collections from $225,000 to $300,000.
Original net burn:
$350,000 − $225,000 = $125,000
New net burn:
$350,000 − $300,000 = $50,000
Improvement:
$125,000 − $50,000 = $75,000
Burn can therefore improve through stronger cash generation as well as lower spending.
Why Financing Inflows Should Be Treated Carefully
Suppose a company spends $300,000, receives $100,000 from customers, and raises $2 million from investors.
Its bank balance may increase substantially.
That does not mean the company has stopped burning cash.
Operating net burn is still:
$300,000 − $100,000 = $200,000
The $2 million financing inflow funds the burn; it does not eliminate the operating deficit.
Including financing proceeds as ordinary operating inflows would make the burn metric far less useful.
The same caution applies to debt proceeds, asset sales, and other non-operating sources of cash.
One-Time Cash Outflows and Net Burn
A large one-time payment can temporarily distort monthly net burn.
Suppose normal monthly net burn is $80,000, but the company pays a one-time $240,000 legal settlement.
Reported cash consumption for that month could rise substantially even though recurring operating burn is unchanged.
For internal analysis, management may show both:
Actual net cash burn, including the payment; and
Recurring net burn, excluding clearly identified nonrecurring items.
The adjustment should be transparent. One-time cash outflows should not simply disappear from liquidity planning.
Seasonal Net Burn
Seasonality can also make one month’s burn misleading.
Suppose a retailer builds inventory before a peak selling season:
| Month | Net Burn |
|---|---|
| September | $180,000 |
| October | $250,000 |
| November | $120,000 |
| December | -$200,000 |
The company consumes substantial cash before the season but generates cash in December when customers buy the accumulated inventory.
A multi-month view better reflects the operating cycle than treating October’s high burn as a standalone structural problem.
Net Burn Trend Example
Suppose net burn changes as follows:
| Month | Net Burn |
|---|---|
| January | $200,000 |
| February | $175,000 |
| March | $140,000 |
| April | $110,000 |
From January to April, monthly net burn fell by:
$200,000 − $110,000 = $90,000
Percentage reduction:
$90,000 ÷ $200,000 × 100 = 45%
The business reduced monthly net burn by 45%.
That trend may result from higher customer collections, lower spending, or both. The underlying drivers should be reviewed before assuming the improvement will continue.
When High Net Burn Can Be Reasonable
High net burn is not automatically evidence of poor management.
A business may intentionally consume cash while:
- building a product;
- opening new locations;
- hiring ahead of demand;
- purchasing inventory;
- entering new markets; or
- acquiring customers.
The relevant questions are whether the spending is planned, whether the business has enough liquidity to support it, and whether the investment is producing measurable progress.
High burn with rapidly improving economics tells a different story from high burn caused by uncontrolled operating costs.
When Net Burn Is a Warning Sign
Net burn becomes more concerning when:
- it repeatedly exceeds forecast;
- customer cash inflows stagnate;
- spending rises without measurable operating progress;
- inventory absorbs increasing amounts of cash;
- financing options are limited;
- cost reductions are difficult because most spending is fixed; or
- management cannot clearly explain why burn changed.
Persistent cash consumption is ultimately a liquidity issue, regardless of whether accounting results appear attractive.
How to Improve Net Burn
Net burn can improve in two fundamental ways:
Increase operating cash inflows.
This can come from stronger sales, faster customer collections, improved renewal rates, better pricing, or other changes that generate more cash.
Reduce operating cash outflows.
This can involve eliminating unnecessary spending, improving procurement, managing inventory more efficiently, increasing labor productivity, reducing low-return marketing, or renegotiating recurring commitments.
The strongest improvement is often one that increases cash generation while preserving the company’s ability to grow.
Common Net Burn Mistakes
A common mistake is subtracting financing proceeds from operating spending and concluding that burn has disappeared.
Another is using accounting revenue instead of actual operating cash receipts without checking collection timing.
Businesses can also copy income-statement expenses directly into the calculation even when those expenses contain noncash amounts.
Another mistake is ignoring large inventory purchases because the goods have not yet been expensed.
Companies may also compare one unusually high or low month without considering seasonality and timing.
Finally, the definition must remain consistent. Changing which cash flows are included from month to month can make the apparent trend meaningless.
Frequently Asked Questions
What is net burn in simple terms?
Net burn is the amount of cash a business consumes after relevant operating cash inflows are deducted from its cash outflows.
What is the net burn formula?
A common formula is:
Net Burn = Operating Cash Outflows − Operating Cash Inflows
What does a net burn of $100,000 mean?
It means the business consumed approximately $100,000 more cash than it generated from the activities included in the calculation during the period.
Is net burn the same as gross burn?
No.
Gross burn measures total cash spending before operating inflows.
Net burn subtracts relevant operating cash inflows from those outflows.
Is net burn the same as net loss?
No.
Net loss is an accounting result.
Net burn measures cash consumption. Noncash expenses and differences in payment or collection timing can make the two substantially different.
Can a profitable company have positive net burn?
Yes.
A profitable company can consume cash because customers have not yet paid, inventory has increased, capital expenditures are large, or other cash commitments exceed incoming cash.
Can a company with a net loss have no net burn?
Yes.
Noncash expenses, customer prepayments, favorable working-capital changes, or other cash movements can allow a company to generate cash despite reporting an accounting loss.
Should investment funding reduce net burn?
Financing proceeds generally should not be treated as ordinary operating inflows when measuring operating net burn.
They provide cash to finance the deficit rather than eliminating the underlying burn.
Do inventory purchases affect net burn?
They can.
If inventory is purchased with cash, the payment can increase cash consumption before the related products are sold and recognized through COGS.
Does depreciation increase net burn?
Not directly.
Depreciation is a noncash accounting expense when recorded, so the depreciation entry itself does not consume current-period cash.
What does negative net burn mean?
Under an outflows-minus-inflows convention, negative net burn means operating inflows exceeded the cash outflows included in the calculation.
The business generated net cash rather than consuming it.
Why should net burn be tracked over several months?
Cash flows can be affected by timing, seasonality, one-time payments, inventory purchases, and customer collection patterns.
A multi-month trend usually gives a more reliable picture of underlying cash consumption than a single month.




