


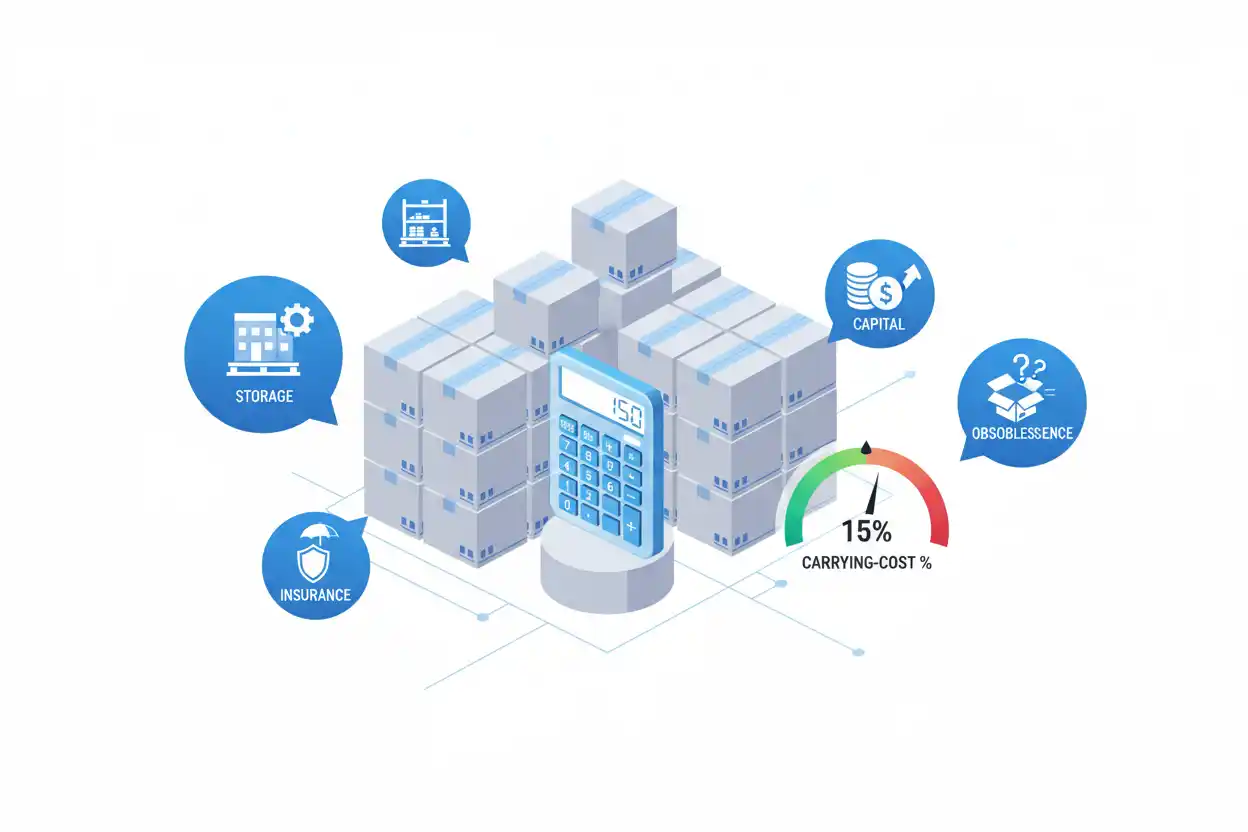
Inventory carrying cost is the total economic cost of holding inventory over a period. It can include the cost of capital tied up in stock, storage, insurance, handling, shrinkage, deterioration, obsolescence, and other costs that arise because inventory remains unsold.
The amount is commonly expressed either as an annual dollar cost or as a percentage of average inventory value.
If a business holds $400,000 of average inventory and incurs $100,000 of annual carrying costs, its inventory carrying cost rate is 25%.
Inventory Carrying Cost Rate = $100,000 ÷ $400,000 × 100 = 25%
This means holding $1 of average inventory costs the business approximately $0.25 per year under the assumptions included in the calculation.
What Is Inventory Carrying Cost?
Inventory carrying cost measures what a business gives up or spends by keeping stock on hand.
The purchase price of the goods is only one part of inventory economics. Once goods are held in a warehouse, store, distribution center, or production facility, additional costs can accumulate.
Those costs may include warehouse space, insurance, security, handling, damaged goods, shrinkage, financing, and the risk that products become obsolete before they can be sold.
The underlying inventory remains an asset until its cost is recognized appropriately, but carrying that asset can still create substantial economic costs.
This distinction matters because a business with $1 million of inventory does not merely have $1 million tied up in products. It may also be spending hundreds of thousands of dollars each year to finance, protect, store, manage, and absorb risks associated with that stock.
Inventory Carrying Cost Formula
A common dollar formula is:
Inventory Carrying Cost = Average Inventory Value × Carrying Cost Rate
If average inventory is $600,000 and the annual carrying cost rate is 22%:
Inventory Carrying Cost = $600,000 × 22% = $132,000
The business is therefore carrying approximately $132,000 of annual inventory holding cost under the assumptions used.
When the individual carrying-cost components are known, the percentage can be calculated directly:
Inventory Carrying Cost Rate = Total Annual Carrying Costs ÷ Average Inventory Value × 100
Suppose total carrying costs are $90,000 and average inventory is $450,000:
Carrying Cost Rate = $90,000 ÷ $450,000 × 100 = 20%
The two forms of the calculation are mathematically connected.
Inventory Carrying Cost Example
Assume a distributor maintains average inventory worth $400,000.
During the year, management identifies these inventory-related costs:
| Carrying Cost Component | Annual Cost |
|---|---|
| Cost of capital | $40,000 |
| Warehouse and storage | $24,000 |
| Insurance | $8,000 |
| Shrinkage and damage | $12,000 |
| Obsolescence | $16,000 |
| Total carrying cost | $100,000 |
Total annual carrying cost is:
$40,000 + $24,000 + $8,000 + $12,000 + $16,000 = $100,000
Now calculate the carrying cost rate:
Inventory Carrying Cost Rate = $100,000 ÷ $400,000 × 100
Inventory Carrying Cost Rate = 25%
The company therefore estimates that carrying inventory costs approximately 25% of average inventory value per year.
Average Inventory in the Carrying Cost Formula
Using only ending inventory can distort the calculation if inventory changes materially during the year.
A simple average is:
Average Inventory = (Beginning Inventory + Ending Inventory) ÷ 2
Suppose beginning inventory is $300,000 and ending inventory is $500,000.
Average Inventory = ($300,000 + $500,000) ÷ 2
Average Inventory = $400,000
If the annual carrying cost rate is 25%:
Annual Carrying Cost = $400,000 × 25% = $100,000
For highly seasonal businesses, averaging monthly or weekly inventory balances can produce a more representative figure than using only beginning and ending values.
What Is Included in Inventory Carrying Cost?
Carrying-cost calculations can vary by company, but the major components generally fall into several economic categories.
Cost of Capital
Money invested in inventory cannot simultaneously be used elsewhere.
If a company has $500,000 tied up in stock, that capital may have an economic cost even if the inventory is stored in a building the company already owns.
The relevant rate can reflect financing costs, opportunity cost, or another internally defined cost-of-capital assumption.
Suppose average inventory is $500,000 and the company uses a 10% annual capital cost:
Capital Carrying Cost = $500,000 × 10% = $50,000
The calculation represents the cost assigned to capital tied up in inventory.
Storage and Facility Costs
Inventory requires physical space.
Relevant costs can include incremental warehouse rent, utilities, shelving, security, temperature control, equipment, and other expenses associated with keeping stock.
Not every warehouse cost should automatically be allocated to carrying cost. The company should distinguish costs that genuinely arise from holding inventory from expenses that would exist regardless of inventory levels.
Insurance and Taxes
Certain insurance costs and jurisdiction-dependent inventory-related taxes can increase the cost of carrying stock.
The relevant amount should reflect the actual economic exposure associated with inventory rather than an arbitrary allocation.
Shrinkage, Damage, and Deterioration
Inventory can disappear, break, spoil, expire, or become unusable.
Suppose average inventory is $800,000 and annual shrinkage attributable to stock losses is $16,000.
Shrinkage Cost Rate = $16,000 ÷ $800,000 × 100 = 2%
Even relatively small loss percentages can become material on a large inventory base.
Obsolescence
Products can lose value before being sold.
Technology products can become outdated. Fashion products can go out of season. Food can expire. Replacement components can become unnecessary when the underlying equipment is discontinued.
If $25,000 of inventory must be written down or disposed of because it becomes obsolete, that economic loss is part of the broader cost of holding excessive or slow-moving stock.
Carrying Cost Per Unit
Inventory carrying cost can also be expressed per unit.
Suppose annual carrying cost is $100,000 and average physical inventory is 20,000 units.
Annual Carrying Cost per Unit = $100,000 ÷ 20,000
Annual Carrying Cost per Unit = $5
The company is effectively incurring approximately $5 per average unit held per year.
This figure can be useful in operational models when the units are sufficiently comparable.
If products differ substantially in size, value, risk, storage needs, or obsolescence exposure, applying one identical per-unit rate to everything can be misleading.
Inventory Carrying Cost Rate Example
Suppose another business has:
- Average inventory: $1,200,000
- Capital cost: $96,000
- Storage: $72,000
- Insurance: $12,000
- Damage and shrinkage: $24,000
- Obsolescence: $36,000
Total annual carrying cost:
$96,000 + $72,000 + $12,000 + $24,000 + $36,000 = $240,000
Carrying cost rate:
$240,000 ÷ $1,200,000 × 100 = 20%
Each $100 of average inventory is therefore associated with approximately $20 of annual carrying cost under this model.
How Higher Inventory Increases Carrying Cost
Assume a company maintains a 25% carrying cost rate.
At average inventory of $400,000:
Carrying Cost = $400,000 × 25% = $100,000
Suppose average inventory rises to $550,000 without any change in the carrying-cost rate:
New Carrying Cost = $550,000 × 25% = $137,500
Increase:
$137,500 − $100,000 = $37,500
A $150,000 increase in average inventory produces an estimated $37,500 increase in annual carrying cost.
This demonstrates why excess stock has a financial cost even when the inventory eventually remains saleable.
How Lower Inventory Can Reduce Carrying Cost
Suppose average inventory falls from $800,000 to $600,000 and the carrying-cost rate remains 20%.
Original annual carrying cost:
$800,000 × 20% = $160,000
New carrying cost:
$600,000 × 20% = $120,000
Estimated saving:
$160,000 − $120,000 = $40,000
Reducing average inventory by $200,000 lowers estimated annual carrying cost by $40,000.
However, reducing inventory too far can create stockouts, lost sales, emergency freight, and production disruptions. The goal is not necessarily minimum inventory; it is economically appropriate inventory.
Inventory Carrying Cost and Economic Order Quantity
Inventory carrying cost is a central input in economic order quantity analysis.
The EOQ formula balances ordering cost with annual holding cost per unit:
EOQ = √((2 × Annual Demand × Ordering Cost) ÷ Annual Holding Cost per Unit)
If holding inventory becomes more expensive, the economically efficient order quantity generally decreases, all else equal.
For example, assume:
- Annual demand: 10,000 units
- Ordering cost: $50
- Holding cost: $2 per unit
EOQ is approximately:
√((2 × 10,000 × 50) ÷ 2) ≈ 707 units
If annual holding cost rises to $8 per unit:
√((2 × 10,000 × 50) ÷ 8) ≈ 354 units
The higher carrying cost makes smaller, more frequent orders comparatively attractive.
Inventory Carrying Cost vs. Inventory Value
Inventory value and carrying cost are different.
Inventory value measures the recorded value of the stock itself.
Carrying cost measures what it costs to continue holding that stock.
Suppose inventory value is $500,000 and annual carrying cost is $100,000.
The company does not have $600,000 of inventory.
It has $500,000 of inventory plus an estimated $100,000 annual economic cost associated with maintaining that inventory level.
Keeping the concepts separate prevents carrying-cost estimates from being mistakenly added directly to the inventory asset balance without an accounting basis.
Inventory Carrying Cost vs. Cost of Goods Sold
Carrying cost is also different from cost of goods sold.
COGS represents the applicable product costs assigned to goods that have been sold.
Carrying cost represents the cost associated with keeping stock before sale.
Suppose a retailer owns products costing $300,000.
Those goods may remain inventory while creating storage, financing, insurance, and obsolescence costs.
Once units are sold, their applicable product cost can move into COGS. The carrying costs do not automatically become part of cost of goods sold merely because they relate economically to inventory.
The accounting classification depends on the specific cost and applicable accounting treatment.
Inventory Carrying Cost and the Income Statement
Different components of carrying cost can affect the income statement in different ways.
Warehouse expenses may be recognized as operating expenses or included elsewhere depending on their function.
Certain inventory-related costs can be included in product cost when accounting rules permit or require it.
Obsolescence or shrinkage can create recognized losses or inventory adjustments.
Financing costs can have separate treatment.
For that reason, the management measure called “inventory carrying cost” should not be assumed to correspond to one single income-statement line.
It is an economic framework that can combine several costs that accounting statements classify separately.
Inventory Carrying Cost and Gross Burn
Some inventory carrying costs also create cash outflows that contribute to gross burn.
Warehouse rent, insurance payments, handling labor, security, and certain other costs can consume cash.
However, carrying cost and gross burn should not be treated as interchangeable.
Gross burn measures cash spending before relevant inflows.
Inventory carrying cost estimates the economic cost specifically associated with holding inventory.
Some carrying costs can be noncash or opportunity-cost estimates, while gross burn focuses on actual cash expenditure.
Inventory Carrying Cost and Net Burn
Net burn considers how much cash a business consumes after relevant cash inflows.
Inventory can influence net burn in several ways.
Purchasing excess inventory can consume cash upfront.
Storage and handling add continuing cash expenses.
Slow-moving goods delay the conversion of invested cash back into customer receipts.
A company might therefore improve liquidity by reducing unnecessary inventory even if revenue remains unchanged.
Still, a carrying-cost rate should not be substituted into a net-burn calculation. One is an inventory economics metric; the other is a cash-consumption metric.
Inventory Carrying Cost and Labor Productivity
Warehouse labor forms part of inventory economics when employees spend time receiving, moving, counting, storing, picking, and managing stock.
Poor labor productivity can increase the cost of managing inventory.
Suppose a warehouse requires 5,000 labor hours per month to process its current activity.
If layout improvements reduce the same workload to 4,000 hours without harming accuracy or service, labor input has fallen by:
5,000 − 4,000 = 1,000 Hours
The improvement may reduce handling costs associated with inventory.
However, labor productivity and inventory carrying cost remain separate measures. Productivity compares output with labor input; carrying cost measures the broader economic burden of holding stock.
Carrying Cost and Slow-Moving Inventory
Slow-moving inventory is particularly expensive because carrying costs accumulate for longer.
Suppose $200,000 of stock remains unsold for a year and the carrying-cost rate is 25%.
Estimated annual carrying cost associated with that inventory is:
$200,000 × 25% = $50,000
If the products also lose market value during the year, the economic impact can be even larger.
This is why slow-moving stock can be costly even before it becomes completely obsolete.
Carrying Cost and Obsolete Inventory
Suppose a business holds $100,000 of a product line that becomes obsolete.
Before the write-down or disposal is even considered, the company may already have incurred financing, storage, insurance, labor, and handling costs to keep the goods.
The longer obsolete inventory remains unidentified, the more additional resources may be spent maintaining products that no longer have normal selling potential.
Effective inventory reviews therefore examine both accounting value and ongoing carrying burden.
Carrying Cost and Seasonal Inventory
Seasonal businesses may intentionally accept higher carrying costs before peak demand periods.
Suppose average inventory normally equals $300,000 but rises to $900,000 for three months before the holiday season.
Using only annual beginning and ending inventory could miss this temporary buildup.
If the carrying-cost rate is 24% annually, an approximate monthly rate is:
24% ÷ 12 = 2% per Month
The additional $600,000 held for three months creates an approximate carrying cost of:
$600,000 × 2% × 3 = $36,000
That $36,000 may be economically justified if the seasonal inventory supports profitable sales that otherwise could not be captured.
Carrying Cost and Safety Stock
Safety stock protects against uncertain demand or replenishment delays, but it also increases average inventory.
Suppose average cycle inventory is 1,000 units and the company keeps another 300 units as safety stock.
Average inventory becomes approximately:
1,000 + 300 = 1,300 Units
If annual carrying cost is $6 per unit:
Annual Carrying Cost = 1,300 × $6 = $7,800
Without the 300-unit buffer:
1,000 × $6 = $6,000
The safety stock therefore adds approximately:
$7,800 − $6,000 = $1,800
of annual carrying cost.
That additional cost needs to be weighed against the economic cost of potential stockouts.
Carrying Cost and Working Capital
Inventory ties up working capital until it is sold and converted into receivables or cash.
Suppose a business reduces average inventory from $700,000 to $550,000 without affecting customer service.
The reduction releases:
$700,000 − $550,000 = $150,000
of capital previously invested in inventory.
At a 20% carrying-cost rate, the related estimated annual carrying-cost reduction is:
$150,000 × 20% = $30,000
The company potentially gains both improved liquidity and lower carrying cost.
Carrying Cost Percentage Is Not Universal
There is no single inventory carrying cost percentage that applies to every business.
A low-value, durable industrial component may have very different economics from perishable food, fashion products, pharmaceuticals, luxury goods, or rapidly depreciating electronics.
Relevant rates depend on factors such as:
- financing cost;
- storage requirements;
- product value;
- insurance;
- spoilage risk;
- theft exposure;
- obsolescence;
- seasonality; and
- inventory-management efficiency.
A company should therefore build its rate from its own economics rather than adopting an arbitrary industry percentage without analysis.
Common Inventory Carrying Cost Mistakes
One common mistake is calculating carrying cost from ending inventory only even when stock levels fluctuate substantially.
Another is counting the entire warehouse budget as incremental carrying cost regardless of whether those expenses actually change with inventory.
Businesses can also ignore the cost of capital because no explicit invoice exists for opportunity cost.
Another error is overlooking shrinkage and obsolescence, which can be substantial for certain products.
Some companies double-count costs by including the same expense in both the carrying-cost rate and a separate per-unit assumption.
Finally, carrying cost should not be minimized without considering availability. Excessive inventory is expensive, but insufficient inventory can create lost sales, service failures, and production interruptions.
Frequently Asked Questions
What is inventory carrying cost in simple terms?
Inventory carrying cost is the economic cost of keeping unsold inventory on hand.
It can include capital, storage, insurance, handling, shrinkage, deterioration, and obsolescence costs.
What is the inventory carrying cost formula?
A common formula is:
Inventory Carrying Cost = Average Inventory Value × Carrying Cost Rate
How do you calculate the inventory carrying cost rate?
Use:
Carrying Cost Rate = Total Annual Carrying Costs ÷ Average Inventory Value × 100
If annual carrying costs are $80,000 and average inventory is $400,000, the rate is 20%.
Is inventory carrying cost the same as inventory value?
No.
Inventory value measures the stock itself. Carrying cost measures the economic cost of continuing to hold that inventory.
Is inventory carrying cost the same as COGS?
No.
COGS relates to product costs assigned to goods sold. Inventory carrying cost relates to costs generated by holding inventory.
Does warehouse rent count as inventory carrying cost?
It can, to the extent that the cost is economically associated with holding inventory.
Businesses should avoid automatically allocating fixed facility costs that would exist regardless of inventory levels unless the allocation is appropriate for the analysis.
Does cost of capital belong in carrying cost?
It commonly does because cash invested in inventory cannot be used elsewhere and may require financing.
The appropriate rate depends on the company’s analytical framework.
Why does obsolete inventory have a high carrying cost?
Obsolete stock ties up capital and consumes storage, handling, and management resources while offering reduced or nonexistent sales potential.
Does higher safety stock increase carrying cost?
Generally, yes.
Additional safety stock raises average inventory, which increases carrying cost when the carrying-cost rate is positive.
How does EOQ use inventory carrying cost?
EOQ uses annual holding cost per unit as one of its principal inputs. Higher holding cost generally reduces the calculated economic order quantity, all else equal.
Can reducing inventory carrying cost improve cash flow?
It can.
Reducing unnecessary inventory may release cash tied up in stock and can also lower storage, handling, insurance, and other cash costs.
What is a good inventory carrying cost rate?
There is no universal good percentage. The appropriate rate depends on the product, industry, financing, storage requirements, obsolescence risk, shrinkage, and other company-specific economics.




