


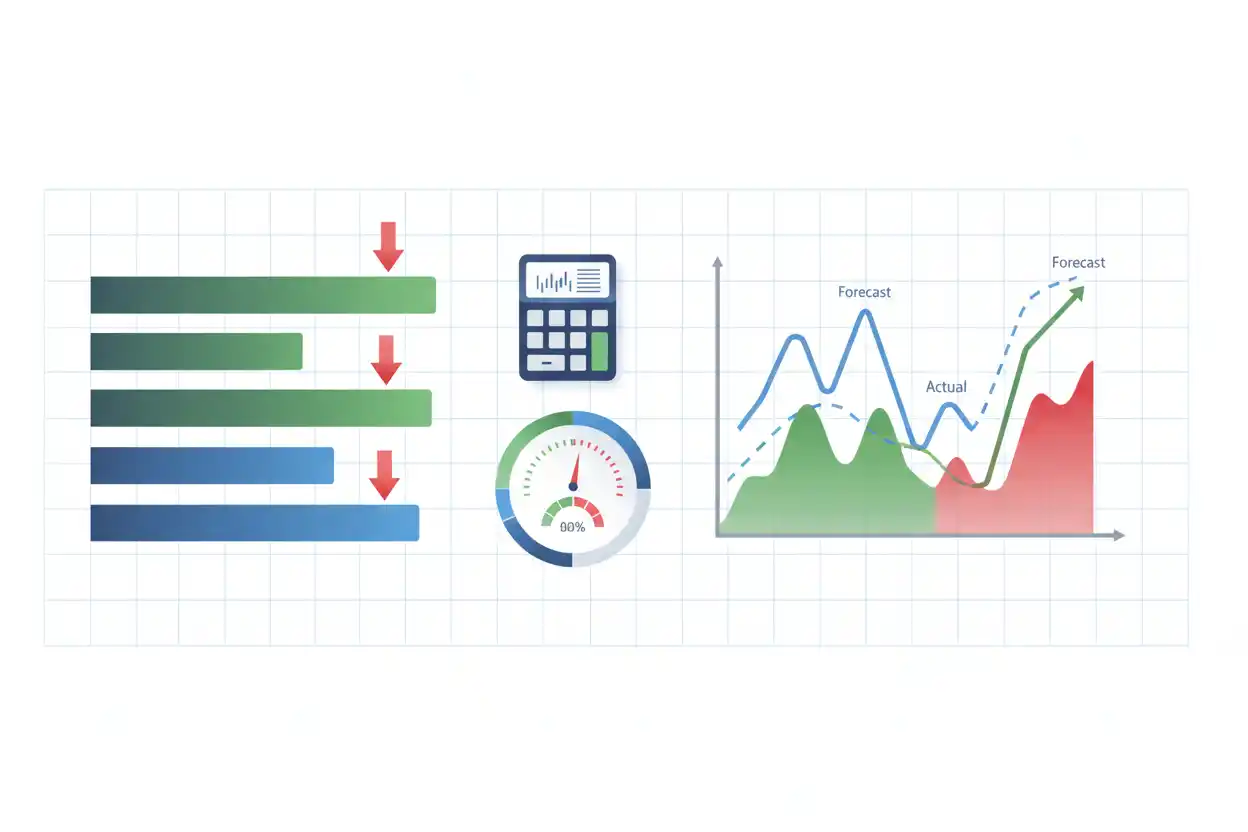
Forecast variance is the difference between an actual result and the amount previously forecast for the same metric and period. It shows how closely a forecast matched what ultimately happened.
If a company forecast $500,000 of monthly revenue but generated $540,000, revenue exceeded the forecast by $40,000. If it forecast $200,000 of expenses but actually spent $215,000, costs exceeded the forecast by $15,000.
The calculation is simple, but interpretation depends on the metric. A positive revenue variance can be favorable, while a positive expense variance can be unfavorable when the formula uses actual minus forecast.
What Is Forecast Variance?
Forecast variance measures the gap between an expected future result and the corresponding actual result.
Businesses can calculate forecast variance for:
- revenue;
- units sold;
- expenses;
- cash flow;
- gross profit;
- headcount;
- inventory demand;
- production volume; or
- other measurable operating and financial variables.
The forecast must relate to the same period, scope, and measurement basis as the actual figure.
Comparing a full-quarter actual result with a one-month forecast, for example, would not produce a meaningful variance.
Forecast Variance Formula
A common formula is:
Forecast Variance = Actual Result − Forecast Result
The percentage version is:
Forecast Variance % = (Actual Result − Forecast Result) ÷ Forecast Result × 100
This convention makes a result above forecast positive and a result below forecast negative.
However, the sign does not automatically mean favorable or unfavorable.
For revenue, actual results above forecast may generally be favorable.
For costs, actual spending above forecast may generally be unfavorable.
That distinction should always be stated when presenting forecast variance.
Forecast Variance Example
Suppose a business forecast monthly revenue of $400,000.
Actual revenue was $428,000.
Apply the formula:
Forecast Variance = $428,000 − $400,000 = $28,000
Revenue was $28,000 above forecast.
Now calculate the percentage:
Forecast Variance % = $28,000 ÷ $400,000 × 100 = 7%
Actual revenue was therefore 7% above forecast.
For a revenue metric, management may describe this as a 7% favorable variance, assuming higher revenue is economically favorable in the circumstances.
Expense Forecast Variance Example
Suppose operating costs were forecast at $150,000, but actual costs reached $162,000.
Forecast Variance = $162,000 − $150,000 = $12,000
Percentage variance:
Forecast Variance % = $12,000 ÷ $150,000 × 100 = 8%
Costs were 8% above forecast.
Because the metric is expense, the result would ordinarily be described as 8% unfavorable, provided the additional spending did not produce offsetting benefits.
The same positive mathematical sign therefore has a different business interpretation from a positive revenue variance.
Revenue Below Forecast Example
Assume a company forecast $800,000 of quarterly revenue but generated only $740,000.
Forecast Variance = $740,000 − $800,000 = −$60,000
Percentage variance:
Forecast Variance % = −$60,000 ÷ $800,000 × 100 = −7.5%
Revenue finished $60,000, or 7.5%, below forecast.
The negative sign indicates that actual revenue was lower than expected.
For revenue, this would generally be unfavorable.
Why Forecast Variance Matters
Forecasting is useful only when the business later compares expectations with reality.
A forecast that is never evaluated provides little information about whether the assumptions behind it were reliable.
Forecast variance helps management answer questions such as:
Was demand stronger or weaker than expected?
Did costs rise faster than anticipated?
Were hiring assumptions realistic?
Did customer collections occur on schedule?
Was the forecast consistently optimistic or conservative?
The objective is not merely to make every variance equal zero. Some uncertainty is unavoidable.
The more useful goal is understanding why forecasts missed and whether future assumptions should change.
Forecast Variance vs. Budget Variance
Forecast variance and budget variance are related but use different benchmarks.
A budget is usually an approved plan established for a defined period.
A forecast is generally an updated expectation of what management currently believes will happen.
Suppose a business begins the year with:
- Annual budgeted revenue: $5 million
- Updated forecast: $4.6 million
- Actual revenue: $4.8 million
Compared with budget:
Budget Variance = $4.8M − $5.0M = −$0.2M
Actual revenue was $200,000 below budget.
Compared with the updated forecast:
Forecast Variance = $4.8M − $4.6M = +$0.2M
Actual revenue was $200,000 above forecast.
Both calculations are correct because they answer different questions.
The budget comparison evaluates performance against the original plan. The forecast comparison evaluates the accuracy of the later expectation.
Forecast Variance vs. Cost Variance
A cost variance specifically examines differences in costs against a budget, standard, expected amount, or another cost benchmark.
Forecast variance is broader.
It can apply to revenue, cash, customers, units, headcount, or costs.
If a company forecast material cost at $25 per unit and actual comparable cost was $27, that difference can be analyzed as both a forecast deviation and, depending on the benchmark structure, part of cost-variance analysis.
The pages should remain conceptually distinct: forecast variance evaluates forecast accuracy, while cost variance focuses on cost performance.
Forecast Variance and the Income Statement
Many forecast variances eventually appear through differences in income statement results.
Suppose management forecast:
| Item | Forecast | Actual | Variance |
|---|---|---|---|
| Revenue | $500,000 | $525,000 | +$25,000 |
| Cost of sales | $300,000 | $325,000 | +$25,000 |
| Operating expenses | $120,000 | $118,000 | -$2,000 |
Revenue exceeded forecast, but cost of sales also exceeded forecast.
Looking only at the positive revenue variance could therefore give an incomplete picture.
The underlying profit impact depends on how the individual revenue and expense differences interact.
Gross Profit Forecast Variance Example
Using the figures above:
Forecast gross profit:
Forecast Gross Profit = $500,000 − $300,000 = $200,000
Actual gross profit:
Actual Gross Profit = $525,000 − $325,000 = $200,000
Gross profit variance:
$200,000 − $200,000 = $0
Revenue exceeded forecast by $25,000, but the additional cost of sales absorbed the entire increase.
This illustrates why forecasting should examine related drivers rather than celebrate isolated favorable numbers.
Forecast Variance and Depreciation Expense
Depreciation expense can also differ from forecast.
Assume the company forecast monthly depreciation of $20,000.
Because new equipment entered service sooner than expected, actual depreciation is $23,000.
Forecast Variance = $23,000 − $20,000 = $3,000
Depreciation expense was $3,000 above forecast.
However, this does not mean the company had an additional $3,000 cash outflow that month. Depreciation is a noncash expense when recorded.
The reason behind a variance matters as much as the arithmetic.
Forecast Variance and Cash Flow
Forecasting profit and forecasting cash are different exercises.
A business may correctly forecast revenue but still miss its cash projection because customers pay more slowly than expected.
Suppose forecast customer collections were $300,000, but only $255,000 arrived.
Cash Collection Variance = $255,000 − $300,000 = −$45,000
The business collected $45,000 less cash than forecast even if recognized revenue was close to expectations.
Comparing these movements with the cash flow statement helps distinguish accounting performance from actual liquidity.
Forecast Variance and Gross Burn
For a cash-consuming business, gross burn can also deviate from forecast.
Suppose management expected monthly gross cash spending of $180,000, but actual gross burn reached $198,000.
Gross Burn Forecast Variance = $198,000 − $180,000 = $18,000
Percentage variance:
$18,000 ÷ $180,000 × 100 = 10%
Gross burn was 10% above forecast.
Management would then investigate whether the difference came from payroll, supplier payments, marketing, infrastructure, professional fees, or another cash-spending category.
Forecast Variance in Inventory Planning
Forecast variance is especially important when demand assumptions influence purchasing.
Suppose annual demand used in an economic order quantity model was forecast at 20,000 units, but actual annual demand reached 24,000.
Demand variance:
24,000 − 20,000 = 4,000 units
Percentage variance:
4,000 ÷ 20,000 × 100 = 20%
Actual demand was 20% above forecast.
If the difference appears structural rather than temporary, management may need to revise the demand input used in future inventory calculations.
The forecast variance itself does not calculate a new EOQ. It identifies that an underlying planning assumption changed materially.
Forecast Variance and Accounting Records
Forecasts are planning tools, not transaction records.
Double-entry bookkeeping records actual financial events through balanced accounting entries.
Suppose payroll was forecast at $90,000 but actual payroll expense was $96,000.
The accounting system records the actual $96,000 through the appropriate accounts.
Forecast analysis separately calculates:
$96,000 − $90,000 = $6,000 Above Forecast
The forecast does not replace the actual accounting entry.
Absolute Forecast Variance
Sometimes analysts care about the size of the forecast error regardless of whether the actual result was above or below forecast.
An absolute variance removes the sign:
Absolute Forecast Variance = |Actual − Forecast|
Suppose forecast revenue was $100,000.
Scenario A has actual revenue of $110,000:
Absolute Variance = |$110,000 − $100,000| = $10,000
Scenario B has actual revenue of $90,000:
Absolute Variance = |$90,000 − $100,000| = $10,000
Both forecasts missed by $10,000 in absolute terms, although the business implications are different.
Absolute variance can therefore help measure forecast accuracy without mixing accuracy with favorable/unfavorable performance.
Forecast Error vs. Business Performance
A favorable business result can still represent poor forecasting.
Suppose revenue was forecast at $1 million but reached $1.5 million.
The additional $500,000 may be excellent commercially, but the forecast missed by 50%.
That large miss could create operational problems if inventory, staffing, working capital, or capacity had been planned around the original $1 million expectation.
Likewise, a very accurate forecast does not mean performance was good.
A company can accurately forecast a substantial loss.
Forecast accuracy and business performance are related but separate dimensions.
Favorable Variance Does Not Always Mean Better
Consider an expense forecast of $100,000 with actual spending of $80,000.
At first glance:
Forecast Variance = $80,000 − $100,000 = −$20,000
Costs were 20% below forecast.
That might be favorable if efficiency improved.
But suppose the underspending resulted from delayed maintenance that later caused a production shutdown.
The numerical variance did not capture the downstream consequence.
This is why variance review should include operational context.
Unfavorable Variance Does Not Always Mean Worse
Suppose marketing spending was forecast at $50,000 but actual spending reached $65,000.
The $15,000 overspend is unfavorable against the cost forecast.
However, if the additional investment produced profitable new sales substantially above expectations, management may conclude that the decision was economically justified.
Variance labels describe performance against the benchmark. They do not automatically determine whether the underlying decision created value.
Forecast Variance by Month
Tracking repeated variances can reveal systematic forecasting bias.
| Month | Forecast Revenue | Actual Revenue | Variance |
|---|---|---|---|
| January | $200,000 | $185,000 | -$15,000 |
| February | $210,000 | $192,000 | -$18,000 |
| March | $220,000 | $199,000 | -$21,000 |
| April | $225,000 | $201,000 | -$24,000 |
A single miss may be random.
Four consecutive below-forecast results suggest the assumptions may be consistently optimistic.
The corrective action may therefore be to improve the forecasting model rather than repeatedly explaining each month as an isolated event.
How to Analyze Forecast Variance
A useful variance review starts by confirming that actual and forecast data are comparable.
Then identify the largest deviations and separate volume effects from price, cost, timing, and mix effects where possible.
For example, a revenue miss could result from:
Lower volume. Fewer units were sold.
Lower price. Selling prices were below expectations.
Product mix. Customers purchased more lower-priced products.
Timing. Expected sales shifted into another period.
Forecast assumptions. The original demand estimate was unrealistic.
Identifying the driver produces better information than simply reporting that revenue was 8% below forecast.
Materiality and Forecast Variance
Not every forecast variance requires investigation.
Suppose one department is $10,000 above forecast on a $50,000 cost base:
$10,000 ÷ $50,000 = 20%
Another is $50,000 above forecast on a $10 million cost base:
$50,000 ÷ $10,000,000 = 0.5%
The second has the larger dollar difference, while the first has a much larger proportional miss.
Materiality should therefore consider percentage, absolute value, recurrence, controllability, and potential business impact.
Common Forecast Variance Mistakes
One mistake is comparing figures from different time periods or scopes.
Another is treating the mathematical sign as automatically favorable or unfavorable without considering whether the metric is revenue, expense, cash, or another measure.
Businesses also make poor decisions when they analyze only the total variance and ignore the underlying drivers.
Another error is repeatedly updating a forecast and then comparing actual results only with the latest estimate. That may measure recent forecast accuracy but hide how far results moved from the original plan.
Finally, forecast variance should not be confused with accounting error. A variance can arise because the forecast was wrong even when the actual accounting records are completely correct.
Frequently Asked Questions
What is forecast variance in simple terms?
Forecast variance is the difference between what actually happened and what was forecast to happen for the same metric and period.
What is the forecast variance formula?
A common formula is:
Forecast Variance = Actual Result − Forecast Result
How do you calculate forecast variance percentage?
Use:
Forecast Variance % = (Actual − Forecast) ÷ Forecast × 100
If actual revenue is $110,000 and forecast revenue is $100,000, the variance is 10%.
Is a positive forecast variance good?
It depends on the metric.
For revenue, a positive variance may generally be favorable.
For expenses or cash burn, a positive actual-minus-forecast variance may be unfavorable because costs exceeded expectations.
Is a negative forecast variance bad?
Not necessarily.
Revenue below forecast may be unfavorable, but expenses below forecast can be favorable if the savings did not damage performance.
What is the difference between forecast variance and budget variance?
Forecast variance compares actual results with forecast expectations.
Budget variance compares actual results with the approved budget or plan.
A business can be above forecast while still below its original budget.
Can forecast variance be zero?
Yes.
A zero variance means the actual result exactly matched the forecast for that metric.
What is absolute forecast variance?
Absolute forecast variance measures the size of the difference without considering direction:
Absolute Variance = |Actual − Forecast|
It is useful when the objective is evaluating forecast accuracy rather than whether performance was favorable or unfavorable.
Why can an accurate forecast still represent poor performance?
Forecast accuracy measures how closely actual results matched expectations.
If the company accurately forecasts a loss, the forecast may be excellent even though business performance is poor.
Why should forecast variance be tracked over time?
Repeated misses in the same direction can reveal systematic bias, outdated assumptions, or a forecasting model that needs improvement.
A single variance may be random; a recurring pattern is more informative.




