


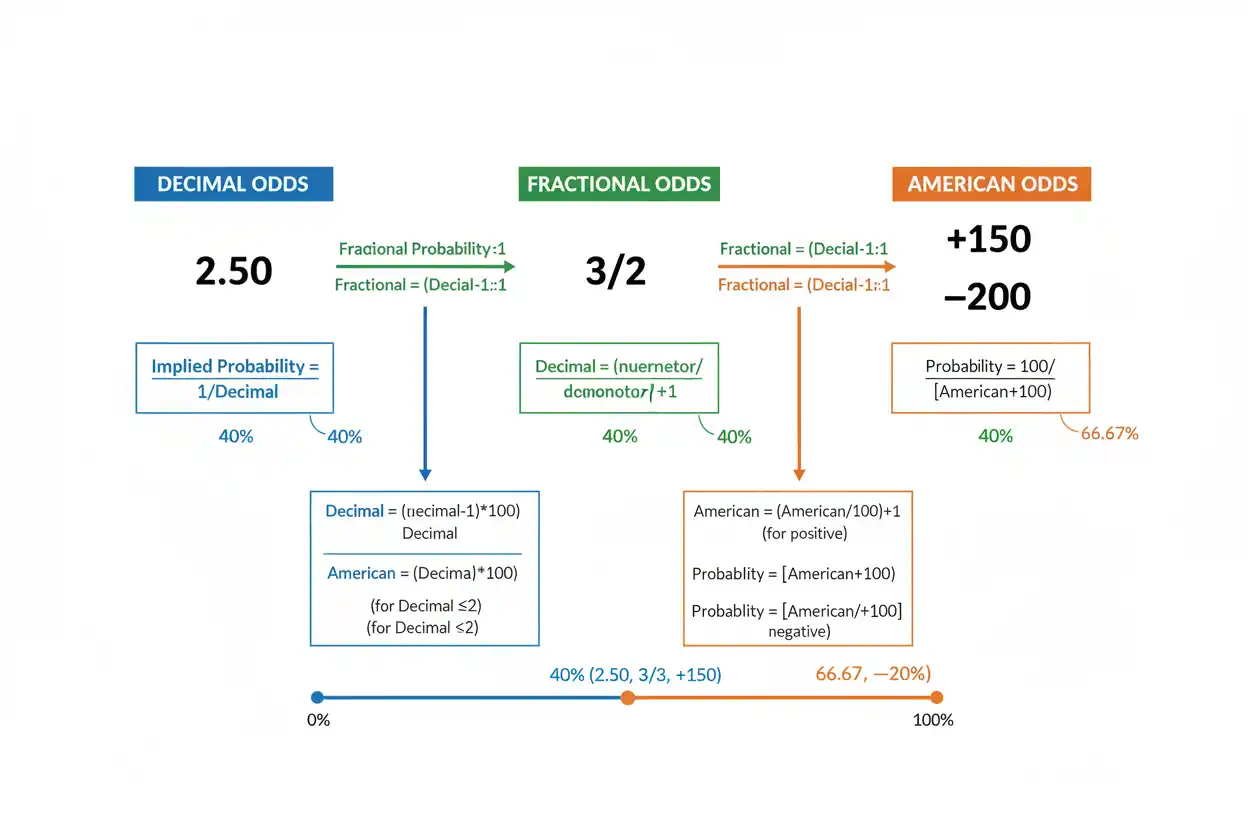
Odds formats are different numerical ways of expressing the relationship between the chance of an event occurring and the return associated with that probability representation. The most common odds formats are decimal odds, fractional odds, and American odds, while probability itself can also be expressed directly as a percentage or as odds in favor and odds against. Although the notation changes, equivalent odds formats can represent exactly the same underlying implied probability. For example, decimal odds of 2.50, fractional odds of 3/2, and American odds of +150 all correspond to an implied probability of 40% before any adjustment for margin. Converting odds formats correctly therefore depends on distinguishing total return from profit, positive from negative American odds, and probability from the payout-style odds convention. In markets containing multiple mutually exclusive outcomes, the individual implied probabilities can also sum to more than 100%, reflecting an embedded margin rather than a valid probability distribution by themselves. Understanding these relationships is useful well beyond any particular application because odds are simply another mathematical language for expressing uncertainty, ratios, and probability.
Odds formats sit within the probability side of core statistics and the broader Statistics & Probability framework. They should be distinguished from probability models such as the normal distribution, which generate probabilities from statistical assumptions; odds formats merely provide alternative ways to express a probability once it has been determined.
What Are Odds Formats?
Odds formats are conventions for representing event likelihood and, in some contexts, the return associated with that likelihood.
The three most familiar formats are:
Decimal odds
Fractional odds
American odds
A fourth representation is direct probability:
Probability = p
or:
Percentage probability = 100p%
For example, the following are equivalent under fair conversion:
Decimal odds = 2.50
Fractional odds = 3/2
American odds = +150
Implied probability = 0.40
Implied probability = 40%
The numbers look different because each format uses a different reference point.
The underlying event likelihood is the same.
What Is Implied Probability?
Implied probability is the probability associated mathematically with a stated set of odds.
If decimal odds are:
D
then:
Implied probability = 1/D
For example:
D = 2.50
so:
p = 1/2.50
p = 0.40
Therefore:
Implied probability = 40%
The word implied matters.
If the quoted odds contain a margin, fee, spread, or other adjustment, the raw implied probability is not necessarily a pure estimate of the real-world chance of the event.
It is the probability encoded by the quoted odds before any such adjustment is removed.
Probability vs Odds
Probability and odds are closely related but not identical.
Probability expresses:
favorable outcomes / all outcomes
Odds in favor express:
favorable outcomes / unfavorable outcomes
If an event has probability:
p
then probability of the event not occurring is:
1 − p
Odds in favor are:
p/(1 − p)
Odds against are:
(1 − p)/p
For example, if:
p = 0.75
then:
Odds in favor = 0.75/0.25
= 3
which can be written as:
3:1 in favor
Odds against are:
0.25/0.75
= 1/3
or:
1:3 against
Probability and odds encode the same information but use different denominators.
Converting Probability to Odds in Favor
If:
P(event) = p
then:
Odds in favor = p/(1 − p)
Suppose:
p = 0.60
Then:
Odds in favor = 0.60/0.40
= 1.5
As a ratio:
1.5:1
or equivalently:
3:2
Thus, a 60% probability corresponds to odds in favor of:
3:2
Converting Odds in Favor to Probability
Suppose odds in favor are:
a:b
meaning:
a favorable units for every b unfavorable units
Then:
p = a/(a + b)
For example:
Odds in favor = 3:2
Therefore:
p = 3/(3 + 2)
p = 3/5
p = 0.60
So the probability is:
60%
Converting Odds Against to Probability
If odds against an event are:
a:b
where a represents unfavorable outcomes and b represents favorable outcomes, then:
p = b/(a + b)
For example:
Odds against = 4:1
means four unfavorable outcomes for every one favorable outcome.
Therefore:
p = 1/(4 + 1)
p = 0.20
So:
Probability = 20%
It is essential to know whether a ratio is being stated in favor or against, because reversing the interpretation reverses the probability.
Decimal Odds
Decimal odds are one of the simplest odds formats mathematically.
If decimal odds are:
D
then a unit stake corresponds to a total modeled return of:
D units
including the original unit.
The implied probability formula is:
p = 1/D
The percentage form is:
Implied probability (%) = 100/D
For example:
Decimal odds = 4.00
Then:
p = 1/4
p = 0.25
Therefore:
Implied probability = 25%
Decimal Odds Example
Suppose:
D = 1.60
Then:
p = 1/1.60
p = 0.625
Therefore:
Implied probability = 62.5%
Because the decimal number is relatively close to 1, the associated implied probability is relatively high.
By contrast:
D = 10.00
gives:
p = 1/10
= 10%
Thus:
Lower decimal odds → higher implied probability
Higher decimal odds → lower implied probability
Converting Probability to Decimal Odds
If probability is:
p
then fair decimal odds are:
D = 1/p
For example:
p = 0.20
Then:
D = 1/0.20
D = 5.00
For:
p = 0.80
we obtain:
D = 1/0.80
D = 1.25
The reciprocal relationship means probability and decimal odds move in opposite directions.
Decimal Odds and Net Ratio
Decimal odds represent total return relative to one unit.
The corresponding net ratio is:
D − 1
For:
D = 2.50
the net ratio is:
2.50 − 1
= 1.50
That net ratio corresponds to fractional odds:
3/2
This is the key relationship between decimal and fractional odds formats.
Fractional Odds
Fractional odds are commonly written:
a/b
They describe a net-return ratio of:
a units relative to b units
The corresponding decimal odds are:
D = 1 + a/b
The implied probability is:
p = b/(a + b)
For example:
Fractional odds = 3/2
Then:
p = 2/(3 + 2)
p = 2/5
p = 0.40
Therefore:
Implied probability = 40%
Why Fractional Probability Uses b/(a+b)
Fractional odds:
a/b
represent a net ratio corresponding to:
a units of net return for b units of base amount
The total return ratio is therefore:
(a + b)/b
So decimal odds are:
D = (a + b)/b
Taking the reciprocal:
p = b/(a + b)
This derivation avoids memorizing the formula without understanding it.
Fractional Odds Example
Suppose:
Fractional odds = 5/4
Then:
p = 4/(5 + 4)
p = 4/9
p ≈ 0.4444
Therefore:
Implied probability ≈ 44.44%
The decimal equivalent is:
D = 1 + 5/4
D = 2.25
Check:
1/2.25 ≈ 0.4444
The two methods agree.
Fractional Odds Below 1
Fractional odds do not have to be greater than:
1/1
For example:
1/2
corresponds to:
p = 2/(1 + 2)
p = 2/3
p ≈ 66.67%
The decimal equivalent is:
1 + 1/2
= 1.50
A fraction smaller than 1 therefore represents an implied probability greater than 50%.
Even Odds
A probability of:
50%
corresponds to equal favorable and unfavorable likelihood.
Odds in favor are:
1:1
Fractional odds are:
1/1
Decimal odds are:
2.00
American odds are:
+100
under the usual convention.
Therefore, the 50% benchmark provides a useful conversion reference across odds formats.
American Odds
American odds use positive or negative numbers around a 100-unit reference.
Examples include:
+150
−200
Positive and negative American odds require different formulas.
The sign is not simply directional notation.
It determines which quantity is being referenced.
Positive American Odds
For positive American odds:
+A
where:
A > 0
the implied probability is:
p = 100/(A + 100)
For example:
+150
gives:
p = 100/(150 + 100)
p = 100/250
p = 0.40
Therefore:
Implied probability = 40%
The equivalent decimal odds are:
D = 1 + A/100
For:
+150
we obtain:
D = 1 + 150/100
D = 2.50
Positive American Odds Example
Suppose:
American odds = +300
Then:
p = 100/(300 + 100)
p = 100/400
p = 0.25
Therefore:
Implied probability = 25%
Decimal equivalent:
D = 1 + 300/100
D = 4.00
Fractional equivalent:
300/100
= 3/1
So:
+300 = 3/1 = 4.00 = 25%
under fair conversion.
Negative American Odds
For negative American odds:
−A
it is convenient to use the absolute magnitude:
|A|
The implied probability is:
p = |A|/(|A| + 100)
For example:
American odds = −200
Then:
p = 200/(200 + 100)
p = 200/300
p ≈ 0.6667
Therefore:
Implied probability ≈ 66.67%
The decimal equivalent is:
D = 1 + 100/|A|
For:
−200
we obtain:
D = 1 + 100/200
D = 1.50
Negative American Odds Example
Suppose:
American odds = −400
Then:
p = 400/(400 + 100)
p = 400/500
p = 0.80
Therefore:
Implied probability = 80%
Decimal equivalent:
D = 1 + 100/400
D = 1.25
Fractional equivalent:
100/400
= 1/4
Thus:
−400 = 1/4 = 1.25 = 80%
under fair conversion.
Why American Odds Change Sign at 50%
At:
p = 0.50
the fair reference is:
+100
or even odds.
For probabilities below 50%, American odds are conventionally positive.
For probabilities above 50%, they are conventionally negative.
The two formulas therefore meet at the 50% boundary.
For example:
p = 0.40 → +150
while:
p = 0.60 → −150
These numbers have the same magnitude but represent probabilities on opposite sides of 50%.
Converting Probability to Positive American Odds
If:
p ≤ 0.50
then fair positive American odds can be calculated as:
A = 100(1 − p)/p
For:
p = 0.25
we have:
A = 100(0.75)/0.25
A = 300
Therefore:
American odds = +300
Check:
100/(300 + 100) = 0.25
Converting Probability to Negative American Odds
If:
p > 0.50
then fair negative American odds are:
A = −100p/(1 − p)
For:
p = 0.75
we have:
A = −100(0.75)/0.25
A = −300
Therefore:
American odds = −300
Check:
300/(300 + 100)
= 0.75
Conversion Table for Common Odds Formats
| Implied Probability | Decimal | Fractional | American |
|---|---|---|---|
| 20% | 5.00 | 4/1 | +400 |
| 25% | 4.00 | 3/1 | +300 |
| 33.33% | 3.00 | 2/1 | +200 |
| 40% | 2.50 | 3/2 | +150 |
| 50% | 2.00 | 1/1 | +100 |
| 60% | 1.667 | 2/3 | −150 |
| 66.67% | 1.50 | 1/2 | −200 |
| 75% | 1.333 | 1/3 | −300 |
| 80% | 1.25 | 1/4 | −400 |
These are fair mathematical equivalences.
Quoted market values can differ because of embedded margin and rounding.
Decimal to Fractional Odds
For decimal odds:
D
subtract:
1
to obtain the net ratio:
Fractional value = D − 1
For example:
D = 2.75
Then:
D − 1 = 1.75
Convert:
1.75 = 7/4
Therefore:
Decimal 2.75 = Fractional 7/4
The implied probability is:
p = 1/2.75
p ≈ 36.36%
Fractional to Decimal Odds
For fractional odds:
a/b
use:
D = 1 + a/b
For:
7/4
we obtain:
D = 1 + 7/4
D = 1 + 1.75
D = 2.75
This conversion is exact.
Positive American to Decimal Odds
For:
+A
use:
D = 1 + A/100
Example:
+250
Then:
D = 1 + 250/100
D = 3.50
Implied probability:
p = 1/3.50
p ≈ 28.57%
Negative American to Decimal Odds
For:
−A
use the magnitude:
|A|
Then:
D = 1 + 100/|A|
For:
−250
we obtain:
D = 1 + 100/250
D = 1.40
Implied probability:
p = 1/1.40
p ≈ 71.43%
Decimal to American Odds
For decimal odds:
D ≥ 2
the equivalent American odds are positive:
American = +100(D − 1)
For example:
D = 3.20
Then:
American = +100(2.20)
= +220
For:
1 < D < 2
the American odds are negative:
American = −100/(D − 1)
For:
D = 1.40
we obtain:
American = −100/0.40
= −250
Fractional to American Odds
For fractional odds:
a/b
if:
a ≥ b
the American representation is generally positive:
American = +100a/b
For:
5/2
we get:
+250
If:
a < b
the American representation is negative:
American = −100b/a
For:
2/5
we get:
−250
Both conversions preserve the same implied probability.
Probability, Odds in Favor, and Fractional Odds
Probability odds and fractional odds can look similar because both may use ratios, but their orientation should be handled carefully.
If probability is:
p
then odds in favor are:
p/(1 − p)
For:
p = 0.40
odds in favor are:
0.40/0.60
= 2/3
Yet the corresponding fair fractional odds are:
3/2
The ratio is inverted.
Why?
Because fractional odds are conventionally expressed as net return relative to the base amount, corresponding to odds against the event rather than odds in favor.
This is one of the most important conceptual distinctions in odds formats.
Example: 40% Probability Across All Formats
Suppose:
p = 0.40
Decimal
D = 1/0.40
D = 2.50
Fractional
(1 − p)/p = 0.60/0.40
= 1.5
= 3/2
American
Since:
p < 0.50
use positive American odds:
A = 100(0.60)/0.40
A = +150
Therefore:
40% = 2.50 = 3/2 = +150
These odds formats contain the same probability information.
Example: 75% Probability Across All Formats
Suppose:
p = 0.75
Decimal
D = 1/0.75
D ≈ 1.3333
Fractional
(1 − p)/p
= 0.25/0.75
= 1/3
American
Since p > 0.50:
A = −100(0.75)/0.25
A = −300
Therefore:
75% ≈ 1.333 = 1/3 = −300
Implied Probability and Margin
Suppose there are two mutually exclusive and exhaustive outcomes.
If quoted odds were perfectly fair, their implied probabilities would sum to:
100%
However, quoted odds can produce:
Sum of implied probabilities > 100%
The amount above 100% is commonly described as an:
overround
or:
margin
in this mathematical context.
For decimal odds D₁, D₂, …, Dₖ:
Raw implied probabilityᵢ = 1/Dᵢ
and:
Overround = Σ(1/Dᵢ) − 1
Two-Outcome Margin Example
Suppose two mutually exclusive outcomes have decimal odds:
Outcome A = 1.80
Outcome B = 2.10
Raw implied probability for A:
pA = 1/1.80
pA ≈ 0.5556
≈ 55.56%
For B:
pB = 1/2.10
pB ≈ 0.4762
≈ 47.62%
Add them:
55.56% + 47.62%
≈ 103.17%
Therefore:
Overround ≈ 3.17%
These raw implied probabilities cannot both be treated directly as probabilities in a mutually exclusive exhaustive model because they sum to more than 100%.
Normalizing Implied Probabilities
A simple proportional normalization divides each raw implied probability by their total.
If:
qA = 0.5556
qB = 0.4762
and:
qA + qB ≈ 1.03175
then:
pA,normalized = qA/(qA + qB)
≈ 0.53846
and:
pB,normalized = qB/(qA + qB)
≈ 0.46154
Therefore, proportional normalization gives approximately:
Outcome A = 53.85%
Outcome B = 46.15%
These sum to:
100%
This is one way to remove the total margin proportionally.
It is not the only possible margin-removal model.
Why Normalization Is an Assumption
Proportional normalization assumes the excess probability is distributed proportionally across the outcomes.
Other approaches can allocate margin differently.
Therefore, normalized probabilities should not automatically be described as the unique “true” probabilities.
The raw odds alone identify the quoted implied probabilities and total overround.
Removing that overround requires an additional assumption about how the margin is distributed.
Three-Outcome Example
Suppose decimal odds are:
A = 2.00
B = 3.00
C = 4.00
Their raw implied probabilities are:
A = 1/2 = 0.50
B = 1/3 ≈ 0.3333
C = 1/4 = 0.25
Total:
0.50 + 0.3333 + 0.25
≈ 1.0833
Therefore:
Raw total ≈ 108.33%
and:
Overround ≈ 8.33%
Again, the three raw implied probabilities are not a valid mutually exclusive probability distribution until an adjustment method is specified.
Underround
It is also possible mathematically for quoted implied probabilities to sum to less than:
100%
This can be called an underround in some contexts.
For example:
2.20 and 2.20
each imply:
1/2.20 ≈ 45.45%
Total:
≈ 90.91%
This leaves approximately:
9.09%
unallocated.
Whether such a structure is meaningful depends on the source and whether all relevant outcomes have actually been included.
Before interpreting a probability sum below 100%, verify that the listed outcomes are mutually exclusive and exhaustive.
Mutually Exclusive and Exhaustive Outcomes
Probability totals have a clear interpretation only when the set of outcomes is correctly defined.
Mutually exclusive means:
no two listed outcomes can occur simultaneously
Exhaustive means:
one of the listed outcomes must occur
If both conditions hold:
ΣP(outcomeᵢ) = 1
If the events overlap or if an outcome has been omitted, a sum different from 100% can arise for reasons unrelated to margin.
The event structure should therefore be checked before interpreting an implied-probability total.
Odds Formats and Statistical Probability Models
Odds formats do not determine where a probability comes from.
A probability might be generated by:
- a statistical model,
- historical frequencies,
- expert judgment,
- a physical model,
- a probability distribution.
For example, a normal distribution might give:
P(X > c) = 0.20
That probability could then be expressed as:
Decimal = 5.00
Fractional = 4/1
American = +400
The odds conversion does not make the normal calculation more or less accurate.
It merely changes the numerical representation.
Odds From a Negative Binomial Probability
The same principle applies to discrete models.
Suppose a negative binomial calculation produces an event probability:
p = 0.25
The equivalent fair odds formats are:
Decimal = 4.00
Fractional = 3/1
American = +300
The negative binomial model determines the probability.
The odds formats express it.
This distinction prevents confusion between probability modeling and probability notation.
Odds Formats and P-Values
A p-value is not an odds quote and should not be converted into payout-style odds and then interpreted as the probability that a hypothesis is true.
For example:
p-value = 0.03
does not mean:
P(H₀ is true) = 3%
and therefore does not imply:
32.33-to-1 odds against H₀
in the usual frequentist interpretation.
A p-value measures how extreme the observed statistic is under H₀ and the specified reference model.
Probability-to-odds conversion is mathematically valid only when the quantity being converted genuinely is the probability of the event of interest.
Implied Probability Is Not Certainty
Suppose decimal odds imply:
p = 0.80
This means the numerical representation corresponds to an 80% probability.
It does not mean the event will occur.
A 20% failure probability remains.
Similarly, an event with:
p = 0.10
can still occur.
Probability describes uncertainty across possible outcomes or repeated comparable situations.
It does not determine an individual future outcome with certainty.
Expected Frequency Interpretation
Suppose an event genuinely has stable probability:
p = 0.40
Across many independent comparable trials, its long-run relative frequency would be expected to approach approximately:
40%
under the assumed probability model.
The corresponding fair decimal odds are:
2.50
This interpretation links odds formats back to ordinary probability.
However, small samples can differ substantially from the theoretical proportion because of random variation.
Odds and Expected Value Are Different
Odds formats describe the probability-return relationship.
Expected value requires both:
- probabilities,
- numerical outcomes.
Suppose an event has probability p and a random payoff structure.
The expected value is generally:
E(X) = ΣxᵢP(X = x)
A high implied probability does not by itself determine whether an associated decision has positive or negative expected value.
Likewise, a low-probability event can have a large possible numerical outcome.
Odds and expected values answer related but distinct questions.
Odds and Measures of Central Tendency
The mean, median, mode are descriptive summaries of data distributions.
They should not be confused with odds formats.
For example, if several probability estimates are collected from different models, their arithmetic mean might summarize the estimates:
p̄ = Σpᵢ/n
but averaging the corresponding American odds directly generally does not produce the American odds associated with the average probability.
Odds transformations are nonlinear.
Conversions should therefore usually be made to a common probability scale before aggregation.
Why Averaging Odds Can Be Misleading
Suppose two fair decimal odds are:
2.00
and:
4.00
Their implied probabilities are:
50%
and:
25%
The arithmetic mean probability is:
(0.50 + 0.25)/2
= 0.375
The decimal odds corresponding to 37.5% are:
1/0.375
≈ 2.667
But the arithmetic mean of the decimal odds is:
(2.00 + 4.00)/2
= 3.00
which corresponds to:
33.33%
These are not the same.
Because the reciprocal transformation is nonlinear, averaging odds and averaging probabilities answer different questions.
Outliers in Collections of Odds or Probabilities
When comparing a collection of numerical probability estimates or converted odds, unusually extreme values can strongly influence arithmetic summaries.
For example, one exceptionally large decimal value can pull a mean of decimal odds upward.
The principles used for examining statistical outliers may help identify values that deserve investigation.
However, a numerically extreme odds quote is not automatically erroneous.
It may correspond to a legitimately low-probability event.
Context and the underlying probability model matter.
Log-Odds
Another important probability representation is the log-odds, or logit.
If:
p
is a probability, odds in favor are:
p/(1 − p)
The log-odds are:
logit(p) = ln[p/(1 − p)]
Unlike probability, which is bounded between 0 and 1, log-odds range across:
−∞ to +∞
If:
p = 0.50
then:
logit(0.50) = ln(1)
= 0
If:
p > 0.50
log-odds are positive.
If:
p < 0.50
log-odds are negative.
Log-odds are especially important in logistic regression.
Probability From Log-Odds
If log-odds equal:
L
then:
odds = eᴸ
Probability is:
p = eᴸ/(1 + eᴸ)
Equivalently:
p = 1/(1 + e⁻ᴸ)
For example, if:
L = 0
then:
p = 1/(1 + 1)
= 0.50
Log-odds are another mathematical odds format, though they serve a different analytical purpose from decimal, fractional, and American display conventions.
Odds Ratio
An odds ratio compares the odds associated with two groups or conditions.
Suppose:
Odds₁ = p₁/(1 − p₁)
and:
Odds₂ = p₂/(1 − p₂)
Then:
OR = Odds₁/Odds₂
An odds ratio of:
1
means the odds are equal.
An odds ratio above 1 means Group 1 has higher odds.
An odds ratio below 1 means Group 1 has lower odds.
The odds ratio should not be confused with a ratio of probabilities.
Odds Ratio vs Risk Ratio
Suppose:
p₁ = 0.60
and:
p₂ = 0.30
The risk ratio is:
RR = 0.60/0.30
RR = 2
Group 1 has twice the probability.
The odds are:
Odds₁ = 0.60/0.40 = 1.5
Odds₂ = 0.30/0.70 ≈ 0.4286
Therefore:
OR = 1.5/0.4286
≈ 3.5
The odds ratio is:
3.5
not:
2
Odds ratios and probability ratios become increasingly different as event probabilities move away from zero.
Why Odds and Probability Are Close for Rare Events
If:
p
is very small, then:
1 − p ≈ 1
so odds in favor:
p/(1 − p)
are approximately:
p
For example:
p = 0.01
Odds in favor:
0.01/0.99
≈ 0.01010
The numerical difference is small.
At larger probabilities, the difference becomes substantial.
For:
p = 0.50
odds are:
1
while probability is:
0.50
Thus, odds and probability should never be used interchangeably simply because they are close in rare-event settings.
Rounding Odds Formats
Conversions often produce repeating decimals.
For example:
p = 0.60
gives decimal odds:
1/0.60
= 1.666666…
This may be displayed as:
1.67
If that rounded value is converted back:
1/1.67 ≈ 0.5988
or:
59.88%
rather than exactly:
60%
The difference comes from rounding.
For accurate calculations, retain additional precision during intermediate steps and round only for final presentation.
Common Odds Formats Mistakes
One common mistake is using:
p = D
instead of:
p = 1/D
for decimal odds.
Another is forgetting that fractional odds represent a net ratio, so:
3/2
corresponds to decimal:
2.50
not:
1.50
A third error is applying the positive American formula to negative American odds or vice versa.
Another frequent mistake is confusing odds in favor with fractional payout-style odds; for a 40% event, odds in favor are 2:3 while fair fractional odds are 3/2.
Analysts can also treat raw implied probabilities from a multi-outcome market as if they must sum exactly to 100%, ignoring margin.
Another error is assuming proportional normalization reveals unique true probabilities. It is only one adjustment method.
It is also incorrect to convert a frequentist p-value into odds that a null hypothesis is true.
Finally, averaging odds directly can be misleading because conversions between probability and odds are nonlinear.
How to Convert Odds Formats Step by Step
A reliable approach is to convert the starting format into probability first, then convert the probability into the desired target format.
Step 1: Convert to Probability
Decimal:
p = 1/D
Fractional a/b:
p = b/(a + b)
Positive American +A:
p = 100/(A + 100)
Negative American −A:
p = |A|/(|A| + 100)
Step 2: Check the Result
A valid probability should satisfy:
0 < p < 1
for ordinary non-certain finite odds.
Step 3: Convert Probability to the Target Format
Decimal:
D = 1/p
Fractional fair ratio:
(1 − p)/p
Positive American for p ≤ 0.50:
+100(1 − p)/p
Negative American for p > 0.50:
−100p/(1 − p)
Step 4: Round at the End
Keep extra precision during intermediate calculations.
Full Conversion Example
Convert:
American odds = −175
into implied probability, decimal odds, and fractional odds.
Implied Probability
Use:
p = 175/(175 + 100)
p = 175/275
p ≈ 0.63636
Therefore:
Implied probability ≈ 63.64%
Decimal Odds
D = 1 + 100/175
D ≈ 1.57143
Fractional Odds
The net ratio is:
100/175
Simplify:
4/7
Therefore:
−175 ≈ 63.64% = 1.5714 = 4/7
All formats describe the same mathematical implied probability.
Full Positive American Example
Convert:
+225
to other odds formats.
Implied probability:
p = 100/(225 + 100)
p = 100/325
p ≈ 0.30769
Therefore:
Implied probability ≈ 30.77%
Decimal:
D = 1 + 225/100
D = 3.25
Fractional:
225/100
Simplify:
9/4
Therefore:
+225 = 3.25 = 9/4 ≈ 30.77%
Full Fractional Example
Convert:
7/5
to decimal, American, and implied probability.
Decimal:
D = 1 + 7/5
D = 2.40
Implied probability:
p = 5/(7 + 5)
p = 5/12
p ≈ 0.41667
Therefore:
Implied probability ≈ 41.67%
Since the fair probability is below 50%, American odds are positive:
A = 100(1 − 0.41667)/0.41667
≈ +140
Thus:
7/5 = 2.40 = +140 ≈ 41.67%
Full Decimal Example
Convert:
D = 1.80
to implied probability and American odds.
Probability:
p = 1/1.80
p ≈ 0.55556
Therefore:
Implied probability ≈ 55.56%
Because:
p > 0.50
American odds are negative:
A = −100p/(1 − p)
= −100(0.55556)/0.44444
≈ −125
Fractional equivalent:
D − 1 = 0.80
= 4/5
Therefore:
1.80 = 4/5 = −125 ≈ 55.56%
How to Interpret Odds Formats Correctly
Odds formats are best viewed as transformations of probability.
A decimal value, fraction, or signed American number does not create a new kind of uncertainty.
Each is a mathematical representation of the same underlying ratio.
The safest workflow is therefore:
Understand the event
Determine or extract the probability
Convert the probability consistently
Check whether margin or rounding is present
Interpret the probability rather than relying only on the appearance of the odds number
This approach prevents most conversion errors.
Frequently Asked Questions About Odds Formats
What are the main odds formats?
The most common odds formats are decimal odds, fractional odds, and American odds. Probability, odds in favor, odds against, and log-odds are additional mathematical representations.
What is implied probability?
Implied probability is the probability mathematically encoded by a set of odds before any adjustment for margin or other pricing effects.
How do you convert decimal odds to probability?
Use:
p = 1/D
What do decimal odds of 2.00 imply?
p = 1/2
= 50%
What do decimal odds of 4.00 imply?
p = 1/4
= 25%
How do you convert fractional odds to probability?
For:
a/b
use:
p = b/(a + b)
What probability does 3/2 imply?
p = 2/(3 + 2)
= 40%
How do you convert positive American odds to probability?
For:
+A
use:
p = 100/(A + 100)
What probability does +150 imply?
100/(150 + 100)
= 40%
How do you convert negative American odds to probability?
For:
−A
use:
p = |A|/(|A| + 100)
What probability does −200 imply?
200/(200 + 100)
≈ 66.67%
What odds formats represent a 50% probability?
Fair equivalents are:
Decimal = 2.00
Fractional = 1/1
American = +100
Odds in favor = 1:1
What odds formats represent 40%?
Fair equivalents are:
Decimal = 2.50
Fractional = 3/2
American = +150
What odds formats represent 75%?
Fair equivalents are approximately:
Decimal = 1.333
Fractional = 1/3
American = −300
Are fractional odds the same as odds in favor?
Not generally. Fair fractional odds conventionally correspond to the unfavorable-to-favorable ratio, while odds in favor use favorable-to-unfavorable probability odds.
What is overround?
For mutually exclusive exhaustive outcomes, overround is the amount by which the sum of raw implied probabilities exceeds 100%:
Overround = Σ implied probabilities − 1
Why can implied probabilities add to more than 100%?
Quoted odds can contain an embedded margin. The individual reciprocal probabilities therefore need not form a fair probability distribution directly.
How can implied probabilities be normalized?
A simple proportional method is:
pᵢ,normalized = qᵢ/Σqᵢ
where qᵢ are the raw implied probabilities.
Does normalization reveal the true probability?
Not necessarily. Proportional normalization is one assumption for allocating the excess implied probability.
What are odds in favor?
For probability p:
Odds in favor = p/(1 − p)
What are odds against?
Odds against = (1 − p)/p
How do you convert odds in favor to probability?
If odds in favor are a:b:
p = a/(a + b)
What are log-odds?
Log-odds are:
ln[p/(1 − p)]
They range from negative infinity to positive infinity and are widely used in logistic modeling.
Are odds the same as probability?
No. Probability is favorable outcomes relative to all outcomes, while odds compare favorable with unfavorable outcomes.
Can a p-value be converted to odds that a hypothesis is true?
Not under the usual frequentist interpretation. A p-value is not the probability that the null hypothesis is true.
Can different probability models be expressed using odds formats?
Yes. A probability obtained from a normal, negative binomial, or another valid probability model can be transformed into any equivalent odds representation.
Should decimal odds be averaged directly?
Not if the goal is to average underlying probabilities. Probability-to-odds transformations are nonlinear, so average odds and odds based on average probability are generally different.
Why do converted odds sometimes not match exactly?
Rounding can create small differences. Retain full precision during calculation and round only the final displayed values.
What is the easiest odds format for probability conversion?
Decimal odds are especially direct because:
p = 1/D
and:
D = 1/p
Why are odds formats useful?
They provide alternative numerical representations of event likelihood, allowing the same probability to be communicated as a decimal, fraction, signed American value, probability ratio, or other mathematical odds measure.




