Statistics & Probability
-

Kurtosis: Definition, Formula & Example
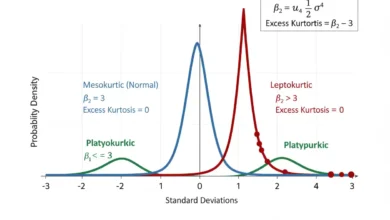
Kurtosis is a dimensionless statistical measure based on the fourth standardized moment of a distribution, describing how strongly probability or…
Read More » -
Histogram: Definition, Formula & Example
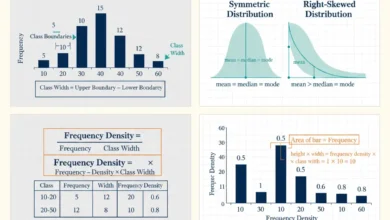
A histogram is a statistical graph that displays the distribution of numerical data by dividing the measurement scale into intervals,…
Read More » -
Harmonic Mean: Definition, Formula & Example
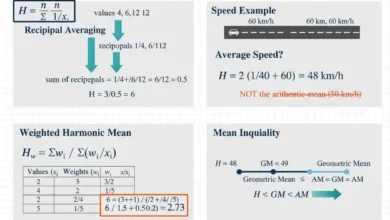
The harmonic mean is a measure of central tendency calculated by dividing the number of observations by the sum of…
Read More » -
Geometric Mean: Definition, Formula & Example
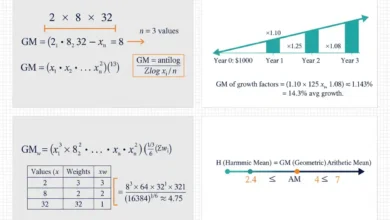
The geometric mean is a measure of central tendency calculated by multiplying positive values together and taking the nth root…
Read More » -
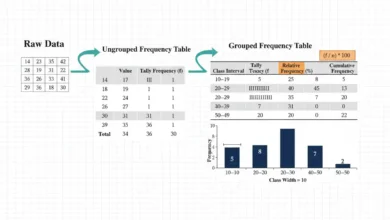
Frequency Distribution: Definition, Formula & Example
A frequency distribution is an organized summary showing how often values, categories, or numerical intervals occur within a data set,…
Read More » -
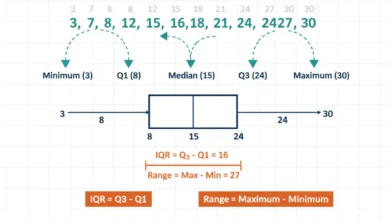
Five-Number Summary: Definition, Formula & Example
A five-number summary is a compact description of a numerical distribution using its minimum, first quartile Q₁, median Q₂, third…
Read More » -
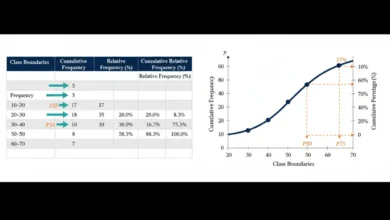
Cumulative Frequency: Definition, Formula & Example
Cumulative frequency is the running total of frequencies in an ordered data set, showing how many observations fall at or…
Read More » -
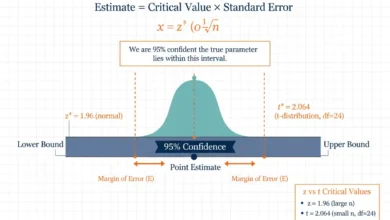
Confidence Interval: Definition, Formula & Example
A confidence interval is a range of plausible values for an unknown population parameter constructed from sample data using a…
Read More » -
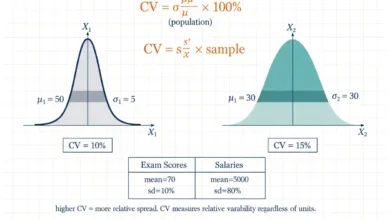
Coefficient Of Variation: Definition, Formula & Example
The coefficient of variation is a dimensionless measure of relative variability that compares a standard deviation with the corresponding arithmetic…
Read More » -
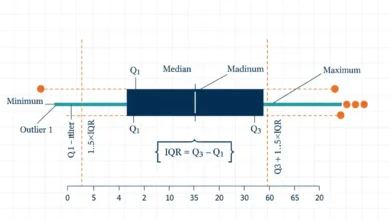
Box Plot: Definition, Formula & Example
A box plot is a compact statistical graph used to summarize the center, spread, and overall distribution of numerical data…
Read More »