


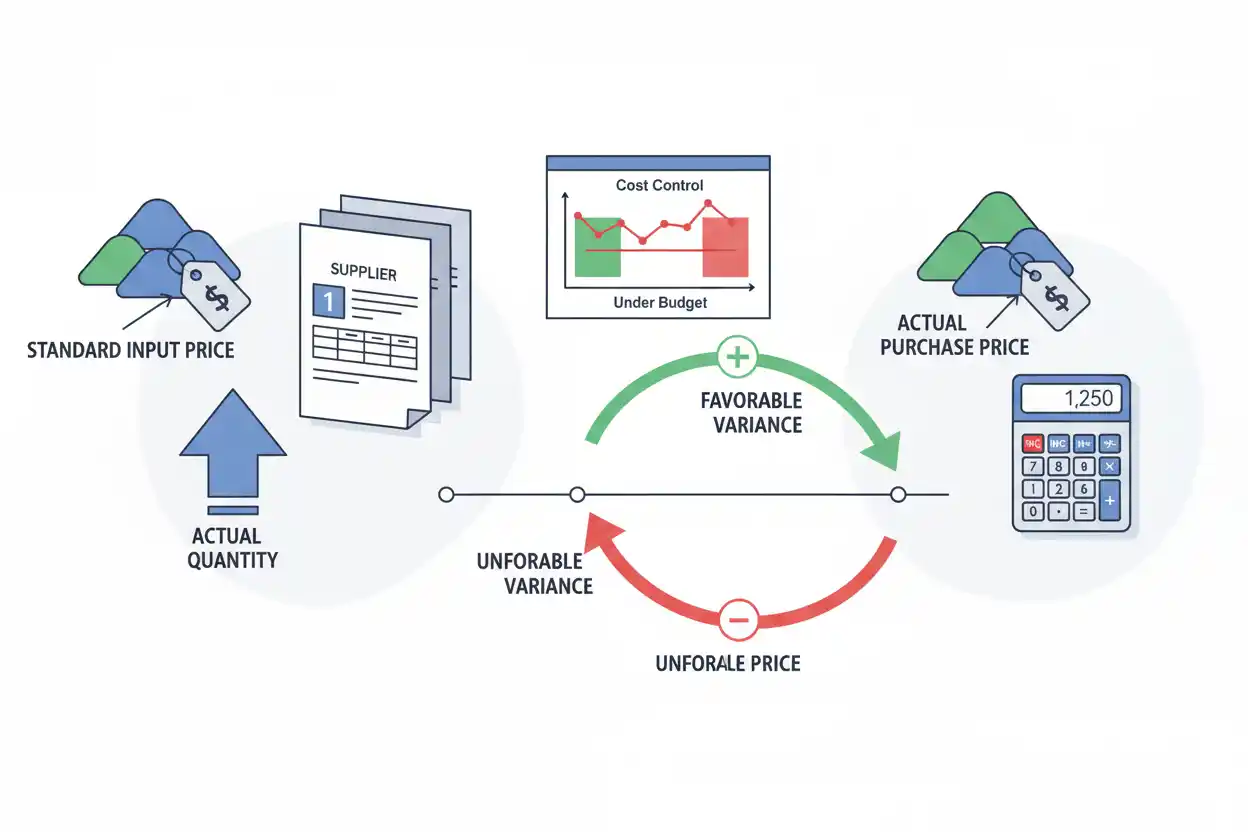
Price variance measures the financial effect of paying or receiving a different price from a standard, budgeted, or expected price for the actual quantity involved.
In purchasing and cost analysis, the most common form compares the actual unit price paid for an input with its standard price.
If a business expected material to cost $10 per unit but actually paid $11 for 5,000 units, the unfavorable price variance is $5,000.
Price Variance = (Actual Price − Standard Price) × Actual Quantity
Price Variance = ($11 − $10) × 5,000 = $5,000 Unfavorable
Price variance isolates the effect of the price difference. It should not automatically be interpreted as the total cost variance because quantity, usage, volume, mix, and other factors can create additional cost differences.
What Is Price Variance?
Price variance answers:
How much did the difference between actual and expected unit price change total cost for the quantity actually purchased or used?
Suppose a company purchases 20,000 units of a component.
The standard price is $8 per unit.
Actual price is $7.50.
The company paid $0.50 less than expected for each of the 20,000 units.
Unit Price Difference = $7.50 − $8.00 = −$0.50
Total price variance:
−$0.50 × 20,000 = −$10,000
Under the actual-minus-standard convention used here, the result represents a $10,000 favorable price variance.
The company spent $10,000 less than the standard price would have implied for the actual quantity purchased.
Price Variance Formula
A common purchasing formula is:
Price Variance = (Actual Price − Standard Price) × Actual Quantity
Where:
Actual Price (AP) is the actual amount paid per unit.
Standard Price (SP) is the expected, budgeted, or predetermined price per unit.
Actual Quantity (AQ) is the actual number of units purchased or used, depending on the variance framework.
The compact formula is:
Price Variance = (AP − SP) × AQ
Under this sign convention:
Positive variance = actual price exceeded standard price = unfavorable.
Negative variance = actual price was below standard price = favorable.
Some organizations reverse the subtraction:
(Standard Price − Actual Price) × Actual Quantity
That convention reverses the signs.
The reporting method should therefore always identify whether the result is favorable or unfavorable rather than relying on a plus or minus sign alone.
Price Variance Example
Suppose a manufacturer establishes a standard material price of $12 per kilogram.
During the month, it purchases 8,000 kilograms at $13.25 per kilogram.
Price difference:
Actual Price − Standard Price = $13.25 − $12.00 = $1.25
Multiply by actual quantity:
Price Variance = $1.25 × 8,000
Price Variance = $10,000 Unfavorable
The company paid $10,000 more than the standard price would have required for the same 8,000 kilograms.
Verify the result directly:
Expected cost at standard price:
8,000 × $12 = $96,000
Actual cost:
8,000 × $13.25 = $106,000
Difference:
$106,000 − $96,000 = $10,000
The calculations reconcile.
Favorable Price Variance Example
Suppose standard price is $20 per unit, actual price is $18.50, and actual quantity is 6,000 units.
Price Variance = ($18.50 − $20.00) × 6,000
Price Variance = −$1.50 × 6,000
Price Variance = −$9,000
The business has a $9,000 favorable price variance.
Expected cost for actual quantity:
6,000 × $20 = $120,000
Actual cost:
6,000 × $18.50 = $111,000
Saving:
$120,000 − $111,000 = $9,000
The company paid $9,000 less than the standard amount for the quantity purchased.
Price Variance Per Unit
The starting point is often the unit difference:
Unit Price Variance = Actual Price − Standard Price
Suppose:
Standard Price = $15
Actual Price = $16.20
Then:
Unit Price Variance = $16.20 − $15 = $1.20 Unfavorable per Unit
For 25,000 units:
Total Price Variance = $1.20 × 25,000 = $30,000 Unfavorable
A relatively small unit difference can therefore become financially material when purchase volume is large.
Price Variance Percentage
Price differences can also be expressed as a percentage of the standard price:
Price Variance % = (Actual Price − Standard Price) ÷ Standard Price × 100
Suppose actual price is $22 and standard price is $20.
Price Variance % = ($22 − $20) ÷ $20 × 100
Price Variance % = 10%
The actual unit price was 10% above standard.
If 50,000 units were purchased, the total dollar impact is:
($22 − $20) × 50,000 = $100,000 Unfavorable
The percentage describes the price deviation; the dollar variance shows its total financial impact at the actual quantity.
Price Variance vs. Total Cost Variance
Price variance isolates only one source of a cost difference.
Suppose a business budgeted:
10,000 Units × $5 = $50,000
Actual results are:
12,000 Units × $5.50 = $66,000
Total difference from the original budget is:
$66,000 − $50,000 = $16,000 Unfavorable
But the entire $16,000 did not arise from price.
Using actual quantity for the price effect:
Price Variance = ($5.50 − $5.00) × 12,000
Price Variance = $6,000 Unfavorable
The remaining difference is associated with the fact that more units were purchased than originally expected.
This is why price variance should not absorb the full intent of broader cost-variance analysis.
Why Actual Quantity Is Used
The price variance should isolate the price effect from the quantity effect.
Suppose actual quantity is 8,000 units.
The question is:
What would those same 8,000 units have cost at the standard price versus the actual price?
If standard price is $10:
Standard Cost for Actual Quantity = 8,000 × $10 = $80,000
If actual price is $11:
Actual Cost for Actual Quantity = 8,000 × $11 = $88,000
Difference:
$88,000 − $80,000 = $8,000
Using the same actual quantity on both sides isolates the price difference.
Price Variance Example With Multiple Suppliers
Suppose a business buys the same input from two suppliers.
Standard price is $10 per unit.
Supplier A:
4,000 Units × $9.50
Supplier B:
6,000 Units × $10.80
Supplier A variance:
($9.50 − $10.00) × 4,000 = −$2,000 Favorable
Supplier B variance:
($10.80 − $10.00) × 6,000 = $4,800 Unfavorable
Combined price variance:
−$2,000 + $4,800 = $2,800 Unfavorable
Overall, the business paid $2,800 more than standard despite obtaining a favorable price from Supplier A.
Analyzing supplier-level differences can reveal where the total variance originated.
Weighted Average Actual Price
When purchases occur at several prices, a weighted average can provide a useful overall actual price.
Using the example above:
Supplier A actual cost:
4,000 × $9.50 = $38,000
Supplier B actual cost:
6,000 × $10.80 = $64,800
Total cost:
$38,000 + $64,800 = $102,800
Total quantity:
4,000 + 6,000 = 10,000 Units
Weighted average actual price:
$102,800 ÷ 10,000 = $10.28 per Unit
Overall price variance:
($10.28 − $10.00) × 10,000 = $2,800 Unfavorable
The result matches the supplier-by-supplier calculation.
What Causes an Unfavorable Price Variance?
Actual prices can exceed standards for many reasons.
Possible causes include:
Supplier price increases. Vendors may raise prices because of inflation, shortages, energy costs, or changing market conditions.
Emergency purchases. Unexpected stock shortages can force the business to buy from higher-priced suppliers.
Lower order volumes. Smaller orders may lose volume discounts.
Freight and purchasing terms. Changes in delivered-price economics can affect actual unit cost.
Product specifications. Management may intentionally purchase higher-grade materials.
Weak negotiation. Procurement terms may deteriorate.
Outdated standards. The benchmark itself may no longer reflect realistic market prices.
An unfavorable variance therefore does not automatically indicate poor purchasing performance.
What Causes a Favorable Price Variance?
Actual prices can fall below standard because of:
- successful supplier negotiations;
- greater purchase volumes;
- market-price declines;
- favorable exchange-rate movements where relevant;
- lower freight costs;
- alternative sourcing;
- promotional supplier pricing; or
- outdated standards set too high.
Again, favorable does not automatically mean economically superior.
The company might achieve a lower purchase price by accepting lower-quality materials or unusually restrictive supplier terms.
Favorable Price Variance Can Create Quality Problems
Suppose standard material cost is $10 per unit.
Procurement finds an alternative at $8.
For 50,000 units:
Price Variance = ($8 − $10) × 50,000
Price Variance = −$100,000 Favorable
The $100,000 saving looks attractive.
But suppose the cheaper material increases defects and rework by $140,000.
Net economic effect:
$100,000 Saving − $140,000 Additional Costs = −$40,000
The apparently favorable purchasing variance ultimately costs the company $40,000.
Price variance should therefore be interpreted with quality and operational performance.
Unfavorable Price Variance Can Be Rational
Suppose management deliberately chooses a component costing $2 more per unit because it reduces warranty claims.
For 20,000 units:
Price Variance = $2 × 20,000 = $40,000 Unfavorable
If warranty and service costs decline by $90,000:
Net Economic Improvement = $90,000 − $40,000 = $50,000
The unfavorable purchase-price variance accompanied a better business outcome.
Variance labels describe deviation from a benchmark, not the complete economic value of the decision.
Price Variance and Payables Turnover
Supplier price negotiations can affect payables turnover when pricing and payment terms are negotiated together.
Suppose Supplier A charges $9.50 per unit but requires payment within 10 days.
Supplier B charges $10 per unit and allows 60 days.
Supplier A may create a favorable purchase price but require faster cash payment, potentially increasing payables turnover.
Supplier B may create a less favorable unit price but provide more supplier financing.
The best commercial choice depends on both purchasing economics and working-capital needs.
Price variance isolates the price effect; payables turnover helps evaluate payment behavior.
Price Variance and Reorder Point
The reorder point determines when inventory replenishment should be triggered.
Poor replenishment planning can indirectly create unfavorable price variance.
Suppose inventory falls unexpectedly close to zero because an order was triggered too late.
The business may need an emergency shipment from a supplier charging $14 per unit instead of the $10 standard price.
For 5,000 emergency units:
Price Variance = ($14 − $10) × 5,000
Price Variance = $20,000 Unfavorable
The unfavorable price variance originates partly from an inventory-timing problem rather than simply supplier negotiation.
Operational and purchasing analysis can therefore reveal connected causes while the two metrics retain distinct purposes.
Price Variance and Operating Income
An unfavorable price variance can reduce operating income when the additional input cost is recognized in the period and no offsetting changes occur.
Suppose a company incurs a $30,000 unfavorable price variance on materials associated with goods sold during the period.
If revenue and other costs remain unchanged, operating profit can decline by approximately $30,000 before considering accounting classification and other effects.
However, materials purchased but not yet sold may remain in inventory.
In that case, some of the cost effect can reach the income statement in a later period.
Price variance is therefore a management-analysis measure; the timing of its financial-statement impact depends on the underlying transactions.
Price Variance and Owner Equity
A price variance does not directly change owner equity merely because the variance was calculated.
The underlying higher or lower purchase cost can affect profit.
Suppose unfavorable supplier prices ultimately reduce net income by $25,000.
If all else remains unchanged and the profit would otherwise have been retained:
Reduction in Retained Profit = $25,000
That lower retained profit can reduce the growth of owner equity.
The effect therefore flows through accounting earnings rather than through a direct “price variance to equity” entry.
Price Variance and Retained Earnings
Retained earnings accumulate profits that remain in a corporation after applicable distributions.
Suppose an unfavorable price variance ultimately reduces net income from $200,000 to $170,000.
The earnings available to increase retained earnings are $30,000 lower, assuming all other factors remain unchanged.
This relationship can be summarized conceptually as:
Higher Input Prices → Higher Recognized Costs → Lower Net Income → Lower Addition to Retained Earnings
The exact timing depends on whether the purchased inputs are expensed immediately or remain in inventory before reaching cost of goods sold.
Price Variance and Inventory
Suppose a company purchases 10,000 units at an actual price of $12 instead of the $10 standard price.
Actual purchase cost:
10,000 × $12 = $120,000
Standard amount:
10,000 × $10 = $100,000
Price variance:
$20,000 Unfavorable
If those units remain unsold at period end, the higher actual cost may remain associated with inventory under the relevant accounting treatment rather than immediately reducing current operating income in full.
When the goods are later sold, their applicable recorded cost can affect cost of goods sold.
This timing distinction is important when connecting managerial price variance with financial reporting.
Price Variance and Purchase Volume
A small unfavorable unit price can become significant at high volume.
Suppose actual price exceeds standard by only $0.10.
At 10,000 units:
Price Variance = $0.10 × 10,000 = $1,000 Unfavorable
At 1,000,000 units:
Price Variance = $0.10 × 1,000,000 = $100,000 Unfavorable
The unit difference is identical, but total financial exposure is 100 times larger.
Procurement teams should therefore consider both the unit variance and the quantity to which it applies.
Price Variance and Quantity Discounts
Suppose a supplier’s standard price is $20 per unit.
The company normally buys 1,000 units per order.
A larger order qualifies for a price of $18.
For an actual purchase of 5,000 units:
Price Variance = ($18 − $20) × 5,000
Price Variance = −$10,000 Favorable
The purchasing team creates a $10,000 favorable price variance.
However, buying a larger quantity can increase inventory carrying costs and tie up more cash.
The purchase should therefore be evaluated on total economics rather than the favorable price variance alone.
Price Variance and Supplier Minimum Orders
A supplier may offer a favorable price only when the business accepts a large minimum order quantity.
Suppose:
Standard Price = $12
Discounted Price = $10.50
Minimum Quantity = 20,000 Units
Price variance:
($10.50 − $12.00) × 20,000 = −$30,000 Favorable
The business saves $30,000 versus standard.
But if it needs only 8,000 units in the near term, the additional inventory can create storage, obsolescence, financing, and liquidity costs.
A favorable price variance should not override sound inventory management.
Price Variance and Currency Changes
Businesses purchasing internationally can experience price differences because exchange rates change between budgeting and purchasing.
Suppose a component’s foreign-currency supplier price remains unchanged, but the domestic-currency equivalent rises from $50 to $54.
For 10,000 units:
Price Difference = $54 − $50 = $4
Price Variance = $4 × 10,000 = $40,000 Unfavorable
The procurement team may not have caused the underlying currency movement.
Good variance analysis distinguishes controllable purchasing performance from external market effects.
Price Variance and Inflation
Standards can quickly become outdated during periods of rapid input-cost inflation.
Suppose a company continues using a $100 standard price while the market price has stabilized around $120.
Actual purchase at $119 generates:
($119 − $100) × Quantity
an unfavorable variance against the old standard.
Yet procurement may actually be outperforming the current market by paying $1 below the prevailing $120 price.
A variance against an unrealistic benchmark can create the wrong performance signal.
Standards therefore need periodic review.
Price Variance From a Changed Product Mix
Suppose purchasing reports an unfavorable average price because the company bought more premium-grade inputs than expected.
The result may not indicate the same item became more expensive.
Instead, the mix of products purchased changed.
For meaningful variance analysis, actual and standard prices should be compared for sufficiently comparable inputs.
Mix effects should not be misclassified as pure price changes.
Standard Price Selection
A standard price can be based on:
- supplier contracts;
- current market quotations;
- negotiated purchasing targets;
- prior-period prices;
- budget assumptions; or
- expected landed cost.
The quality of the variance depends on the quality of that benchmark.
If the standard is unrealistic, every subsequent variance can be mathematically correct but economically misleading.
Standards should therefore represent a credible expectation for the quantity, quality, timing, and purchasing conditions involved.
Price Variance Trend Example
Suppose a company reports:
| Month | Standard Price | Actual Price | Actual Quantity | Price Variance |
|---|---|---|---|---|
| January | $10.00 | $10.10 | 20,000 | $2,000 U |
| February | $10.00 | $10.25 | 20,000 | $5,000 U |
| March | $10.00 | $10.50 | 20,000 | $10,000 U |
| April | $10.00 | $10.80 | 20,000 | $16,000 U |
The unfavorable variance is widening each month.
The pattern suggests a structural issue rather than a one-time purchasing difference.
Possible causes include market inflation, expiring supplier contracts, loss of discounts, changes in freight, or an outdated standard.
Trend analysis provides information that one isolated variance cannot.
Comparing Two Purchasing Teams
Suppose both teams buy 100,000 units with a $10 standard price.
Team A pays $9.80:
Price Variance = ($9.80 − $10) × 100,000 = −$20,000 Favorable
Team B pays $10.10:
Price Variance = ($10.10 − $10) × 100,000 = $10,000 Unfavorable
On price alone, Team A appears better by $30,000.
But if Team A’s supplier has significantly lower quality or requires much earlier payment, a complete commercial comparison may produce a different conclusion.
Price variance is valuable precisely because it isolates price. It should not be asked to measure everything else.
How to Investigate an Unfavorable Price Variance
A useful investigation begins by confirming the data.
Verify actual quantity, actual unit price, standard price, unit of measure, freight treatment, discounts, credits, currency conversion, and timing.
Then identify whether the difference resulted from:
Market conditions: Did supplier market prices change?
Purchasing decisions: Was a more expensive supplier selected?
Order size: Were volume discounts lost?
Urgency: Did emergency procurement increase cost?
Quality: Was a higher specification intentionally purchased?
Terms: Was the higher price exchanged for better payment or service terms?
Benchmark quality: Is the standard itself outdated?
The goal is to identify the economic cause rather than merely assign a favorable or unfavorable label.
Common Price Variance Mistakes
One common mistake is multiplying the price difference by the budgeted quantity instead of the actual quantity when attempting to isolate the actual purchasing price effect.
Another is reversing the sign convention without labeling favorable and unfavorable results.
Businesses can also treat total cost variance as though all of it came from price.
Another mistake is celebrating favorable price variance while ignoring quality deterioration, excess inventory, or unfavorable payment terms.
Outdated standards can make good purchasing performance look bad.
Using incomparable units is another serious error—for example, comparing a price per case with a standard price per individual item.
Finally, price variance should not be evaluated in isolation when purchasing decisions materially affect supplier terms, availability, quality, or inventory.
Frequently Asked Questions
What is price variance in simple terms?
Price variance measures the financial effect of the difference between the actual unit price and the expected or standard unit price for the actual quantity involved.
What is the price variance formula?
A common formula is:
Price Variance = (Actual Price − Standard Price) × Actual Quantity
What does a positive price variance mean?
Under the actual-minus-standard convention used here, a positive result means actual price exceeded standard price and is generally labeled unfavorable.
What does a negative price variance mean?
Under this convention, a negative result means actual price was lower than standard price and is generally favorable.
How do you calculate price variance per unit?
Use:
Unit Price Variance = Actual Price − Standard Price
If actual price is $12.50 and standard price is $12:
Unit Variance = $0.50 Unfavorable
How do you calculate price variance percentage?
Use:
Price Variance % = (Actual Price − Standard Price) ÷ Standard Price × 100
If actual price is $11 and standard price is $10, the price is 10% above standard.
Why is actual quantity used in the formula?
Using the actual quantity isolates the financial effect of the price difference for the quantity that was actually purchased or used.
Is price variance the same as cost variance?
No.
Price variance isolates the unit-price effect. Total cost variance can also reflect changes in quantity, usage, volume, mix, efficiency, and other factors.
Is a favorable price variance always good?
No.
A lower price can come with lower quality, excessive order quantities, unfavorable payment terms, greater defects, or other hidden costs.
Is an unfavorable price variance always bad?
No.
A business may deliberately pay more for higher quality, faster delivery, better reliability, longer supplier terms, or other benefits that create greater economic value.
Can payment terms affect price variance?
Yes.
Suppliers can offer different prices depending on how quickly the customer pays or how much trade credit is provided. Price and payment terms should therefore be evaluated together.
Can a poor reorder decision create unfavorable price variance?
Yes.
If replenishment is triggered too late, emergency purchasing can force the company to pay higher prices or expedite freight.
Does price variance immediately reduce owner equity?
Not directly.
The underlying higher cost can reduce profit, which may then reduce the amount of earnings retained in equity.
Can an outdated standard create misleading price variance?
Yes.
If market prices have permanently changed, comparing actual purchases with an obsolete standard can produce persistent variances that do not fairly measure purchasing performance.
Why track price variance over time?
A trend can reveal supplier inflation, weakening purchasing terms, outdated standards, successful negotiations, or structural changes that may not be obvious from a single month’s result.




