

Contribution Margin Ratio: Formula, Meaning & Example

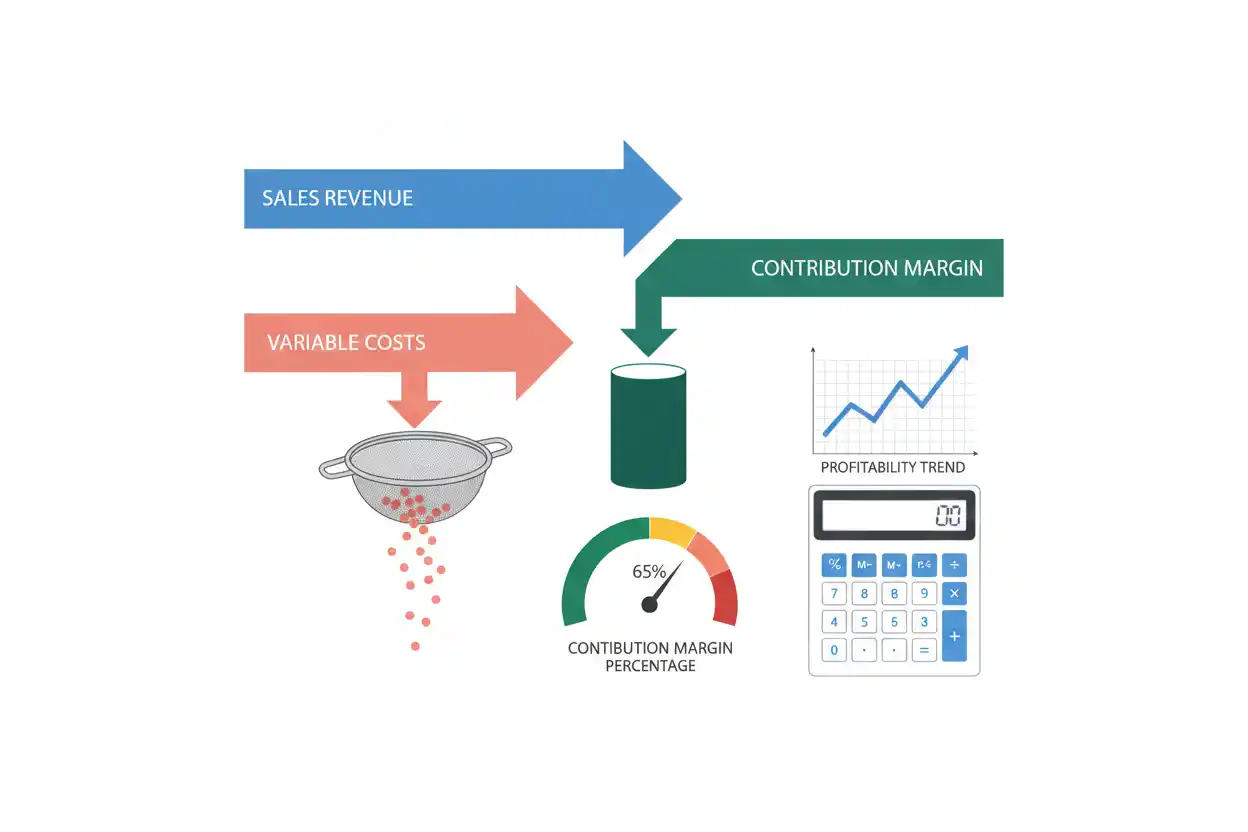
The contribution margin ratio measures the percentage of sales revenue remaining after variable costs are deducted. That remaining amount is available to cover fixed costs and, after fixed costs are covered, contribute to operating profit.
For example, a 40% contribution margin ratio means that each $1.00 of sales contributes $0.40 toward fixed costs and profit after variable costs.
The ratio is especially useful for pricing, product-mix decisions, cost-volume-profit analysis, and understanding how changes in sales can affect earnings.
What Is the Contribution Margin Ratio?
Contribution margin measures the difference between sales and variable costs.
The contribution margin ratio converts that amount into a percentage of sales.
A business selling a product for $100 with $60 of variable cost earns a $40 contribution margin per unit. Because $40 is 40% of the $100 selling price, its contribution margin ratio is 40%.
The underlying dollar measure is covered separately by contribution margin. The contribution margin ratio focuses specifically on the proportion of each sales dollar that remains after variable costs.
Contribution Margin Ratio Formula
The standard formula is:
Contribution Margin Ratio = Contribution Margin ÷ Sales Revenue × 100
Because contribution margin equals sales minus variable costs, the formula can also be written as:
Contribution Margin Ratio = (Sales Revenue − Variable Costs) ÷ Sales Revenue × 100
For a single product:
Contribution Margin Ratio = (Selling Price per Unit − Variable Cost per Unit) ÷ Selling Price per Unit × 100
The percentage can also be expressed as a decimal. A 40% contribution margin ratio is equivalent to 0.40.
Contribution Margin Ratio Example
Suppose a company sells a product for $80 per unit.
Its variable cost is $48 per unit.
First calculate contribution margin per unit:
Contribution Margin per Unit = $80 − $48 = $32
Then calculate the ratio:
Contribution Margin Ratio = $32 ÷ $80 × 100 = 40%
The company’s contribution margin ratio is 40%.
This means every $1 of sales leaves $0.40 after variable costs.
The remaining $0.60 of each sales dollar is consumed by variable costs.
Contribution Margin Ratio Using Total Sales
The same ratio can be calculated using total-period figures.
Suppose the business sells 12,500 units at $80 each.
Total revenue is:
Sales Revenue = 12,500 × $80 = $1,000,000
Total variable costs are:
Variable Costs = 12,500 × $48 = $600,000
Contribution margin is therefore:
Contribution Margin = $1,000,000 − $600,000 = $400,000
Now calculate the ratio:
Contribution Margin Ratio = $400,000 ÷ $1,000,000 × 100 = 40%
The result remains 40% because the selling price and variable cost per unit have not changed.
What Does the Contribution Margin Ratio Mean?
The ratio shows how strongly additional revenue contributes toward fixed costs and profit before considering any changes in fixed expenses.
Suppose the contribution margin ratio is 40%.
An additional $10,000 of sales, assuming the same sales mix and variable-cost relationship, would generate approximately:
Incremental Contribution Margin = $10,000 × 40% = $4,000
That $4,000 is not automatically net profit. Fixed costs still need to be covered.
If fixed costs have already been fully covered for the period and no additional fixed expenses are triggered, the incremental contribution may flow more directly toward operating profit.
Contribution Margin Ratio vs. Contribution Margin
These terms are related but not identical.
Contribution margin is a dollar amount:
Contribution Margin = Sales − Variable Costs
Contribution margin ratio is a percentage:
Contribution Margin Ratio = Contribution Margin ÷ Sales × 100
Suppose sales are $250,000 and variable costs are $150,000.
Contribution margin is:
$250,000 − $150,000 = $100,000
The ratio is:
$100,000 ÷ $250,000 × 100 = 40%
The dollar amount tells you how much remains. The ratio tells you what portion of sales remains.
Contribution Margin Ratio vs. Gross Margin
Contribution margin ratio should not be confused with gross margin.
Gross margin is generally derived from revenue and cost of goods sold. Contribution margin instead separates costs according to whether they vary with activity.
That distinction matters because cost of goods sold can contain costs that do not behave entirely as variable costs, depending on the business and accounting approach.
A company can therefore have a gross margin percentage that differs substantially from its contribution margin ratio.
Contribution margin is primarily a managerial and decision-making concept. Gross margin is commonly used in financial reporting and profitability analysis.
Variable Costs Drive the Ratio
The contribution margin ratio depends directly on variable costs.
If selling prices remain constant and variable costs rise, contribution margin falls.
Consider the original $80 product.
At a $48 variable cost:
Contribution Margin Ratio = ($80 − $48) ÷ $80 = 40%
Suppose variable cost rises to $56:
Contribution Margin Ratio = ($80 − $56) ÷ $80 = 30%
A relatively modest increase in unit cost has reduced the ratio from 40% to 30%.
This is why freight, commissions, transaction fees, materials, packaging, and other variable expenses can materially change product economics.
How Price Changes Affect Contribution Margin Ratio
Changing price also changes the ratio when variable cost per unit remains constant.
Using the same $48 variable cost, suppose the selling price rises from $80 to $90.
Contribution margin becomes:
Contribution Margin per Unit = $90 − $48 = $42
The new ratio is:
Contribution Margin Ratio = $42 ÷ $90 × 100 ≈ 46.67%
The higher price raises both contribution margin dollars and the contribution margin percentage.
However, a price increase may affect demand. A higher ratio per sale is not automatically better if the price change causes unit volume to decline substantially.
How Discounts Affect Contribution Margin
Discounting can reduce contribution economics faster than revenue alone suggests.
Suppose an $80 product with $48 of variable cost is discounted by 10%.
The new selling price becomes:
Discounted Price = $80 × 90% = $72
Contribution margin becomes:
Contribution Margin = $72 − $48 = $24
The new contribution margin ratio is:
Contribution Margin Ratio = $24 ÷ $72 × 100 ≈ 33.33%
The selling price declined by 10%, but contribution margin per unit fell from $32 to $24—a 25% reduction.
This illustrates why discount decisions should be evaluated using contribution economics rather than sales percentage alone.
Contribution Margin Ratio and Fixed Costs
Fixed costs are not deducted when calculating contribution margin.
Instead, contribution margin is the amount available to cover those fixed costs.
Suppose a company has:
- monthly fixed costs of $120,000;
- a 40% contribution margin ratio; and
- $400,000 of monthly sales.
Total contribution margin is:
Contribution Margin = $400,000 × 40% = $160,000
After covering $120,000 of fixed costs:
Operating Profit = $160,000 − $120,000 = $40,000
This illustrates the role of contribution margin without changing the ratio’s core definition.
Contribution Margin Ratio and Break-Even Analysis
The contribution margin ratio is an important input in revenue-based break-even analysis.
A higher ratio means a larger share of each sales dollar is available to cover fixed expenses.
A lower ratio means more revenue is generally required to generate the same amount of contribution.
The actual revenue threshold is a distinct calculation addressed by break-even sales. Keeping the calculations separate is useful because the contribution margin ratio describes unit economics, while break-even sales determines the sales level needed to cover fixed costs.
Multi-Product Contribution Margin Ratio
Businesses selling multiple products need to consider sales mix.
Suppose Product A has a 60% contribution margin ratio while Product B has a 20% ratio.
If customers shift toward Product B, the company’s overall weighted contribution margin ratio can decrease even if total revenue remains unchanged.
For example:
| Product | Sales | Contribution Margin |
|---|---|---|
| Product A | $300,000 | $180,000 |
| Product B | $200,000 | $40,000 |
| Total | $500,000 | $220,000 |
Overall contribution margin ratio:
$220,000 ÷ $500,000 × 100 = 44%
The company-wide ratio is 44%, not the simple average of 60% and 20%.
A weighted calculation is necessary because Product A generates more sales than Product B.
What Is a Good Contribution Margin Ratio?
There is no universal percentage that qualifies as good.
A suitable contribution margin ratio depends on the industry’s cost structure, pricing power, fixed-cost burden, product mix, business model, and competitive environment.
A software business may have relatively low variable delivery costs and therefore a high contribution margin ratio.
A distribution or retail business may operate successfully with a lower percentage if it generates sufficient volume and controls fixed expenses.
The useful comparisons are usually:
- the company’s ratio over time;
- actual versus planned contribution margin;
- one product versus another;
- customer or channel economics;
- the effect of proposed pricing changes; and
- contribution relative to the fixed-cost structure.
The ratio should therefore be interpreted economically, not judged against a universal threshold.
Contribution Margin Ratio and Cost Variance
A cost variance can help explain why an actual contribution margin ratio differs from the expected ratio.
Suppose a product was budgeted to have $45 of variable cost but actual variable cost rose to $50 because of higher materials or shipping costs.
If the selling price remains unchanged, the unfavorable cost change directly reduces contribution margin.
Comparing actual cost behavior with standards or budgets can therefore reveal the operational drivers behind a changing ratio.
Capacity Utilization Can Affect Contribution Economics
Changes in capacity utilization do not automatically alter the contribution margin ratio because many capacity-related expenses are fixed.
However, operating near capacity can create additional variable or semi-variable costs such as overtime, expedited shipping, subcontracting, equipment wear, or higher marginal production costs.
If those incremental costs increase variable cost per unit, the contribution margin ratio can decline.
This makes cost classification particularly important when managers use the ratio for short-term decisions.
Contribution Margin Ratio Is Not a Cash Flow Metric
A high contribution margin ratio does not guarantee strong cash generation.
The ratio is based on sales and variable costs, while actual liquidity also depends on when customers pay, when suppliers are paid, inventory investment, capital expenditures, taxes, debt payments, and financing activity.
Those cash movements appear in the cash flow statement.
Similarly, a business using cash accounting may recognize transactions at different times from an accrual-based management analysis. Cost behavior and cash timing therefore should not be treated as the same concept.
How to Improve Contribution Margin Ratio
A company can improve its contribution margin ratio by increasing selling prices, reducing variable costs, improving product mix, or redesigning transactions so that each sales dollar generates more contribution.
However, the economic consequences need to be considered.
A price increase may reduce demand. Cheaper materials may create quality issues. Removing sales commissions may hurt growth. Shifting toward high-margin products may require additional marketing or fixed investment.
The best change is one that improves total contribution and long-term economics rather than merely improving the percentage in isolation.
Common Contribution Margin Ratio Mistakes
A frequent mistake is including fixed costs in the numerator calculation. Fixed costs are covered by contribution margin; they are not deducted to determine it.
Another is confusing gross margin with contribution margin ratio. Cost of goods sold and variable costs are not necessarily identical.
Businesses also sometimes classify costs incorrectly. A cost may appear fixed within one activity range but become variable or step-fixed when volume changes materially.
Another error is assuming that the highest contribution margin percentage always identifies the best product. Volume, capacity constraints, demand, customer acquisition costs, and the use of scarce resources may change the optimal decision.
Frequently Asked Questions
What is the contribution margin ratio?
The contribution margin ratio is the percentage of sales remaining after variable costs are deducted.
It indicates how much of each sales dollar is available to cover fixed costs and contribute to profit.
What is the contribution margin ratio formula?
The standard formula is:
Contribution Margin Ratio = Contribution Margin ÷ Sales Revenue × 100
It can also be calculated as:
Contribution Margin Ratio = (Sales − Variable Costs) ÷ Sales × 100
What does a 40% contribution margin ratio mean?
A 40% ratio means that $0.40 of every $1.00 in sales remains after variable costs.
That $0.40 is available to cover fixed costs and, after fixed costs have been covered, contribute to profit.
Is contribution margin ratio the same as profit margin?
No.
Contribution margin ratio deducts variable costs from sales but does not deduct all fixed operating expenses, interest, taxes, or other costs required to calculate final profit.
Metrics such as net margin answer a different profitability question.
Can the contribution margin ratio be negative?
Yes.
If variable costs exceed sales revenue, contribution margin becomes negative and the ratio is also negative.
In that situation, each additional sale at the existing economics may increase losses before fixed costs are even considered.
Can contribution margin ratio exceed 100%?
Under normal positive-revenue operations with positive variable costs, it generally should not.
A ratio above 100% would normally require unusual circumstances, such as negative variable costs, rebates exceeding certain costs, unusual accounting classifications, or data errors.
Does a higher contribution margin ratio always mean a better business?
Not necessarily.
A higher ratio provides more contribution per sales dollar, but total profitability also depends on sales volume, fixed expenses, demand, capacity, customer acquisition economics, and other costs.
A lower-ratio business can still be highly profitable at sufficient scale.
How is contribution margin ratio used in pricing?
It allows a company to see how much of the selling price remains after variable costs.
Managers can model price increases, discounts, cost changes, and product mix to understand how those decisions affect contribution per dollar of revenue.
Why can contribution margin ratio differ from gross margin?
Contribution margin classifies costs by behavior—primarily variable versus fixed.
Gross margin generally compares sales with cost of goods sold. Because cost of goods sold can include cost components that do not behave strictly as variable costs, the two percentages can differ.
Does contribution margin ratio include fixed costs?
No.
Fixed costs are excluded from the contribution margin calculation. The contribution generated after variable costs is what becomes available to cover fixed costs and eventually produce profit.
The ratio therefore works best as part of broader accounting and operations analysis rather than as a standalone measure of overall profitability.




