


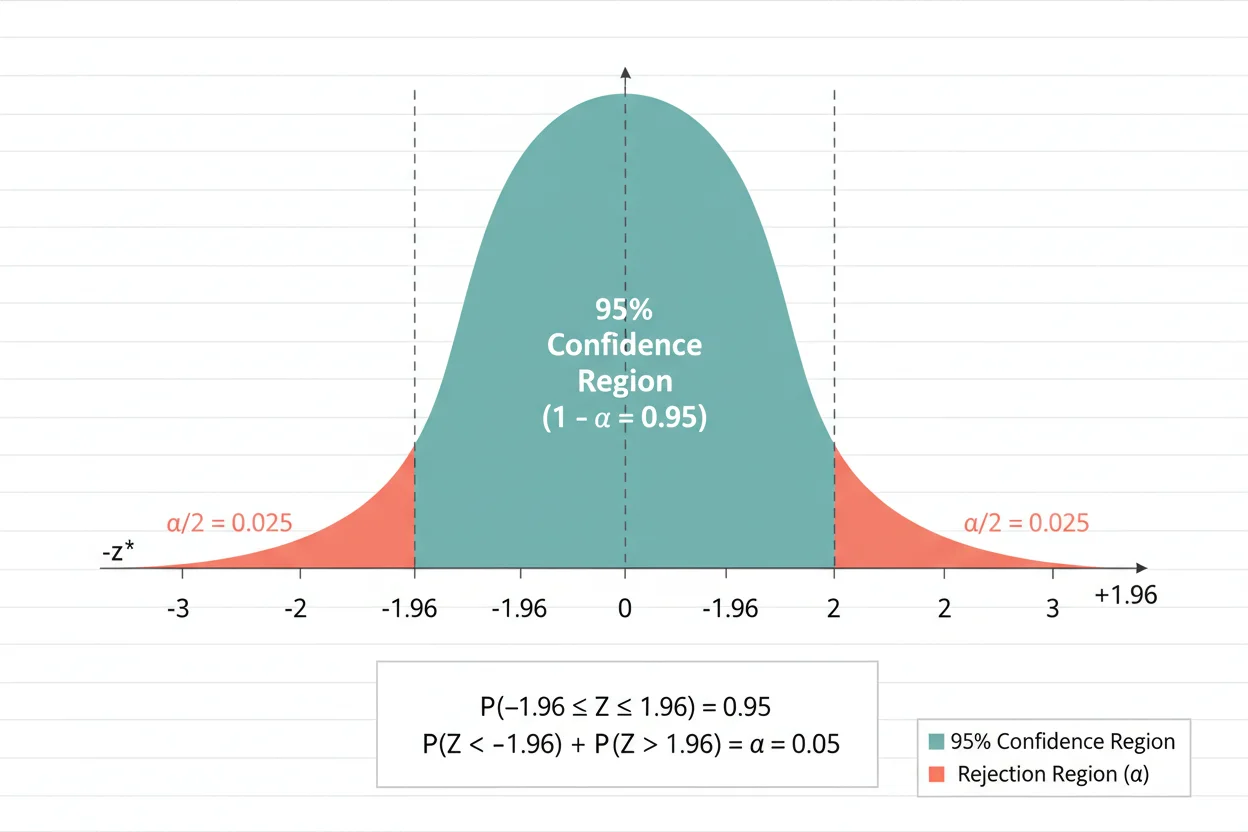
A confidence level specifies the long-run success rate of a confidence-interval procedure under repeated sampling. A 95% confidence level means that if the same sampling process and interval method were repeated many times, approximately 95% of the resulting intervals would contain the true population parameter when the statistical assumptions are satisfied. The remaining 5% represents the procedure’s noncoverage probability, commonly denoted by α. For a two-sided 95% procedure, that 5% is usually split equally between the two tails, leaving 2.5% in each tail. A higher confidence level generally requires a larger critical value, which makes the corresponding interval wider when the sample estimate and standard error remain unchanged. A lower confidence level produces a narrower interval but reduces long-run coverage. The confidence level therefore reflects a deliberate tradeoff between coverage and precision rather than a probability that an already-computed interval happens to contain a fixed parameter.
The confidence level is a foundational concept within core statistics and the broader Statistics & Probability framework. It determines the coverage target used when constructing confidence intervals, while the numerical cutoff used for a particular distribution is determined by the relevant critical values.
What Is a Confidence Level?
A confidence level is the proportion of intervals that would contain the true population parameter over repeated applications of the same statistical procedure.
Common choices are:
90%
95%
99%
These percentages are often written as decimal probabilities:
0.90
0.95
0.99
If the confidence level is represented by:
1 − α
then:
Confidence level = 1 − α
and therefore:
α = 1 − confidence level
For a 95% confidence level:
α = 1 − 0.95
α = 0.05
For a 99% confidence level:
α = 1 − 0.99
α = 0.01
The quantity α represents the total probability outside the confidence region in the reference distribution for the usual construction.
Confidence Level Formula
The basic relationship is:
C = 1 − α
where:
- C = confidence level expressed as a decimal
- α = total noncoverage probability
Equivalently:
α = 1 − C
If confidence level is expressed as a percentage:
Confidence level (%) = (1 − α) × 100%
For example, if:
α = 0.10
then:
C = 1 − 0.10 = 0.90
so the confidence level is:
90%
If:
α = 0.01
then:
C = 0.99
so the confidence level is:
99%
The calculation is straightforward, but interpreting the result correctly is more important than the subtraction itself.
What Does a 95% Confidence Level Mean?
Suppose a researcher repeatedly takes independent samples from the same population and constructs a confidence interval using exactly the same 95% procedure every time.
Some intervals will contain the true population parameter.
Some will miss it.
Over a very large number of repetitions, approximately:
95%
of the intervals are expected to contain the parameter, while approximately:
5%
are expected to miss it, assuming the model and sampling assumptions hold.
This is a statement about the long-run performance of the interval-generating procedure.
It is not, under standard frequentist interpretation, a statement that the fixed population parameter has a 95% probability of lying in one particular interval after that interval has already been calculated.
Why the Parameter Is Treated as Fixed
In frequentist inference, a population parameter such as:
μ
or:
p
is treated as a fixed but unknown quantity.
The sample is random.
Therefore, before sampling, the endpoints of a confidence interval are random because they depend on the sample.
After the sample has been observed and an interval has been calculated, its endpoints are fixed as well.
At that point, the interval either contains the true parameter or it does not.
The confidence level describes how frequently the method succeeds across repeated samples.
This distinction prevents one of the most common errors in statistical interpretation.
Confidence Level vs Confidence Interval
A confidence level and a confidence interval are closely related, but they are not the same thing.
The confidence level is a percentage such as:
95%
The confidence interval is the numerical range obtained from the sample, such as:
(42.1, 48.7)
The confidence level determines how much long-run coverage the interval procedure is designed to provide.
The confidence intervals calculation then combines a point estimate, standard error, and critical value to obtain the actual endpoints.
For many common symmetric procedures:
Confidence interval = estimate ± critical value × standard error
The confidence level influences the critical value.
Higher confidence generally means a larger critical value and therefore a wider interval.
Confidence Level and Alpha
The relationship between confidence level and α is:
Confidence level = 1 − α
Suppose:
Confidence level = 95%
Convert the percentage to decimal form:
C = 0.95
Then:
α = 1 − 0.95
α = 0.05
For a standard two-sided procedure, α is divided between both tails:
α/2 = 0.025
Therefore, the central area is:
1 − 0.025 − 0.025 = 0.95
This central 95% region is what produces the familiar normal critical values near:
−1.96
and:
+1.96
for a standard two-sided normal-based procedure.
Confidence Level Example
Suppose a statistical procedure uses:
α = 0.05
The confidence level is:
C = 1 − α
Substitute:
C = 1 − 0.05
C = 0.95
Convert to a percentage:
C = 95%
Therefore, a significance level of 5% corresponds numerically to a 95% confidence level for the matching procedure.
If the interval is two-sided:
α/2 = 0.025
is placed in each tail.
For a standard normal reference distribution, the resulting critical value is approximately:
z* = 1.96
A compatible interval calculation can then use:
Estimate ± 1.96 × SE
The confidence level determines the coverage target, while the exact interval endpoints depend on the sample estimate and standard error.
Confidence Level and Critical Values
A confidence level cannot be converted into one universal critical value without knowing the reference distribution and whether the procedure is one-sided or two-sided.
For a standard normal distribution, commonly used two-sided critical values are approximately:
| Confidence Level | α | α/2 | z* |
|---|---|---|---|
| 80% | 0.20 | 0.10 | 1.282 |
| 90% | 0.10 | 0.05 | 1.645 |
| 95% | 0.05 | 0.025 | 1.960 |
| 98% | 0.02 | 0.01 | 2.326 |
| 99% | 0.01 | 0.005 | 2.576 |
As the confidence level rises, the critical value moves farther into the tails.
For example:
95% → z* ≈ 1.96
while:
99% → z* ≈ 2.576
Because 2.576 is larger than 1.96, a 99% interval will be wider than a corresponding 95% interval when the estimate and standard error are unchanged.
The separate topic of critical values includes z, t, chi-square, and other reference-distribution cutoffs.
How to Find a z Critical Value From a Confidence Level
For a two-sided normal-based confidence procedure, begin with the confidence level C.
Suppose:
C = 0.95
First calculate:
α = 1 − C
α = 1 − 0.95 = 0.05
Then divide α between two tails:
α/2 = 0.025
The cumulative probability to the left of the positive critical value is therefore:
1 − α/2 = 0.975
So we need the standard normal quantile satisfying:
P(Z ≤ z*) = 0.975
That value is:
z* ≈ 1.96
Therefore:
P(−1.96 ≤ Z ≤ 1.96) ≈ 0.95
This calculation illustrates why 1.96 is associated with a 95% confidence level for a two-sided standard normal procedure.
Example: Finding the Critical Value for a 90% Confidence Level
Suppose:
C = 0.90
Then:
α = 1 − 0.90 = 0.10
For a two-sided procedure:
α/2 = 0.05
The cumulative probability below the upper critical value is:
1 − 0.05 = 0.95
The standard normal 95th percentile is approximately:
z* ≈ 1.645
Therefore, the central probability is:
P(−1.645 ≤ Z ≤ 1.645) ≈ 0.90
A two-sided 90% normal-based interval consequently uses:
Estimate ± 1.645 × SE
when the normal critical-value framework is appropriate.
Example: Finding the Critical Value for a 99% Confidence Level
For:
C = 0.99
we have:
α = 0.01
and:
α/2 = 0.005
Therefore, the cumulative probability below the upper cutoff is:
1 − 0.005 = 0.995
The corresponding standard normal critical value is approximately:
z* ≈ 2.576
Thus:
P(−2.576 ≤ Z ≤ 2.576) ≈ 0.99
A 99% procedure requires a wider central region than a 95% procedure, so its cutoff lies farther from zero.
Confidence Level and Interval Width
For many standard confidence intervals:
Margin of error = critical value × standard error
Suppose two analyses use the same estimate and:
SE = 4
For a 90% confidence level:
ME ≈ 1.645 × 4
ME ≈ 6.58
For a 95% confidence level:
ME ≈ 1.96 × 4
ME ≈ 7.84
For a 99% confidence level:
ME ≈ 2.576 × 4
ME ≈ 10.304
The same data therefore produce increasingly wide intervals as the desired confidence level rises.
This reflects a fundamental tradeoff.
To obtain greater long-run coverage without collecting more information, the procedure must accept a wider range of parameter values.
Why Higher Confidence Means a Wider Interval
Imagine trying to construct an interval that captures a fixed parameter more frequently over repeated samples.
A narrow interval covers only a relatively small range around each sample estimate.
To improve the probability that the parameter falls inside the interval, the endpoints need to extend farther from the estimate.
Mathematically, this happens because the critical value increases.
For example:
90% → z* ≈ 1.645
95% → z* ≈ 1.960
99% → z* ≈ 2.576
Since:
ME = z* × SE
a larger z* produces a larger margin of error.
The resulting interval becomes wider.
Does Higher Confidence Mean Better Statistics?
Not automatically.
A 99% confidence level offers greater long-run coverage than a 95% confidence level, but its interval is also less precise in the sense of being wider.
Suppose the same estimate produces:
95% CI = (48, 52)
and:
99% CI = (46.7, 53.3)
The 99% interval has greater coverage but includes more possible parameter values.
Whether that tradeoff is desirable depends on the consequences of uncertainty, the field of study, the decision being made, and established conventions.
There is no universal rule that the highest possible confidence level is always best.
Choosing a Confidence Level
The confidence level should ideally be selected before examining results.
Common considerations include the cost of error, required precision, sample size, field-specific standards, and consequences of decisions based on the estimate.
A 95% confidence level is extremely common, but its popularity does not make it mathematically mandatory.
A 90% confidence level may be reasonable when greater precision is valuable and somewhat lower coverage is acceptable.
A 99% confidence level may be appropriate when missing the true parameter would have particularly serious consequences.
The choice should reflect the inferential objective rather than being selected afterward because one level produces more convenient conclusions.
Why 95% Is Common
The 95% confidence level became a widely used statistical convention because it provides a practical compromise between coverage and precision.
Under a standard normal reference distribution, a central 95% region corresponds to approximately:
±1.96 standard errors
which is close to the historically convenient rule of approximately two standard errors.
However, 95% is a convention rather than a law of probability.
Some contexts use 90%, 99%, or other levels depending on the risk of incorrect conclusions and the degree of uncertainty that can be tolerated.
The correct confidence level depends on the analytical objective.
Confidence Level and Sample Size
Increasing sample size does not change the selected confidence level.
If the procedure is designed as a:
95% confidence procedure
it remains a 95% procedure whether:
n = 50
or:
n = 5,000
What sample size changes is usually the standard error.
For a sample mean under a familiar independent-sampling model:
SE = σ/√n
As n increases:
SE decreases
which usually narrows the resulting interval.
This means a larger sample can provide greater precision while keeping the same confidence level.
That distinction is important.
Confidence level describes long-run coverage; sample size strongly influences precision.
Confidence Level and Margin of Error
For many symmetric procedures:
ME = critical value × SE
The confidence level affects the critical value.
Sample size and variability affect the standard error.
Therefore, margin of error depends on multiple components rather than the confidence level alone.
For example, two studies can both use a 95% confidence level but have dramatically different margins of error because one has a much larger sample.
Likewise, two studies with identical sample sizes can have different margins of error because their observed variability differs.
A confidence level should not therefore be interpreted as a direct measure of precision.
Confidence Level vs Precision
Confidence and precision are related but different.
The confidence level refers to long-run coverage.
Precision concerns how narrow an estimate’s uncertainty range is.
A procedure can have high confidence but low precision, producing a very wide interval.
For example:
99% CI = (20, 80)
has high nominal confidence but considerable uncertainty about the parameter’s actual magnitude.
Another study might produce:
95% CI = (48, 52)
which has slightly lower nominal coverage but far greater precision.
The appropriate comparison depends on both the coverage objective and the substantive usefulness of the interval.
Confidence Level and Standard Error
The confidence level itself does not determine the standard error.
Standard error arises from the sampling variability of an estimator.
For a mean under a simple independent model:
SE(x̄) = σ/√n
or when σ is estimated:
Estimated SE(x̄) = s/√n
The confidence level enters later through the critical value.
The basic structure is:
Estimate ± critical value × SE
Therefore:
Confidence level → critical value
while:
data and sampling design → standard error
Keeping these roles separate makes confidence calculations easier to understand.
Confidence Level and t Distributions
The familiar 1.96 critical value applies to a two-sided 95% procedure using a standard normal reference distribution.
It is not the correct critical value for every 95% confidence procedure.
When estimating a population mean with unknown population standard deviation, a t distribution is commonly used.
For a one-sample mean:
df = n − 1
A 95% t critical value depends on df.
For example:
df = 10 → t* ≈ 2.228
while:
df = 100 → t* ≈ 1.984
As degrees of freedom increase:
t* → 1.96
for a two-sided 95% procedure.
Thus, knowing the confidence level alone is insufficient to identify a t critical value. Degrees of freedom are also required.
Confidence Level and Chi-Square Distributions
Confidence procedures for some parameters use a chi-square reference distribution rather than z or t.
For example, when constructing an interval for a population variance under appropriate normal-population assumptions, chi-square quantiles are used.
The chi-square distribution is asymmetric, so the resulting confidence interval for variance is generally not symmetric around the sample variance.
This reinforces an important principle:
A confidence level specifies a coverage target, but the mathematical construction required to achieve that target depends on the parameter and sampling distribution.
There is no universal “95% formula” that works unchanged for every statistical problem.
Confidence Level in One-Sided Procedures
Suppose the purpose is to construct only an upper confidence bound or only a lower confidence bound.
For a one-sided 95% normal-based procedure:
α = 0.05
but all of α is placed in one tail.
The required normal critical value is approximately:
z* = 1.645
This differs from the two-sided 95% critical value:
z* = 1.96
because a two-sided interval divides:
α = 0.05
into:
0.025
in each tail.
Therefore, “95% confidence level” does not uniquely determine a critical value unless the analyst also knows whether the procedure is one-sided or two-sided.
Two-Sided vs One-Sided Confidence
A two-sided confidence interval gives both a lower and an upper bound:
L < θ < U
A one-sided confidence procedure gives only one finite bound.
For example:
θ > L
or:
θ < U
A two-sided procedure is appropriate when departures in both directions matter.
A one-sided procedure may be appropriate when only one direction is scientifically or operationally meaningful and that choice is justified in advance.
Switching from two-sided to one-sided inference after seeing the data can distort the intended error properties.
Confidence Level and Hypothesis Testing
For matching procedures, confidence levels are closely connected with significance levels in hypothesis testing.
A two-sided test with:
α = 0.05
often corresponds to a:
95%
confidence interval.
The numerical relationship is:
C = 1 − α
Suppose a two-sided null hypothesis is:
H₀: θ = θ₀
If a corresponding 95% confidence interval excludes θ₀, the matching two-sided test generally rejects H₀ at:
α = 0.05
If the interval contains θ₀, the corresponding test generally does not reject H₀.
The exact correspondence requires the confidence interval and hypothesis test to be based on compatible statistical procedures.
Confidence Level Is Not the Probability H₀ Is True
Suppose a statistical test uses:
α = 0.05
and the related confidence procedure uses:
C = 0.95
It would be incorrect to conclude:
“There is a 95% probability that the accepted hypothesis is true.”
Neither α nor confidence level assigns a posterior probability to a hypothesis.
A traditional frequentist significance test works with the sampling distribution of data or a test statistic conditional on H₀.
Posterior probability statements require a different inferential framework, such as one developed through Bayes’ theorem.
The two conditional directions should not be confused.
Confidence Level and p-Values
A confidence level such as 95% is chosen for an interval procedure.
A p-value is calculated from observed sample data under a null hypothesis.
These are different quantities.
For a matching two-sided procedure:
95% confidence level ↔ α = 0.05
but this does not mean:
confidence level = 1 − p-value
For example, if:
p = 0.012
it is incorrect to say:
Confidence level = 98.8%
The chosen confidence level is determined independently of the observed p-value.
This is a common statistical mistake.
Confidence Level and Binomial Data
Suppose x successes are observed among n binary trials.
A population success probability p can be estimated from:
p̂ = x/n
An interval procedure for p can then be constructed with a chosen confidence level.
The underlying probability model may involve the binomial probability structure, but the confidence level still describes the repeated-sampling coverage of the interval method.
Different interval procedures can all claim a nominal 95% confidence level while having somewhat different actual coverage properties, especially with small samples or probabilities near 0 or 1.
Therefore, the confidence level alone does not fully describe the statistical quality of an interval method.
Nominal vs Actual Confidence Level
The stated confidence level is often called the nominal confidence level.
For example:
Nominal C = 95%
Ideally, the procedure’s actual coverage probability is close to:
0.95
However, approximations, discrete data, model violations, or small samples can cause actual coverage to differ from the nominal value.
For some discrete problems, it may be impossible to construct a nonrandomized interval whose coverage is exactly 95% for every possible parameter value.
This distinction is one reason the choice of interval method matters.
A label of “95% confidence interval” does not guarantee mathematically exact 95% coverage under all circumstances.
Confidence Coefficient
The decimal form of a confidence level is sometimes called the confidence coefficient.
For example:
95% confidence level → confidence coefficient = 0.95
90% confidence level → confidence coefficient = 0.90
99% confidence level → confidence coefficient = 0.99
Thus:
Confidence coefficient = 1 − α
The terms are closely related, with confidence level often expressed as a percentage and confidence coefficient expressed as a decimal.
Confidence Level Does Not Describe the Data Percentage
A 95% confidence level does not mean that 95% of observed data values lie inside the corresponding confidence interval.
A confidence interval for a population mean estimates uncertainty about the mean, not the spread of individual observations.
For example, a sample may contain individual observations from 20 to 100 while a confidence interval for the population mean is only:
(58, 62)
There is no contradiction.
The interval estimates the location of the population mean, not the range containing 95% of the population.
Prediction and tolerance intervals address different questions about individual observations and population coverage.
Confidence Level Does Not Measure Sample Quality
A high confidence level cannot repair a biased sample.
Suppose a study uses a large convenience sample that systematically excludes an important segment of the target population.
It may construct a very narrow:
99% confidence interval
under an independence model.
However, the interval can still be centered around a biased estimate.
Confidence level concerns the behavior of the statistical procedure under its assumptions. It does not certify that the sampling design, measurements, or model are appropriate.
Bias and confidence are distinct issues.
Confidence Level Does Not Guarantee Causation
A confidence level also says nothing by itself about whether an observed relationship is causal.
For example, a 95% confidence interval for a correlation coefficient may exclude zero, providing statistical evidence of a nonzero linear association under the procedure’s assumptions.
That does not establish that changing one variable causes the other to change.
Confounding, reverse causation, selection effects, and study design remain relevant.
The confidence level quantifies an inferential procedure’s coverage, not the causal validity of the research design.
Confidence Level and Covariance
Measures such as covariance describe how two variables vary together, while a confidence level concerns uncertainty around an estimator.
The concepts can appear together when estimating a covariance parameter or when covariance terms contribute to the standard error of a more complex statistic.
However, covariance itself is not a confidence measure.
Likewise, a large covariance does not imply a high confidence level, and a high confidence level does not imply a strong relationship between variables.
They describe different statistical properties.
Why 100% Confidence Is Usually Not Useful
It may seem desirable to demand a 100% confidence level.
However, for many parameters with unbounded parameter spaces, guaranteeing 100% coverage through an ordinary finite-data interval can require an interval so broad that it becomes uninformative.
Conceptually, increasing confidence requires widening the interval.
As:
C → 1
the required critical value can increase dramatically for common continuous reference distributions.
For a standard normal two-sided procedure:
C = 0.95 → z* ≈ 1.96
C = 0.99 → z* ≈ 2.576
C = 0.999 → z* ≈ 3.291
Perfect certainty is generally incompatible with narrow estimation when information is limited.
Statistical inference manages uncertainty rather than eliminating it.
Low Confidence Levels and Narrow Intervals
Reducing the confidence level can make an interval narrower.
For example:
80% → z* ≈ 1.282
95% → z* ≈ 1.960
If the standard error is unchanged, the 80% interval has a smaller margin of error.
However, its long-run coverage is also lower.
Therefore, selecting a low confidence level simply to produce a narrow interval is not automatically good practice.
The confidence level should be justified by the inferential goal rather than chosen to make the results appear more precise.
Confidence Level and Repeated Sampling
The repeated-sampling interpretation can be illustrated with 100 hypothetical studies.
Suppose each study independently:
- samples from the same population,
- calculates the same type of estimate,
- constructs a 95% confidence interval.
In the long run, roughly:
95 out of 100
such intervals would be expected to contain the true parameter.
Roughly:
5 out of 100
would be expected to miss it.
The exact count in any particular batch of 100 experiments need not be exactly 95 because coverage itself is subject to random variation.
The confidence level describes a long-run probability, not a guarantee for each finite set of repetitions.
Does a 99% Confidence Level Mean the Result Is 99% Accurate?
No.
“Accuracy” can refer to several different statistical properties, including bias, measurement quality, sampling representativeness, or closeness to the true parameter.
A 99% confidence level describes nominal long-run interval coverage.
A 99% interval can still be:
- very wide,
- based on biased observations,
- calculated under inappropriate assumptions,
- centered around a poor estimate.
Confidence level should therefore not be used as a generic percentage score for the quality or accuracy of a study.
Does a Larger Sample Increase the Confidence Level?
No.
If an analyst chooses:
C = 0.95
then the nominal confidence level remains 95% regardless of sample size.
Increasing n generally decreases the standard error and improves precision.
For example:
SE ∝ 1/√n
in many standard settings.
Thus, a larger sample usually produces a narrower interval at the same confidence level.
This distinction is one of the most important relationships in interval estimation:
confidence level = chosen coverage target
sample size = major determinant of precision
Can Two Studies Use Different Confidence Levels?
Yes.
One study might report:
90% confidence intervals
while another reports:
95% confidence intervals
Even if they use identical data, their intervals will generally have different widths because their critical values differ.
Direct comparison therefore requires attention to the reported confidence level.
A narrower 90% interval should not automatically be interpreted as evidence that one study estimated its parameter more precisely than another study reporting a 99% interval.
The confidence levels must first be accounted for.
Common Confidence Level Mistakes
A major mistake is interpreting a 95% confidence level as a 95% posterior probability that a particular interval contains the parameter. That is not the standard frequentist interpretation.
Another mistake is saying that 95% of sample observations lie within a 95% confidence interval. A confidence interval estimates a parameter rather than directly describing the spread of individual observations.
A third error is assuming that a higher confidence level always means a better result. Greater coverage comes at the cost of a wider interval when other factors remain constant.
Another common mistake is computing:
confidence level = 1 − p-value
The confidence level is chosen as part of the inferential procedure and is not determined by the observed p-value.
It is also incorrect to assume that 95% confidence always means:
z* = 1.96
A t-based, chi-square-based, one-sided, discrete, or specialized procedure can require a different critical value.
Finally, a high confidence level does not correct bias, confounding, dependence, measurement error, or other violations of the assumptions underlying the analysis.
How to Calculate a Confidence Level From Alpha
If α is given, the calculation is direct.
Step 1: Identify α
Suppose:
α = 0.08
Step 2: Use the Relationship
C = 1 − α
Step 3: Substitute
C = 1 − 0.08
C = 0.92
Step 4: Convert to a Percentage
Confidence level = 92%
Therefore:
α = 0.08
corresponds to a:
92%
confidence level.
How to Calculate Alpha From a Confidence Level
Suppose the confidence level is:
98%
First convert it to decimal form:
C = 0.98
Then:
α = 1 − C
α = 1 − 0.98
α = 0.02
For a two-sided procedure:
α/2 = 0.01
Therefore, 1% of the reference probability is placed in each tail.
This tail probability is then used to determine the appropriate critical values.
Confidence Level Example With Margin of Error
Suppose a point estimate is:
100
and the standard error is:
SE = 5
Using a two-sided 95% normal-based procedure:
z* = 1.96
The margin of error is:
ME = 1.96 × 5
ME = 9.8
The corresponding interval is:
100 ± 9.8
or:
(90.2, 109.8)
Now suppose the confidence level is increased to 99%.
Then:
z* ≈ 2.576
and:
ME ≈ 2.576 × 5
ME ≈ 12.88
The new interval is:
(87.12, 112.88)
Nothing about the point estimate or standard error changed.
The interval became wider solely because the selected confidence level increased.
Confidence Level Example With Sample Size
Suppose a mean is estimated with known:
σ = 20
At:
n = 25
the standard error is:
SE = 20/√25
SE = 4
For a 95% normal-based procedure:
ME = 1.96 × 4
ME = 7.84
Now increase the sample size to:
n = 100
Then:
SE = 20/√100
SE = 2
At the same 95% confidence level:
ME = 1.96 × 2
ME = 3.92
The confidence level remains 95%, but the margin of error is cut in half because the sample size increased fourfold.
This illustrates how more data can improve precision without sacrificing confidence.
Confidence Level and Statistical Decision-Making
Choosing a confidence level involves deciding how much long-run noncoverage risk is acceptable.
At:
C = 95%
the corresponding total noncoverage probability is:
α = 0.05
At:
C = 99%
it is:
α = 0.01
Lower α means a more conservative interval procedure in terms of coverage, but it also means accepting wider intervals unless greater sample information compensates for the larger critical value.
Statistical decision-making therefore involves balancing uncertainty, precision, consequences, and available data rather than treating one confidence level as universally correct.
Frequently Asked Questions About Confidence Level
What is a confidence level?
A confidence level is the long-run proportion of confidence intervals constructed by a specified procedure that would contain the true population parameter under repeated sampling and the procedure’s assumptions.
What is the formula for confidence level?
The basic formula is:
C = 1 − α
where C is the confidence level as a decimal and α is the total noncoverage probability.
What is the confidence level when α = 0.05?
C = 1 − 0.05 = 0.95
Therefore, the confidence level is:
95%
What is alpha for a 95% confidence level?
α = 1 − 0.95
α = 0.05
For a conventional two-sided procedure:
α/2 = 0.025
is placed in each tail.
What does a 95% confidence level mean?
It means the interval procedure is designed so that approximately 95% of intervals produced over repeated samples contain the true parameter when the assumptions hold.
Does 95% confidence mean there is a 95% probability the parameter is in my interval?
Not under the standard frequentist interpretation after the interval has been calculated. The parameter is treated as fixed, and the 95% refers to the long-run performance of the interval-generating procedure.
What is the difference between confidence level and confidence interval?
The confidence level is the selected coverage percentage, such as 95%. The confidence interval is the numerical range calculated from the sample using that procedure.
Why is 95% confidence commonly used?
It is a widely adopted convention that balances long-run coverage and interval precision reasonably well in many applications. It is not a universal requirement.
Is 99% confidence better than 95% confidence?
Not automatically. A 99% procedure has greater long-run coverage but generally produces a wider interval. Which level is appropriate depends on the analytical objective and consequences of uncertainty.
Why does a higher confidence level produce a wider interval?
Higher confidence requires a larger critical value. Since margin of error commonly equals critical value multiplied by standard error, the larger critical value widens the interval.
What is the z critical value for a 95% confidence level?
For a conventional two-sided standard normal procedure:
z* ≈ 1.96
Other distributions and one-sided procedures require different critical values.
What is the z critical value for a 90% confidence level?
For a conventional two-sided standard normal procedure:
z* ≈ 1.645
What is the z critical value for a 99% confidence level?
For a conventional two-sided standard normal procedure:
z* ≈ 2.576
Does sample size change the confidence level?
No. Sample size affects standard error and interval precision, while the confidence level is the selected long-run coverage target.
Does a larger sample make a confidence interval narrower?
Usually yes, under standard conditions. Many standard errors decrease approximately with 1/√n, so larger samples tend to produce narrower intervals at the same confidence level.
Is confidence level equal to 1 minus the p-value?
No. Confidence level is chosen for an interval procedure. A p-value is calculated from observed data under a null hypothesis.
Does a 95% confidence level mean 95% of the data lie in the interval?
No. A confidence interval for a parameter does not describe the percentage of individual observations inside a numerical range.
Is a confidence level the same as statistical significance?
No. Confidence level specifies coverage for an interval procedure. Statistical significance refers to a hypothesis-test decision relative to a significance level such as α = 0.05.
Can the same confidence level have different critical values?
Yes. Critical values depend on the reference distribution, degrees of freedom when applicable, and whether the procedure is one-sided or two-sided.
Does a high confidence level guarantee an unbiased estimate?
No. Confidence level does not correct biased sampling, measurement error, model misspecification, confounding, or invalid assumptions.
What confidence level should I use?
The choice depends on the consequences of error, required precision, available sample size, field conventions, and the inferential objective. Common choices include 90%, 95%, and 99%, with 95% being conventional rather than mandatory.




