


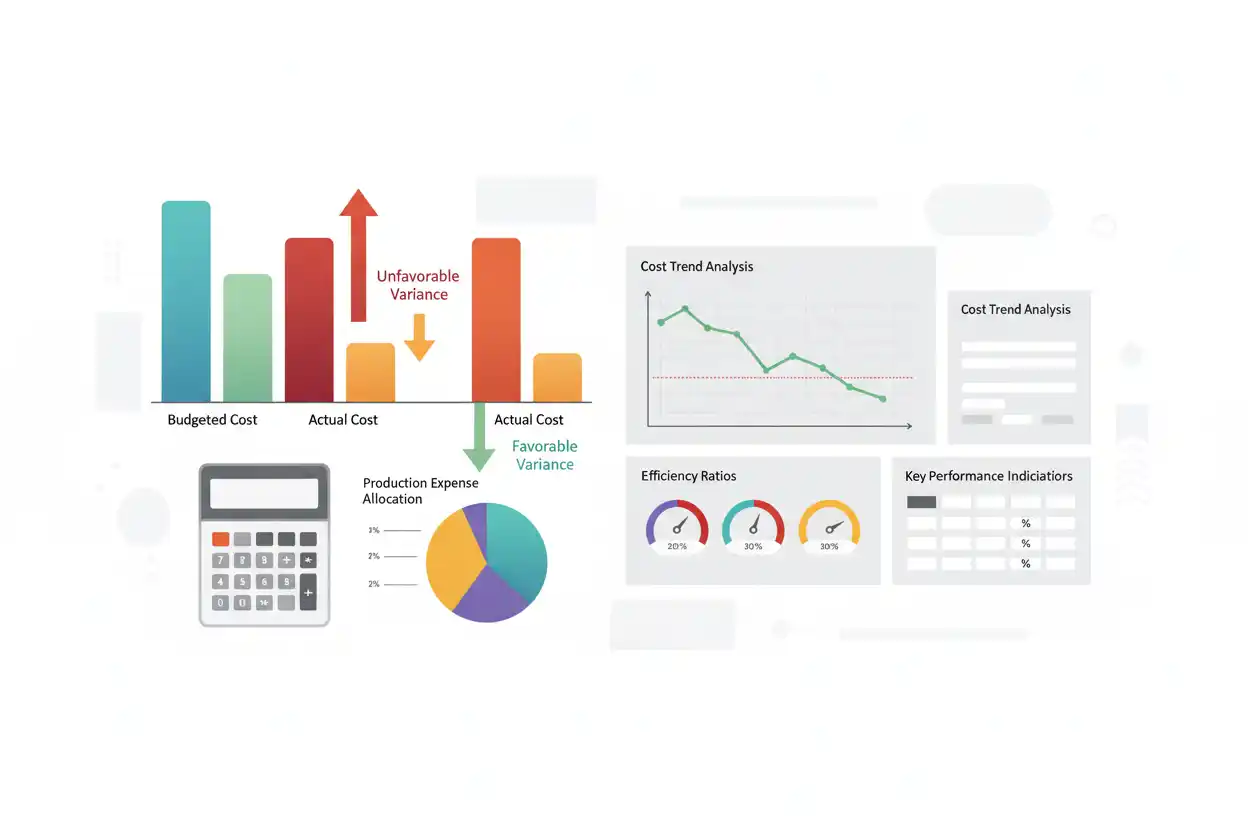
Cost variance measures the difference between an actual cost and the cost that was expected, budgeted, or established as a standard for the same activity.
If actual cost exceeds the comparable expected cost, the variance is generally unfavorable. If actual cost is lower, the variance is generally favorable.
Cost variance analysis helps businesses identify cost overruns, savings, pricing pressure, production inefficiency, changing input costs, and inaccurate assumptions before those differences become hidden inside broader financial results.
What Is Cost Variance?
A cost variance compares what something actually cost with what it should or was expected to cost under the chosen benchmark.
For example, suppose a business expected a production run to cost $80,000 but the comparable actual cost was $86,000.
The business spent $6,000 more than expected.
That is an unfavorable cost variance.
If actual cost had instead been $76,000, the company would have spent $4,000 less than expected, producing a favorable variance.
The calculation can be applied to a product, department, project, production run, cost center, or entire operating category, provided the actual and benchmark figures are genuinely comparable.
Cost Variance Formula
Using the convention where positive amounts indicate that actual cost exceeded expected cost:
Cost Variance = Actual Cost − Budgeted or Standard Cost
Under this convention:
- a positive variance is unfavorable;
- a negative variance is favorable; and
- zero means actual cost matched the benchmark.
Some organizations reverse the subtraction or report favorable and unfavorable amounts without signs. The arithmetic convention should therefore always be stated clearly.
Cost Variance Example
Suppose a company budgeted $120,000 for a particular production activity.
Actual cost was $129,000.
Apply the formula:
Cost Variance = $129,000 − $120,000 = $9,000
Actual cost exceeded budget by $9,000.
Using the Actual Cost − Budgeted Cost convention, this is:
$9,000 Unfavorable
Now suppose actual cost had been $114,000:
Cost Variance = $114,000 − $120,000 = −$6,000
The negative result indicates:
$6,000 Favorable
The direction matters as much as the numerical amount.
Cost Variance Percentage Formula
A percentage can make variances easier to compare across departments or periods of different sizes.
A common calculation is:
Cost Variance % = (Actual Cost − Expected Cost) ÷ Expected Cost × 100
Using the $129,000 actual cost and $120,000 benchmark:
Cost Variance % = ($129,000 − $120,000) ÷ $120,000 × 100
Cost Variance % = $9,000 ÷ $120,000 × 100 = 7.5%
Costs were therefore 7.5% above the benchmark.
If management reports favorable and unfavorable values without signs, this would normally be described as a 7.5% unfavorable cost variance.
Cost Variance Per Unit
Cost variance can also be analyzed on a unit basis.
Suppose the expected cost of a product is $24 per unit and actual cost becomes $25.50.
Unit Cost Variance = $25.50 − $24.00 = $1.50 Unfavorable per Unit
If 8,000 comparable units are involved:
Total Cost Variance = $1.50 × 8,000 = $12,000 Unfavorable
This helps distinguish a small unit-level cost problem from its potentially significant total financial effect.
Favorable vs. Unfavorable Cost Variance
A favorable cost variance occurs when actual comparable cost is lower than the benchmark.
An unfavorable cost variance occurs when actual comparable cost is higher.
However, favorable does not automatically mean economically better.
Suppose labor cost is below budget because a production department used fewer experienced workers. If the change produces more defects, delayed orders, or warranty claims, the apparent cost saving may create larger problems elsewhere.
Similarly, an unfavorable variance can arise from a deliberate decision to purchase higher-quality materials that reduce failures or increase selling prices.
Variance analysis should therefore identify the cause and consequence, not simply label the number.
Example With Standard Cost and Actual Production
Assume a business expects a particular product to cost $18 per unit.
During the month it produces 10,000 units.
Expected comparable cost is:
Expected Cost = 10,000 × $18 = $180,000
Actual cost is $189,000.
Cost variance is:
Cost Variance = $189,000 − $180,000 = $9,000 Unfavorable
The actual cost per unit is:
Actual Unit Cost = $189,000 ÷ 10,000 = $18.90
Unit cost variance is:
Unit Cost Variance = $18.90 − $18.00 = $0.90 Unfavorable
The total can be verified:
$0.90 × 10,000 = $9,000 Unfavorable
The unit and total calculations reconcile.
Why Comparable Activity Levels Matter
One of the biggest mistakes in cost variance analysis is comparing actual cost with a budget based on a different activity level.
Suppose the original monthly budget assumed:
- 10,000 units;
- variable cost of $6 per unit; and
- fixed cost of $30,000.
The original budget is:
Budgeted Cost = (10,000 × $6) + $30,000 = $90,000
Now assume actual production is 12,000 units and actual total cost is $105,000.
A simple comparison with the original budget gives:
$105,000 − $90,000 = $15,000 Unfavorable
But the company produced 2,000 more units than planned.
At 12,000 units, the expected cost based on the original cost behavior would be:
Adjusted Expected Cost = (12,000 × $6) + $30,000 = $102,000
The more comparable variance is therefore:
Adjusted Cost Variance = $105,000 − $102,000 = $3,000 Unfavorable
The company did spend $15,000 more than its original budget, but only $3,000 of that difference remains after accounting for the higher production volume.
This is why cost behavior matters when interpreting variances.
Cost Variance vs. Budget Variance
A budget variance broadly compares actual results with budgeted amounts.
Cost variance is narrower: it focuses specifically on differences in costs.
A company’s budget variance analysis may include revenue, costs, profit, cash requirements, or other budgeted measures. Cost variance isolates the expense side.
For example, if revenue is $30,000 above budget while costs are $10,000 above budget, there are at least two separate deviations to understand.
The $10,000 cost difference can be investigated as a cost variance without taking ownership of the broader budget-performance analysis.
Cost Variance vs. Forecast Variance
A budget often represents an approved financial plan, while a forecast can be updated as new information becomes available.
A forecast variance therefore compares actual or updated results with a forecast benchmark rather than necessarily with the original budget.
For example, a business might begin the year budgeting raw-material cost at $50 per unit, revise its forecast to $55 after supplier increases, and ultimately pay $57.
Different comparisons answer different questions:
- $57 versus $50 measures deviation from the original budget assumption.
- $57 versus $55 measures deviation from the revised forecast.
Cost variance should always identify which benchmark is being used.
Cost Variance vs. Price Variance
A total cost difference can arise for several reasons. One is that the price paid for an input differs from the expected price.
That narrower effect is addressed by price variance.
Cost variance remains the broader cost comparison. It should not automatically be interpreted as a purchasing-price problem because changes in usage, production volume, efficiency, mix, waste, or other factors can also affect total cost.
For example, actual material cost can exceed expectations even when the purchase price per unit is unchanged if the company uses more material than expected.
Cost Variance and Cost of Goods Sold
Variances in product-related costs can ultimately influence cost of goods sold, inventory values, and gross profit depending on the nature of the costs and the accounting treatment applied.
Suppose a company expected the goods sold during a period to carry a cost of $400,000 but comparable actual product costs are higher.
If those higher costs are assigned to the goods sold, COGS can increase and gross profit can decline.
However, a managerial cost variance and financial-statement COGS are not the same measure. One compares actual cost with a benchmark; the other reports product cost associated with goods sold.
How Cost Variance Affects Contribution Margin
A cost increase can also affect the contribution margin ratio when the cost involved is variable.
Suppose a product sells for $50 and expected variable cost is $30.
Expected contribution margin is:
Contribution Margin = $50 − $30 = $20
Expected contribution margin ratio is:
Contribution Margin Ratio = $20 ÷ $50 × 100 = 40%
Now assume variable cost rises to $33.
New contribution margin is:
$50 − $33 = $17
New contribution margin ratio is:
$17 ÷ $50 × 100 = 34%
The unfavorable variable-cost change has reduced the contribution margin ratio from 40% to 34%.
A cost variance can therefore have direct pricing and profitability implications even though the two metrics answer different questions.
Fixed and Variable Costs Require Different Interpretation
The source of a variance matters because variable costs and fixed costs behave differently as activity changes.
A $20,000 increase in total variable cost may be expected if output increased sharply.
A $20,000 increase in a normally fixed cost may require a different explanation, such as a contractual change, step cost, new facility, or reclassification.
Comparing costs without understanding their behavior can create false conclusions about operational performance.
Depreciation Expense Can Create Cost Variances
Depreciation expense can differ from budget because of asset purchases, disposals, revised timing assumptions, changes in depreciation schedules, or other accounting factors.
Suppose monthly depreciation was budgeted at $15,000 but actual depreciation is $17,000.
Using the same variance convention:
Depreciation Cost Variance = $17,000 − $15,000 = $2,000 Unfavorable
That $2,000 difference is an accounting expense variance, but it does not mean the company paid an additional $2,000 in cash during that month.
Cost Variance Is Not the Same as Cash Variance
Costs can be recognized at a different time from their related cash payments.
The cash flow statement tracks cash movements. Cost variance tracks differences between actual recognized costs and a chosen cost benchmark.
For example, a supplier can invoice a business $25,000 in December while payment is due in January.
The cost may affect management’s December cost analysis even though the related cash outflow occurs later.
Confusing cost variance with cash movement can therefore distort liquidity analysis.
Cost Variances and Debit and Credit Entries
A cost variance is an analytical difference, but underlying transactions still enter the accounting system through debit and credit entries.
Organizations using standard costing may also maintain variance accounts or other mechanisms for reconciling standard and actual costs.
The precise entries depend on the accounting system and type of variance, so the analytical formula should not be treated as a universal journal-entry template.
The important point is that variance analysis explains differences; bookkeeping records the underlying transactions.
How to Investigate an Unfavorable Cost Variance
A useful investigation begins with the largest and most controllable differences.
Suppose total manufacturing cost is $50,000 above the comparable benchmark. Rather than stopping at the aggregate number, management can examine whether the difference arose from input prices, usage, labor efficiency, overtime, waste, production volume, freight, maintenance, or another cost driver.
The sequence is usually:
Measure the variance → confirm comparability → identify the driver → determine whether it is recurring → decide whether action is needed.
This produces a more useful answer than simply stating that costs exceeded budget.
Materiality Matters
Not every variance deserves the same level of investigation.
A $500 variance may be significant for a small cost center but immaterial for a department spending millions of dollars.
Percentage analysis can help.
Suppose Department A has:
$5,000 variance ÷ $50,000 expected cost = 10% unfavorable
Department B has:
$20,000 variance ÷ $2,000,000 expected cost = 1% unfavorable
Department B has the larger dollar variance, but Department A has the much larger percentage deviation.
Good cost control considers both magnitude and context.
Recurring vs. One-Time Variances
A one-time unfavorable variance may result from an unusual repair, temporary supplier disruption, emergency freight charge, or other nonrecurring event.
A smaller variance that appears every month can be more important because it may indicate an outdated standard, persistent inefficiency, or structural cost increase.
Trend analysis therefore improves cost variance interpretation.
For example:
| Month | Expected Cost | Actual Cost | Variance |
|---|---|---|---|
| January | $100,000 | $103,000 | $3,000 U |
| February | $102,000 | $106,000 | $4,000 U |
| March | $101,000 | $106,000 | $5,000 U |
The growing unfavorable pattern is more informative than any single month’s result.
Cost Variance and Financial Statements
Cost variances can eventually affect reported expenses, inventory, margins, and net income, depending on what caused the difference and how it is accounted for.
However, the variance itself is primarily an analytical tool.
The income statement reports recognized revenue and expenses. Cost variance analysis compares actual costs with a management benchmark to explain performance.
Keeping those purposes distinct prevents an internal performance measure from being confused with a financial-statement line item.
Common Cost Variance Mistakes
A common error is comparing costs from different activity levels without adjustment.
Another is assuming every favorable variance represents operational improvement. Cutting maintenance, training, quality control, or necessary staffing may create short-term savings with long-term costs.
Businesses also make mistakes when they compare actual costs against outdated standards. If the benchmark no longer reflects realistic market prices or operating conditions, the variance can become less informative.
Another error is focusing only on percentage variance. A small percentage applied to a very large cost base can still represent a material amount.
Finally, cost variance should not be used to assign blame automatically. The purpose is to identify drivers and improve decisions.
Frequently Asked Questions
What is cost variance in simple terms?
Cost variance is the difference between what something actually cost and what it was expected, budgeted, or standardized to cost.
What is the cost variance formula?
Using the convention adopted in this article:
Cost Variance = Actual Cost − Expected Cost
A positive result indicates an unfavorable variance, while a negative result indicates a favorable variance.
What does a favorable cost variance mean?
A favorable cost variance means actual comparable cost was below the benchmark.
For example, spending $47,000 against an expected $50,000 produces a $3,000 favorable variance.
What does an unfavorable cost variance mean?
An unfavorable variance means actual cost exceeded the benchmark.
If actual cost is $108,000 and expected cost is $100,000:
Cost Variance = $108,000 − $100,000 = $8,000 Unfavorable
How do you calculate cost variance percentage?
A common formula is:
Cost Variance % = (Actual Cost − Expected Cost) ÷ Expected Cost × 100
The sign and favorable/unfavorable label should be interpreted consistently with the reporting convention being used.
Can a favorable variance be bad?
Yes.
A cost can fall below budget because of actions that harm quality, service, maintenance, employee capacity, or future performance.
The cause of the variance matters more than the label alone.
Why should cost variance be adjusted for production volume?
Many costs change when activity changes.
Comparing the cost of producing 12,000 units with a budget designed for 10,000 units can make normal volume-related spending appear unfavorable. A comparable benchmark gives a more meaningful result.
Is cost variance the same as price variance?
No.
Price variance isolates the effect of paying a different price for an input. Cost variance is broader and can reflect price, usage, volume, efficiency, mix, and other factors.
Is cost variance the same as budget variance?
Not exactly.
Budget variance can cover many budgeted measures, including revenue and profit. Cost variance specifically focuses on differences in costs.
Does an unfavorable cost variance mean cash flow declined by the same amount?
Not necessarily.
Expense recognition and cash payment timing can differ, and some cost variances—such as depreciation differences—may involve noncash expenses.
Should every cost variance be investigated?
Not necessarily.
Businesses generally prioritize variances based on materiality, recurrence, controllability, trend, and potential economic impact rather than treating every small difference as equally important.




