


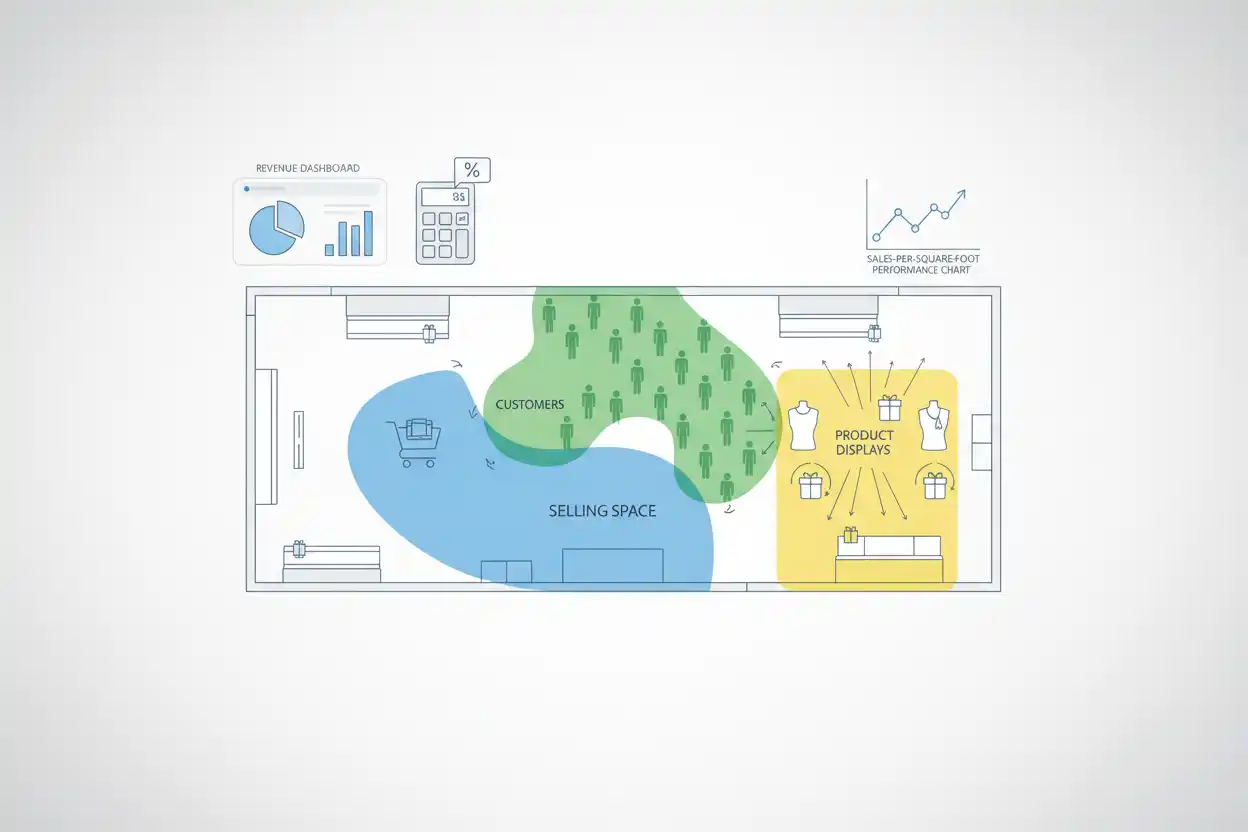
Sales per square foot measures how much sales revenue a physical retail location generates relative to its selling area. It is commonly used to compare store productivity, evaluate space utilization, analyze layouts, and track whether a location is generating more or less sales from the space available.
If a 6,000-square-foot store generates $1.8 million of annual sales:
Sales Per Square Foot = Sales Revenue ÷ Selling Area in Square Feet
Sales Per Square Foot = $1,800,000 ÷ 6,000 = $300
The store generates $300 of annual sales per square foot.
The metric is most useful when the revenue period and area definition are consistent. Comparing one store’s selling area with another store’s total building area can produce misleading results.
What Is Sales Per Square Foot?
Sales per square foot is a retail space-productivity ratio.
It answers:
How much sales revenue does the store generate for each square foot of selling space?
A store with higher sales per square foot generates more sales from the same amount of physical selling area.
For example:
Store A:
$2,000,000 Sales ÷ 10,000 Square Feet = $200 per Square Foot
Store B:
$1,500,000 Sales ÷ 5,000 Square Feet = $300 per Square Foot
Store A generates more total revenue.
Store B generates more revenue relative to its floor space.
The two measures answer different questions: scale versus space productivity.
Sales Per Square Foot Formula
The basic formula is:
Sales Per Square Foot = Sales Revenue ÷ Selling Area in Square Feet
Where:
Sales revenue is the revenue generated by the location for the measurement period.
Selling area is the square footage defined as the retail space used in the company’s calculation.
Suppose:
Annual Store Revenue = $4,500,000
Selling Area = 15,000 Square Feet
Then:
Sales Per Square Foot = $4,500,000 ÷ 15,000
Sales Per Square Foot = $300
The store generates $300 of annual sales for every square foot of measured selling area.
Sales Per Square Foot Example
Assume two retail locations:
| Store | Annual Sales | Selling Area | Sales per Sq. Ft. |
|---|---|---|---|
| Store A | $3,000,000 | 12,000 sq. ft. | $250 |
| Store B | $2,400,000 | 8,000 sq. ft. | $300 |
Store A:
$3,000,000 ÷ 12,000 = $250
Store B:
$2,400,000 ÷ 8,000 = $300
Store A produces $600,000 more annual revenue.
Store B produces $50 more sales per square foot.
Management may therefore view Store A as the larger location but Store B as the more productive use of selling area.
Which Square Footage Should Be Used?
The denominator is critical.
A retailer might distinguish between:
- customer selling space;
- storage areas;
- offices;
- employee areas;
- loading facilities; and
- total building area.
If the company defines the metric using selling space, that same definition should be applied to every location being compared.
Suppose a store occupies 10,000 total square feet, but only 7,500 square feet are selling space.
Annual revenue is $2.25 million.
Using selling area:
$2,250,000 ÷ 7,500 = $300 per Square Foot
Using total building area:
$2,250,000 ÷ 10,000 = $225 per Square Foot
Both calculations are mathematically correct, but they measure different things.
Consistency is essential.
Monthly Sales Per Square Foot
The ratio can be calculated for any consistent period.
Suppose a 5,000-square-foot store generates $150,000 of sales during April.
Monthly Sales Per Square Foot = $150,000 ÷ 5,000
Monthly Sales Per Square Foot = $30
The location generated $30 per square foot during April.
Annualizing the number by simply multiplying by 12 may be misleading if the business is seasonal.
It is usually better to use actual annual sales when evaluating annual space productivity.
Quarterly Sales Per Square Foot
Suppose quarterly sales are:
$900,000
Selling area is:
10,000 Square Feet
Quarterly sales per square foot:
$900,000 ÷ 10,000 = $90
If the same store generates $1.4 million during a holiday quarter:
$1,400,000 ÷ 10,000 = $140
The increase could reflect seasonality rather than a permanent improvement in store productivity.
Comparable periods should therefore be used when analyzing trends.
Sales Per Square Foot Growth
Changes in the ratio can be measured as:
Growth % = (New Sales per Sq. Ft. − Old Sales per Sq. Ft.) ÷ Old Sales per Sq. Ft. × 100
Suppose a store improves from $250 to $290 per square foot.
Increase:
$290 − $250 = $40
Percentage improvement:
$40 ÷ $250 × 100 = 16%
Sales per square foot increased by 16%.
The change could result from more customer traffic, higher conversion, higher selling prices, better product mix, improved inventory availability, more productive merchandising, or several factors at once.
Revenue Growth With Constant Store Area
When store area remains unchanged, sales growth translates directly into higher sales per square foot.
Suppose a 10,000-square-foot store increases annual revenue from $2.5 million to $3 million.
Original:
$2,500,000 ÷ 10,000 = $250 per Sq. Ft.
New:
$3,000,000 ÷ 10,000 = $300 per Sq. Ft.
Improvement:
($300 − $250) ÷ $250 × 100 = 20%
Revenue grew 20%, and because square footage was unchanged, sales per square foot also increased 20%.
Store Expansion Can Reduce Sales Per Square Foot
More space does not automatically create proportionally more sales.
Suppose a store generates:
$3,000,000 from 10,000 Square Feet
Current sales per square foot:
$300
The store expands to 15,000 square feet and revenue increases to $3.6 million.
New sales per square foot:
$3,600,000 ÷ 15,000 = $240
Revenue increased 20%, but selling area increased 50%.
Space productivity fell from $300 to $240 per square foot.
The expansion may still be worthwhile if it improves profit, customer experience, future growth, or inventory capacity, but the ratio shows that the added space is generating less revenue per square foot than the original footprint.
Smaller Stores Can Have Higher Sales Density
A small location can generate a high sales-per-square-foot figure because limited space is intensively used.
Suppose:
Store A:
$1.5M ÷ 3,000 Sq. Ft. = $500 per Sq. Ft.
Store B:
$4M ÷ 20,000 Sq. Ft. = $200 per Sq. Ft.
Store A has much greater sales density despite substantially lower total revenue.
This does not prove Store A is more profitable.
Its rent per square foot may be higher, staffing may be expensive, product margins may differ, or inventory constraints may limit future growth.
Sales Per Square Foot vs. Revenue Per Employee
Revenue per employee measures revenue relative to workforce size.
Sales per square foot measures sales relative to retail space.
A store can perform well on one and poorly on the other.
Suppose revenue is $2 million.
The store has:
10 Employees
and:
10,000 Square Feet
Revenue per employee:
$2,000,000 ÷ 10 = $200,000
Sales per square foot:
$2,000,000 ÷ 10,000 = $200
If the store reduces staff to eight employees without losing sales:
Revenue Per Employee = $250,000
Sales per square foot remains $200 because store area did not change.
The metrics isolate different operating resources.
Sales Per Square Foot and Labor Productivity
Labor productivity can affect store sales without changing the physical footprint.
Suppose improved staffing and checkout processes allow a store to serve more customers during peak hours.
Annual sales rise from $2 million to $2.2 million while selling area remains 8,000 square feet.
Original:
$2,000,000 ÷ 8,000 = $250
New:
$2,200,000 ÷ 8,000 = $275
Sales per square foot improves 10%.
The floor space did not become larger. The operating system generated more sales from the existing space.
Sales Per Square Foot and Inventory
Retail space cannot generate sales if the required inventory is consistently unavailable.
Suppose a store has excellent customer traffic but frequently runs out of popular products.
The sales-per-square-foot ratio can remain below its potential because customers cannot complete purchases.
Improving replenishment can therefore increase space productivity even without changing store layout.
On the other hand, crowding excessive inventory into customer areas can reduce shopping convenience and damage merchandising effectiveness.
Inventory quantity and space productivity need to be balanced.
Safety Stock and Store Productivity
Safety stock can support sales per square foot by protecting product availability during demand spikes or supplier delays.
Suppose a 5,000-square-foot store generates $1.5 million annually:
Sales Per Square Foot = $300
Improved safety-stock settings reduce lost sales and raise annual revenue to $1.6 million.
$1,600,000 ÷ 5,000 = $320
The ratio increases by:
($320 − $300) ÷ $300 × 100 ≈ 6.67%
The improvement came from better availability rather than additional physical space.
Excess safety stock can create the opposite problem if storage and markdown costs become too high.
Sales Per Square Foot and Reorder Point
A properly calibrated reorder point helps replenish products before stockouts reduce completed sales.
Suppose a store’s best-selling category repeatedly runs out for several days each month.
If better reorder timing allows the business to fulfill an additional $100,000 of annual sales in a 10,000-square-foot location:
Additional Sales Per Square Foot = $100,000 ÷ 10,000
Additional Sales Per Square Foot = $10
The store’s space productivity improves by $10 per square foot without changing its size.
Sales Per Square Foot and Inventory Carrying Cost
A retailer can sometimes increase sales per square foot by stocking more products, but additional inventory has a financial cost.
Inventory carrying cost can include storage, financing, insurance, shrinkage, obsolescence, and other costs associated with maintaining stock.
Suppose adding $200,000 of average inventory increases annual sales by $250,000.
The sales increase may look attractive.
But if carrying costs, markdowns, and shrinkage associated with the extra stock consume most of the incremental gross profit, the strategy may not improve overall economics.
Sales density should therefore be evaluated alongside inventory efficiency.
Sales Per Square Foot and Inventory Turnover
Two stores can have identical sales per square foot but very different inventory turnover.
Suppose both generate $300 of annual sales per square foot.
Store A achieves this with lean inventory replenished frequently.
Store B maintains very large inventory balances to support the same sales.
Store A can potentially generate the same space productivity with much less capital tied up in stock.
Sales per square foot evaluates floor-space efficiency; inventory turnover evaluates the relationship between inventory and the cost of goods sold.
Both reveal different aspects of retail performance.
Sales Per Square Foot and Gross Margin
Sales density does not measure profitability.
Suppose Store A generates:
$400 Sales per Square Foot
with a 20% gross margin.
Approximate gross profit per square foot:
$400 × 20% = $80
Store B generates:
$300 Sales per Square Foot
with a 40% gross margin.
Approximate gross profit per square foot:
$300 × 40% = $120
Store A has higher sales per square foot, but Store B generates more gross profit per square foot.
This is why sales density should not be used as a substitute for profitability.
Sales Per Square Foot and Net Margin
The same issue applies to net margin.
A store can generate high sales density but have expensive rent, heavy staffing, large advertising costs, shrinkage, or other expenses.
Suppose:
Store A:
Sales Per Square Foot = $500
Net Margin = 2%
Approximate net income per square foot:
$500 × 2% = $10
Store B:
Sales Per Square Foot = $300
Net Margin = 8%
Approximate net income per square foot:
$300 × 8% = $24
Store B generates less revenue from each square foot but substantially more bottom-line profit per square foot in this simplified comparison.
Sales Per Square Foot and Operating Expenses
Retail space creates operating expenses such as rent, utilities, cleaning, security, staffing, maintenance, and insurance.
A larger store can therefore require materially more revenue simply to cover its cost structure.
Suppose expanding by 5,000 square feet adds $150,000 of annual operating expenses.
If the additional space produces only $100,000 of incremental gross profit:
Incremental Operating Effect = $100,000 − $150,000 = −$50,000
The expansion increases sales capacity but reduces operating profit by $50,000 in this simplified example.
Space productivity should therefore be connected to the economics of occupying that space.
Sales Per Square Foot and Operating Income
Operating income can improve when greater sales density produces additional gross profit without a proportional increase in store operating costs.
Suppose a store increases annual sales by $300,000 using the same footprint.
The incremental gross margin on those sales is 35%.
Additional gross profit:
$300,000 × 35% = $105,000
If incremental operating expenses are only $25,000:
Incremental Operating Income = $105,000 − $25,000 = $80,000
Increasing sales per square foot can therefore create substantial operating leverage when the store’s fixed cost base is already in place.
Sales Per Square Foot and Unit Cost
Unit cost matters because the same level of sales can produce very different economics depending on product cost.
Suppose two stores each generate $2 million of annual sales from identical 10,000-square-foot spaces.
Both report:
Sales Per Square Foot = $200
But Store A’s average product costs are much lower relative to selling prices than Store B’s.
Store A can therefore have significantly higher gross and operating profit even though both stores show the same sales density.
Sales per square foot measures space productivity, not product cost efficiency.
Sales Per Square Foot and Revenue Mix
Product mix can materially affect the metric.
Suppose a store sells fewer units but shifts toward higher-priced products.
Original:
Revenue = $2M
Area = 10,000 Sq. Ft.
Sales Per Square Foot = $200
After the mix shift:
Revenue = $2.5M
Same Area = 10,000 Sq. Ft.
Sales Per Square Foot = $250
The ratio improves 25%.
Physical unit volume may not have increased at all.
Like revenue per employee, sales per square foot is influenced by prices and product mix as well as operational productivity.
Comparing Departments Within a Store
Retailers can calculate sales density for individual departments when reliable sales and area data exist.
Suppose:
| Department | Sales | Area | Sales per Sq. Ft. |
|---|---|---|---|
| Electronics | $1,200,000 | 2,000 | $600 |
| Home | $900,000 | 3,000 | $300 |
| Apparel | $1,000,000 | 4,000 | $250 |
Electronics has the highest sales density.
That does not automatically mean management should give electronics all available space.
Different departments have different margins, inventory requirements, display needs, customer-traffic roles, and strategic importance.
Space allocation should consider total economics.
Reallocating Store Space
Suppose a store moves 1,000 square feet from a low-productivity category generating $150 per square foot to a category that can sustain $450 per square foot.
Potential annual sales difference is:
($450 − $150) × 1,000
$300 × 1,000 = $300,000
If customer behavior and category capacity support the change, reallocating the space could add approximately $300,000 in annual sales.
The real result may differ if moving one department changes traffic patterns or causes the higher-performing category’s productivity to decline as it receives more area.
Expansion Decision Example
Suppose a retailer is considering expanding a 5,000-square-foot store to 7,000 square feet.
Current annual sales:
$2,000,000
Current sales per square foot:
$2,000,000 ÷ 5,000 = $400
Management expects annual sales after expansion to reach $2.5 million.
Projected sales per square foot:
$2,500,000 ÷ 7,000 ≈ $357.14
Total sales increase $500,000, but sales density declines about 10.7%.
That does not mean the expansion should be rejected.
Management needs to compare the incremental gross profit with rent, construction, labor, inventory, and other additional costs.
Store Consolidation Example
The metric can also help evaluate downsizing.
Suppose a 20,000-square-foot store generates $4 million annually:
$200 per Square Foot
Management believes the store can reduce its selling area to 15,000 square feet while retaining $3.8 million of sales.
Projected result:
$3,800,000 ÷ 15,000 ≈ $253.33 per Square Foot
Sales density rises materially even though total revenue falls slightly.
If occupancy and operating cost savings exceed the profit lost from the $200,000 sales decline, consolidation could improve overall economics.
Sales Per Square Foot and Seasonal Retail
Seasonality can make short-period comparisons misleading.
Suppose a store generates:
$80 per Square Foot in Q1
and:
$180 per Square Foot in Q4
The higher Q4 figure may be normal for a holiday-driven retailer rather than evidence that Q1 management was ineffective.
Year-over-year comparisons for the same period are often more meaningful than comparing adjacent seasonal quarters.
The denominator should also remain unchanged or be adjusted if the store was remodeled.
Online Sales and Physical Stores
Sales per square foot becomes more complicated when stores contribute to online orders.
A physical location may operate as a showroom, pickup site, return center, or local fulfillment point.
If an online transaction is attributed entirely to an e-commerce channel even though the store played an important role, traditional store sales per square foot can understate the economic contribution of the location.
Conversely, assigning every nearby online sale to the store can overstate physical sales productivity.
Retailers need consistent attribution rules when combining digital and physical channels.
Trial Balance and Store Sales Data
Sales per square foot is a management ratio rather than an account in the general ledger.
The underlying sales recorded through accounting eventually appear within the company’s trial balance and financial statements.
The square-foot denominator usually comes from operational or property records rather than accounting entries.
A reliable calculation therefore combines accurate revenue data with accurate store-area data.
If either source is inconsistent, the ratio can be misleading even though the arithmetic is correct.
Sales Per Square Foot Trend Example
Suppose a store reports:
| Year | Annual Sales | Selling Area | Sales per Sq. Ft. |
|---|---|---|---|
| Year 1 | $2.0M | 8,000 | $250 |
| Year 2 | $2.2M | 8,000 | $275 |
| Year 3 | $2.56M | 8,000 | $320 |
From Year 1 to Year 3:
Increase = $320 − $250 = $70
Percentage improvement:
$70 ÷ $250 × 100 = 28%
Because store area did not change, the improvement reflects higher revenue generation from the existing footprint.
The next analytical step is identifying whether the gain came from traffic, pricing, conversion, inventory, product mix, merchandising, or another factor.
What Is a Good Sales Per Square Foot?
There is no universal benchmark.
Appropriate levels vary substantially by retail format.
A luxury retailer, supermarket, furniture store, warehouse club, jewelry shop, pharmacy, and large department store use space differently.
A high figure is therefore most meaningful when compared with:
- the same store over time;
- comparable locations within the same chain;
- similar retail formats; and
- planned store economics.
Comparing fundamentally different formats can create conclusions with little operational value.
How to Improve Sales Per Square Foot
The ratio can improve through higher customer traffic, better conversion, stronger pricing, improved merchandising, more productive product mix, better inventory availability, faster replenishment, stronger staff performance, or removal of underused selling space.
The objective should not simply be to fit more products into less space.
Overcrowding can hurt the customer experience and reduce sales.
Likewise, eliminating low-sales areas can be counterproductive when those categories attract traffic or support higher-margin purchases elsewhere.
Sustainable improvements come from better utilization of the store rather than maximizing one ratio at the expense of the overall retail model.
Common Sales Per Square Foot Mistakes
A common mistake is using inconsistent square-foot definitions across locations.
Another is comparing annual sales at one store with monthly sales at another.
Businesses can also interpret higher sales density as proof of higher profitability even when gross margins or occupancy costs differ.
Another mistake is ignoring online attribution in an omnichannel retail model.
Seasonality, store maturity, renovations, temporary closures, and product mix can also distort comparisons.
Finally, a smaller store can mechanically produce higher sales per square foot while generating less total revenue, so both scale and productivity should be considered.
Frequently Asked Questions
What is sales per square foot in simple terms?
Sales per square foot measures how much sales revenue a physical retail location generates for each square foot of measured selling space.
What is the sales per square foot formula?
Sales Per Square Foot = Sales Revenue ÷ Selling Area in Square Feet
How do you calculate sales per square foot?
If annual revenue is $3 million and selling area is 10,000 square feet:
$3,000,000 ÷ 10,000 = $300 per Square Foot
Is higher sales per square foot always better?
Not necessarily.
Higher sales density can be positive, but profitability also depends on product margins, rent, staffing, inventory, operating costs, and capital requirements.
Should storage space be included?
That depends on the company’s definition.
If the ratio is based on customer selling area, storage should generally be excluded. Whatever definition is chosen should be applied consistently.
Can a small store have higher sales per square foot than a large store?
Yes.
A smaller store can generate less total revenue but use its limited selling area more intensively.
Can revenue increase while sales per square foot falls?
Yes.
If store area expands faster than revenue, sales per square foot can decline even though total sales increase.
Can sales per square foot increase while total revenue falls?
Yes.
If a store reduces its selling area proportionally more than sales decline, the remaining space can generate a higher ratio.
Is sales per square foot the same as revenue per employee?
No.
Sales per square foot measures productivity relative to physical retail space.
Revenue per employee measures revenue relative to workforce size.
Does inventory availability affect sales per square foot?
Yes.
Repeated stockouts can reduce completed sales even when customer demand and store traffic are strong.
Does safety stock affect sales per square foot?
It can indirectly.
Appropriate safety stock can improve product availability and protect sales, while excessive stock can increase carrying costs and create space inefficiency.
Is sales per square foot a profitability ratio?
No.
It measures sales productivity of physical space. A store with high sales per square foot can still have weak profit margins.
Can sales per square foot be calculated monthly?
Yes.
Use monthly sales divided by the same defined selling area. Be careful when comparing seasonal periods.
Why is selling-area consistency important?
Using total building area for one store and customer selling area for another changes the denominator and makes the results incomparable.
What is a good sales per square foot?
There is no universal target. The most useful benchmarks are usually the store’s own historical results and genuinely comparable locations operating under similar retail formats.




