


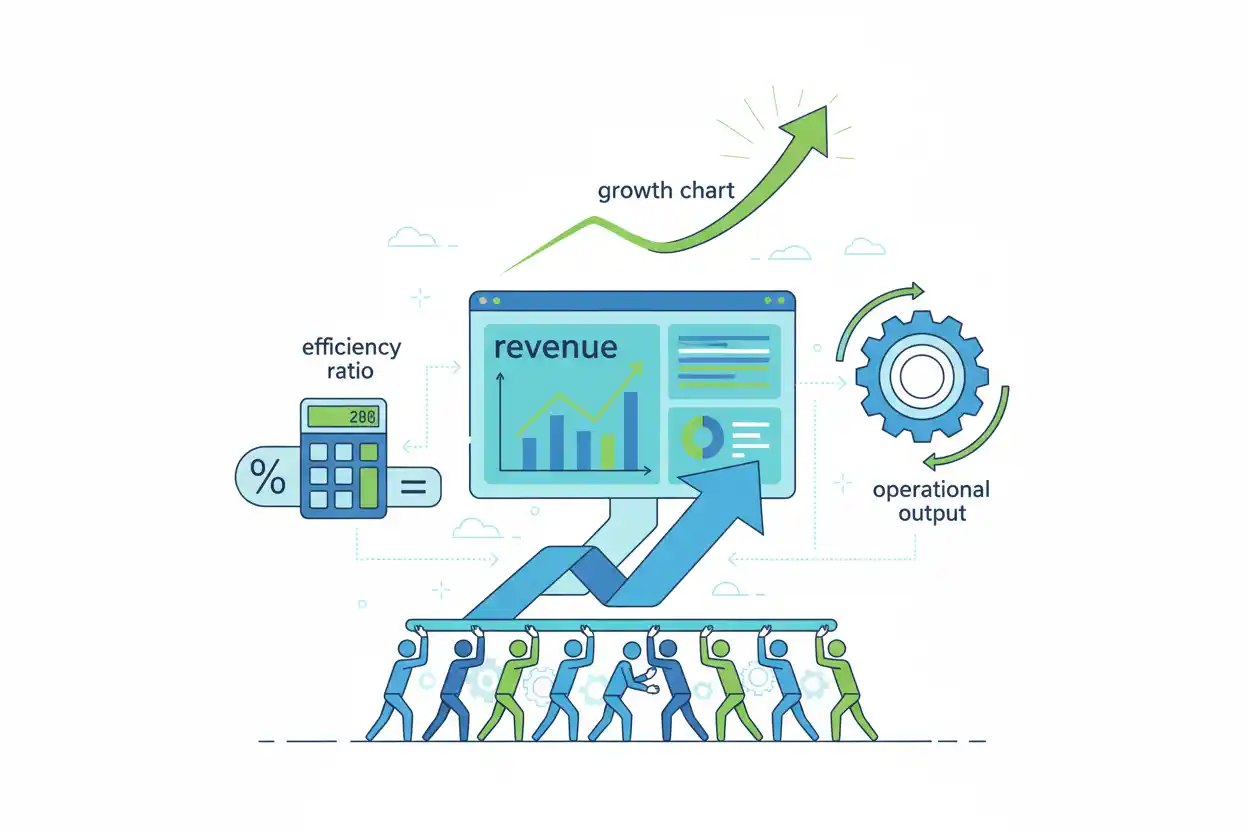
Revenue per employee measures how much company revenue is generated relative to the size of its workforce. It is commonly used as a high-level indicator of organizational productivity, operating scale, and labor efficiency.
If a company generates $12 million of annual revenue with an average workforce of 100 employees, its revenue per employee is $120,000.
Revenue Per Employee = Total Revenue ÷ Average Number of Employees
Revenue Per Employee = $12,000,000 ÷ 100 = $120,000
The result does not mean each employee personally sold $120,000. It distributes company-wide revenue across the workforce to create a comparable efficiency measure.
What Is Revenue Per Employee?
Revenue per employee compares business scale with labor headcount.
The metric answers:
How much revenue does the company generate for each employee represented in its workforce?
Suppose two companies both employ 200 people.
Company A generates $20 million of annual revenue.
Company B generates $40 million.
Company A:
$20,000,000 ÷ 200 = $100,000 per Employee
Company B:
$40,000,000 ÷ 200 = $200,000 per Employee
Company B generates twice as much revenue for the same employee count.
That does not automatically make Company B more profitable or better managed, but it shows that its revenue scale relative to headcount is substantially higher.
Revenue Per Employee Formula
The standard formula is:
Revenue Per Employee = Total Revenue ÷ Average Number of Employees
Using average employee count is generally more representative than using only the year-end workforce when staffing changed materially during the period.
A simple average is:
Average Employees = (Beginning Employees + Ending Employees) ÷ 2
Suppose the business begins the year with 80 employees and ends with 120.
Average Employees = (80 + 120) ÷ 2 = 100
If annual revenue is $15 million:
Revenue Per Employee = $15,000,000 ÷ 100
Revenue Per Employee = $150,000
Revenue Per Employee Example
Assume a software company reports:
- Annual revenue: $24 million
- Beginning employees: 180
- Ending employees: 220
Average workforce:
Average Employees = (180 + 220) ÷ 2
Average Employees = 200
Revenue per employee:
$24,000,000 ÷ 200 = $120,000
The business generated approximately $120,000 of revenue per average employee.
Why Use Average Employee Count?
Using only ending headcount can distort the metric during rapid hiring or downsizing.
Suppose a company starts with 50 employees and gradually expands to 150 by year-end.
Annual revenue is $20 million.
Using ending headcount:
$20,000,000 ÷ 150 ≈ $133,333
Using a simple average:
Average Employees = (50 + 150) ÷ 2 = 100
$20,000,000 ÷ 100 = $200,000
The difference is substantial.
If hiring occurred unevenly throughout the year, monthly or quarterly average headcount can be even more accurate than the simple two-point average.
Monthly Average Employee Example
Suppose quarterly average headcount is:
- Q1: 100
- Q2: 110
- Q3: 130
- Q4: 140
Annual average:
(100 + 110 + 130 + 140) ÷ 4 = 120 Employees
If annual revenue is $18 million:
Revenue Per Employee = $18,000,000 ÷ 120
Revenue Per Employee = $150,000
This is generally more representative than dividing by the year-end 140 employees.
Revenue Per Employee Growth
Changes in the metric can be calculated as:
Revenue Per Employee Growth % = (New Revenue Per Employee − Old Revenue Per Employee) ÷ Old Revenue Per Employee × 100
Suppose revenue per employee rises from $100,000 to $125,000.
Increase:
$125,000 − $100,000 = $25,000
Growth:
$25,000 ÷ $100,000 × 100 = 25%
Revenue per employee improved by 25%.
The next step is understanding why.
The improvement could result from stronger employee productivity, better pricing, automation, outsourcing, product mix, faster demand growth than hiring, or some combination.
Revenue Growth Faster Than Headcount
Revenue per employee generally rises when revenue grows faster than workforce size.
Suppose:
Year 1
Revenue = $10,000,000
Employees = 100
Revenue Per Employee = $100,000
Year 2
Revenue grows to:
$15,000,000
Employees increase to:
120
New revenue per employee:
$15,000,000 ÷ 120 = $125,000
Revenue increased by 50%, while employee count increased by 20%.
Revenue per employee therefore rises 25%.
The company is supporting more revenue for each employee.
Headcount Growth Faster Than Revenue
The opposite occurs when employee growth outpaces revenue.
Suppose:
Year 1
Revenue = $20,000,000
Employees = 200
Revenue Per Employee = $100,000
Year 2
Revenue = $22,000,000
Employees = 250
Revenue per employee becomes:
$22,000,000 ÷ 250 = $88,000
The company’s revenue grew by 10%, but headcount grew 25%.
Revenue per employee declined by:
($88,000 − $100,000) ÷ $100,000 × 100 = −12%
This may signal inefficient hiring, but it can also reflect investment ahead of future growth.
Hiring Ahead of Revenue
A declining revenue per employee figure is not necessarily negative when the company is deliberately building capacity.
Suppose a business expects to launch a major new product next year and hires engineers, salespeople, and support staff in advance.
Current-year revenue may not yet include the benefit of those employees.
Revenue per employee can therefore temporarily decline.
For example:
Before hiring:
Revenue = $10M
Employees = 100
Revenue Per Employee = $100,000
After hiring:
Revenue = $10.5M
Employees = 130
Revenue Per Employee ≈ $80,769
The metric falls sharply even though management may be executing a rational expansion plan.
Timing matters.
Downsizing Can Mechanically Increase the Metric
Revenue per employee can also improve after layoffs even if the business itself is weakening.
Suppose:
Revenue = $10,000,000
Employees = 100
Revenue per employee:
$100,000
Revenue then declines to $9 million, but headcount falls to 75.
Revenue Per Employee = $9,000,000 ÷ 75 = $120,000
The ratio improves from $100,000 to $120,000 even though total revenue declined by 10%.
The workforce reduction was proportionally larger than the sales decline.
This illustrates why the ratio should never be analyzed without total revenue and headcount trends.
Revenue Per Employee vs. Labor Productivity
Labor productivity measures output relative to labor input.
Revenue per employee is one specific revenue-based productivity measure.
Suppose a factory produces more units per labor hour without changing selling prices.
Physical labor productivity improves and revenue per employee may also rise.
But revenue per employee can increase even when physical productivity does not.
For example, if selling prices rise 20% with unchanged units produced and unchanged workforce:
Revenue Per Employee Can Rise 20%
even though physical output per worker is unchanged.
Revenue per employee therefore mixes productivity with pricing and product-mix effects.
Revenue Per Employee vs. Revenue
Revenue measures total sales scale.
Revenue per employee normalizes that scale by workforce size.
Suppose Company A generates $100 million of revenue with 2,000 employees.
Revenue Per Employee = $50,000
Company B generates only $20 million with 100 employees.
Revenue Per Employee = $200,000
Company A is five times larger by revenue.
Company B generates four times as much revenue per employee.
Both measures are useful, but they answer different questions.
Revenue Per Employee vs. Net Income
High revenue per employee does not guarantee high net income.
Suppose Company A generates:
Revenue Per Employee = $500,000
but operates with very high product, marketing, infrastructure, and financing costs.
It can still report weak profitability.
Company B may produce only $200,000 of revenue per employee but have far stronger margins.
The metric measures revenue efficiency relative to headcount, not bottom-line profitability.
Revenue Per Employee and Net Margin
Net margin helps add profitability context.
Suppose Company A has:
Revenue Per Employee = $300,000
Net Margin = 2%
Net income attributable to each employee on a simple proportional basis would be roughly:
$300,000 × 2% = $6,000
Company B has:
Revenue Per Employee = $180,000
Net Margin = 15%
A simple proportional calculation gives:
$180,000 × 15% = $27,000
Company A generates substantially more revenue per employee but retains much less profit from that revenue.
This does not create a formal “net income per employee” standard, but it illustrates why productivity and profitability should be considered together.
Revenue Per Employee and Operating Income
The same principle applies to operating income.
A company can have high revenue per employee but low operating profit if its non-labor operating structure is expensive.
Suppose:
Revenue = $50,000,000
Employees = 100
Revenue per employee:
$500,000
But if operating income is only $1 million:
Operating Income as % of Revenue = $1M ÷ $50M = 2%
The company is highly productive by top-line headcount but produces limited operating profit from those sales.
Revenue Per Employee and Operating Expenses
Payroll and workforce-related costs often form a significant portion of operating expenses.
Suppose revenue per employee rises because the business generates more sales without proportionally increasing headcount.
That can create operating leverage.
For example:
Period 1
Revenue = $10M
Employees = 100
Revenue Per Employee = $100,000
Period 2
Revenue = $14M
Employees = 110
Revenue Per Employee ≈ $127,273
If payroll and other employee-related expenses increase much more slowly than revenue, operating income can improve significantly.
However, under-hiring can eventually damage service, product quality, employee retention, or growth.
Revenue Per Employee and Automation
Automation can increase revenue per employee when technology allows a relatively stable workforce to support greater sales volume.
Suppose a company automates order processing.
Before automation:
Revenue = $20M
Employees = 200
Revenue Per Employee = $100,000
After automation:
Revenue = $30M
Employees = 210
Revenue Per Employee ≈ $142,857
The ratio improves approximately 42.9%.
But automation may require software, equipment, depreciation, implementation, and maintenance costs.
Revenue per employee captures the workforce effect, not the complete return on the technology investment.
Revenue Per Employee and Outsourcing
Outsourcing can make revenue per employee look stronger even if the amount of human labor supporting the company does not actually fall.
Suppose a company replaces 100 internal employees with contractors.
Reported employee count declines, but contractor expenses remain.
If revenue stays constant, revenue per employee increases mechanically because the denominator is smaller.
This makes cross-company comparisons difficult when one business relies heavily on employees and another relies heavily on contractors, outsourced manufacturing, franchisees, or third-party logistics.
The labor model should be understood before treating a higher ratio as superior efficiency.
Revenue Per Employee and Business Model
Different business models naturally produce different revenue-per-employee levels.
A capital-intensive automated platform may generate enormous revenue with relatively few employees.
A consulting company can require substantial skilled labor for every additional customer engagement.
A retailer may need store employees, distribution staff, customer service, and management.
A manufacturer can combine labor with factories and machinery.
Comparisons are therefore most useful among genuinely similar businesses.
A software platform should not automatically be compared with a labor-intensive restaurant chain simply because both report revenue and headcount.
Revenue Per Employee and Sales Per Square Foot
Retail businesses may analyze both revenue per employee and sales per square foot.
The metrics normalize sales using different resources.
Revenue per employee asks:
How much revenue is generated relative to workforce size?
Sales per square foot asks:
How much sales activity is generated relative to selling-space area?
A retailer might improve revenue per employee while sales per square foot remains unchanged if staffing becomes leaner without changing store productivity.
Alternatively, store productivity can rise while employee count grows sufficiently to reduce revenue per employee.
Each ratio isolates a different operating resource.
Revenue Per Employee and Inventory Availability
For product businesses, employee productivity cannot generate sales if inventory is unavailable.
Suppose sales staff could support $2 million of monthly revenue, but recurring stockouts limit actual revenue to $1.7 million.
Revenue per employee will be lower even if employee performance is strong.
Poor inventory availability can therefore make a workforce-efficiency metric look weak when the bottleneck lies elsewhere in the operating system.
Revenue Per Employee and Safety Stock
Safety stock can support revenue continuity by reducing stockout risk.
Suppose a retailer with 50 employees loses $100,000 of annual sales because popular items repeatedly go out of stock.
Current revenue:
$5,000,000
Revenue per employee:
$5,000,000 ÷ 50 = $100,000
If improved inventory protection allows the business to capture the additional $100,000 without hiring:
New Revenue = $5,100,000
New Revenue Per Employee = $5,100,000 ÷ 50 = $102,000
The ratio improves 2%.
The workforce did not necessarily work harder. Better inventory availability allowed existing labor capacity to generate more sales.
Revenue Per Employee and Reorder Point
A well-designed reorder point can similarly help prevent lost sales.
Suppose product availability improves enough to increase annual revenue from $8 million to $8.4 million while employee count remains 80.
Before:
$8,000,000 ÷ 80 = $100,000 per Employee
After:
$8,400,000 ÷ 80 = $105,000 per Employee
Revenue per employee increases by 5%.
The result reflects an operating-system improvement rather than a change in headcount.
This is why management should identify the actual driver behind the ratio.
Revenue Per Employee and Retained Earnings
Retained earnings can grow when improved business productivity leads to greater net income that remains inside the company.
However, high revenue per employee does not flow directly into retained earnings.
The path is:
Revenue Per Employee → Revenue and Cost Economics → Net Income → Retained Earnings
Suppose improved organizational efficiency raises revenue without requiring equivalent expense growth.
If net income increases by $200,000 and the company distributes only $50,000 of that additional profit:
Additional Earnings Retained = $200,000 − $50,000 = $150,000
The profitability effect, not the productivity ratio itself, increases retained earnings.
Revenue Per Employee and Labor Cost
Suppose a business generates $200,000 of revenue per employee and average compensation cost is $80,000.
A simple spread is:
$200,000 − $80,000 = $120,000
But that $120,000 is not profit per employee.
The company still must pay for product costs, facilities, software, marketing, depreciation, insurance, financing, taxes, and other expenses.
Comparing revenue per employee directly with salary can therefore exaggerate the economics of employment.
Revenue Per Employee With Part-Time Workers
Headcount can be misleading when some employees work full-time and others work only a few hours per week.
Suppose Company A has 100 full-time employees.
Company B reports 100 employees, but half are part-time.
Simply dividing by 100 in each business makes the workforces appear equivalent when labor capacity differs.
Using full-time-equivalent employees can provide a more comparable denominator when reliable FTE information is available.
The formula then becomes:
Revenue Per FTE = Revenue ÷ Average Full-Time-Equivalent Employees
Revenue Per FTE Example
Suppose a business has:
- 80 full-time employees;
- 40 half-time employees.
The half-time staff represent approximately:
40 × 0.5 = 20 FTEs
Total workforce on an FTE basis:
80 + 20 = 100 FTEs
If annual revenue is $15 million:
Revenue Per FTE = $15,000,000 ÷ 100 = $150,000
Using raw headcount of 120 would instead produce:
$15,000,000 ÷ 120 = $125,000
The choice of denominator materially affects the result.
Multi-Year Revenue Per Employee Example
Suppose a company reports:
| Year | Revenue | Average Employees | Revenue Per Employee |
|---|---|---|---|
| Year 1 | $10M | 100 | $100,000 |
| Year 2 | $12M | 110 | $109,091 |
| Year 3 | $15M | 120 | $125,000 |
From Year 1 to Year 3:
Revenue Increase = 50%
Employee increase:
20%
Revenue per employee increases:
($125,000 − $100,000) ÷ $100,000 × 100 = 25%
Revenue growth substantially outpaced hiring.
That can indicate improving operating leverage, stronger pricing, better technology, more productive employees, or a shift toward higher-value products.
Further analysis is needed to determine which factor matters most.
Example of Falling Revenue Per Employee
Suppose:
| Year | Revenue | Employees | Revenue Per Employee |
|---|---|---|---|
| Year 1 | $20M | 100 | $200,000 |
| Year 2 | $22M | 125 | $176,000 |
| Year 3 | $24M | 150 | $160,000 |
Revenue rises every year.
Revenue per employee declines.
From Year 1 to Year 3:
Revenue Growth = ($24M − $20M) ÷ $20M = 20%
Headcount growth:
(150 − 100) ÷ 100 = 50%
The workforce is expanding much faster than revenue.
That could signal declining efficiency, but it might also reflect intentional investment ahead of future growth.
Revenue Per Employee and Gross Burn
For an early-stage company, hiring increases payroll cash spending and can raise gross burn.
Suppose a startup has:
Revenue = $6M
100 Employees
Revenue Per Employee = $60,000
The company hires another 25 people but revenue has not yet increased.
New ratio:
$6M ÷ 125 = $48,000
Revenue per employee falls 20%.
At the same time, gross burn may increase because payroll cash outflows are higher.
This combination can be expected during planned expansion, but management needs sufficient liquidity for the investment period.
Revenue Per Employee and Net Burn
Net burn can improve if revenue rises faster than workforce-related spending and those sales convert into cash.
Suppose a company adds no employees but increases annual revenue substantially through automation or improved customer acquisition.
If customer collections rise while payroll stays relatively stable, revenue per employee improves and net cash burn may decline.
But the relationship is not automatic.
A business could increase revenue per employee while spending heavily on marketing, inventory, infrastructure, or contractors, causing net burn to worsen.
Price Changes and Revenue Per Employee
Revenue per employee is sensitive to selling prices.
Suppose the workforce and unit sales are unchanged, but average prices rise 15%.
If customers continue purchasing the same volume:
Revenue Per Employee Can Increase Approximately 15%
without any increase in physical output per worker.
This is one reason revenue per employee should not be described as a pure productivity metric.
It measures revenue productivity, which combines price, volume, product mix, and workforce size.
Product Mix and Revenue Per Employee
Suppose a company sells the same number of products with the same workforce, but customers shift toward higher-priced products.
Revenue can increase even if unit output is unchanged.
For example:
Original:
100,000 Units × Average $20 = $2,000,000 Revenue
New mix:
100,000 Units × Average $25 = $2,500,000 Revenue
With 20 employees:
Original revenue per employee:
$100,000
New revenue per employee:
$125,000
The 25% increase came from product mix rather than greater unit productivity.
Comparing Departments
Revenue per employee is usually more meaningful at company level because many employees do not directly generate sales.
Applying the metric to departments can produce misleading conclusions.
An accounting, legal, cybersecurity, compliance, or infrastructure team may generate little directly attributable revenue but still be essential to the company’s operations.
Sales teams may look highly productive because revenue is attributed to their activity even though product, support, engineering, logistics, and finance employees also contributed.
Revenue per employee should therefore avoid simplistic attribution of every sales dollar to one role.
Comparing Companies
Cross-company comparisons work best when businesses have similar:
- industries;
- revenue recognition practices;
- outsourcing models;
- geographic labor structures;
- product mixes;
- capital intensity; and
- business maturity.
A company that outsources manufacturing can report fewer employees and therefore higher revenue per employee than a vertically integrated competitor.
That does not automatically mean it operates more efficiently.
The denominator must represent comparable organizational structures.
What Is a Good Revenue Per Employee?
There is no universal benchmark.
A good result depends on the business model.
A professional-services firm may require many highly skilled employees for each unit of revenue.
An automated digital platform may support far more revenue with a smaller workforce.
A retailer’s ratio can differ from a manufacturer because of store staffing and logistics requirements.
Useful comparisons generally include the company’s own historical results and genuinely similar competitors.
How to Improve Revenue Per Employee
Revenue per employee can improve when revenue grows faster than employee count.
That can occur through better pricing, increased customer demand, automation, improved labor productivity, better product mix, stronger retention, improved inventory availability, more efficient sales processes, or simplification of internal operations.
The goal should not be to maximize the metric by minimizing headcount at any cost.
Excessive understaffing can reduce customer service, product quality, innovation, safety, compliance, and future revenue.
A sustainable improvement is one that increases organizational output without damaging the systems required to maintain it.
Common Revenue Per Employee Mistakes
One common mistake is using year-end headcount when employee numbers changed substantially during the year.
Another is treating high revenue per employee as proof of high profitability.
Businesses can also overlook contractors and outsourced labor, making organizations with different staffing models appear more comparable than they really are.
Another mistake is interpreting higher revenue per employee as pure labor-productivity growth when pricing or product mix caused the increase.
A workforce reduction can also improve the ratio mechanically even while total revenue declines.
Finally, comparisons across industries can be meaningless when their labor and capital requirements differ substantially.
Frequently Asked Questions
What is revenue per employee in simple terms?
Revenue per employee measures how much company revenue is generated relative to the number of employees in the business.
What is the revenue per employee formula?
Revenue Per Employee = Total Revenue ÷ Average Number of Employees
How do you calculate average employees?
A simple method is:
Average Employees = (Beginning Employees + Ending Employees) ÷ 2
Monthly or quarterly averages can be more accurate when headcount changes substantially.
What does $200,000 revenue per employee mean?
It means the business generates approximately $200,000 of company-wide revenue for each employee represented in the denominator.
It does not mean every employee individually sells $200,000.
Is higher revenue per employee always better?
No.
A higher number can reflect efficiency, pricing, automation, outsourcing, layoffs, or a different business model.
Profitability, quality, growth, and workforce sustainability still matter.
Can revenue per employee rise while revenue falls?
Yes.
If headcount declines faster than total revenue, the ratio can rise even though the company’s top line is shrinking.
Can revenue per employee fall while revenue rises?
Yes.
If employee count grows faster than revenue, revenue per employee declines.
This can happen during expansion or over-hiring.
Is revenue per employee the same as labor productivity?
Not exactly.
Labor productivity can measure physical output per labor hour or other output measures.
Revenue per employee specifically uses revenue as the output and employee count as the labor denominator.
Is revenue per employee the same as profit per employee?
No.
Revenue is measured before expenses. A company can have very high revenue per employee and low or negative profit.
Should part-time workers count as full employees?
Raw headcount can include them, but an FTE-based calculation may be more meaningful when working hours vary substantially.
Does automation improve revenue per employee?
It can if technology allows the company to support more revenue without proportional workforce growth.
The cost of the automation still needs separate analysis.
Can outsourcing increase revenue per employee?
Yes.
Moving work from employees to contractors can reduce reported employee count and mechanically increase the ratio even if total labor requirements remain similar.
How does inventory affect revenue per employee?
Stockouts can constrain sales even when workforce capacity is strong. Better inventory availability can therefore increase revenue per employee without increasing headcount.
How does revenue per employee relate to retained earnings?
There is no direct accounting relationship. If higher organizational efficiency improves net income and that profit is retained, retained earnings can increase.
What is a good revenue per employee?
There is no universal target. The most meaningful benchmarks are usually historical company performance and genuinely comparable businesses with similar operating models.




