


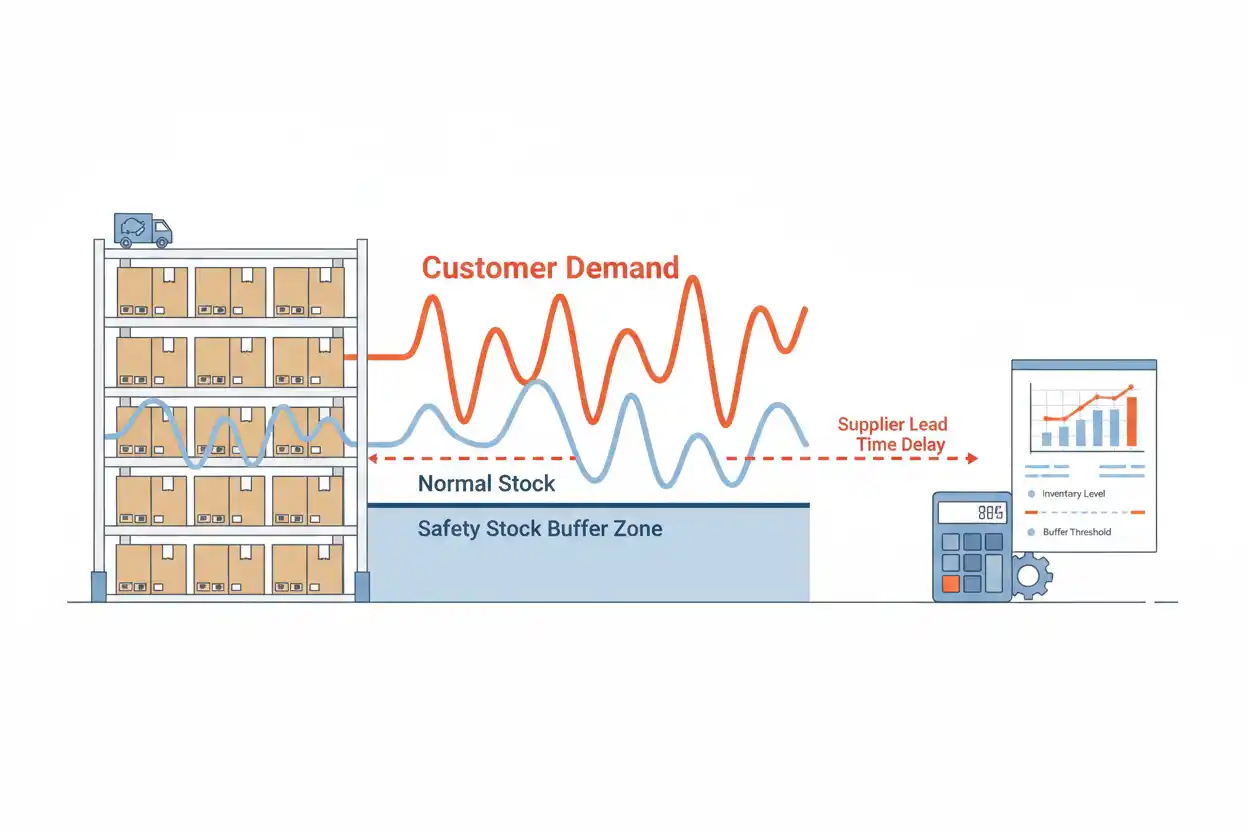
Safety stock is extra inventory held above expected demand to reduce the risk of running out when customer demand or supplier lead time is uncertain.
If a business expects to sell 500 units while waiting for replenishment but keeps another 150 units as protection, the 150 units are safety stock.
A practical relationship is:
Reorder Point = Expected Lead-Time Demand + Safety Stock
Rearranging it:
Safety Stock = Reorder Point − Expected Lead-Time Demand
If expected lead-time demand is 500 units and the reorder point is 650 units:
Safety Stock = 650 − 500 = 150 Units
The purpose is not to create permanent excess inventory. It is to provide a deliberate buffer against uncertainty that could otherwise create stockouts, lost sales, production interruptions, or emergency purchasing.
What Is Safety Stock?
Safety stock is inventory held specifically because actual conditions may differ from the plan.
Suppose a retailer normally sells 80 units per day and a supplier normally delivers in five days.
Expected lead-time demand is:
80 × 5 = 400 Units
If demand and delivery timing were perfectly predictable, 400 units would theoretically cover normal demand until the replenishment arrived.
Real operations are rarely perfect.
Demand might rise unexpectedly to 100 units per day. The supplier might take seven days instead of five. A shipment could arrive incomplete. Forecasts might be wrong.
Safety stock provides inventory that can absorb some of those deviations.
The concept applies to finished merchandise, raw materials, components, spare parts, and other forms of inventory where running out carries an economic or operational cost.
Safety Stock Formula
There is no single formula appropriate for every business.
A simple operational method uses maximum and average demand and lead time:
Safety Stock = (Maximum Daily Usage × Maximum Lead Time) − (Average Daily Usage × Average Lead Time)
This method estimates the difference between a high-demand/high-lead-time scenario and normal expected lead-time demand.
A second relationship applies when the reorder point is already known:
Safety Stock = Reorder Point − Expected Lead-Time Demand
More statistical approaches can incorporate demand variability, lead-time variability, and a target service level.
The method should match the quality of the available data and the actual source of uncertainty.
Safety Stock Example
Suppose an item has:
- Average daily demand: 80 units
- Maximum daily demand: 120 units
- Average lead time: 5 days
- Maximum lead time: 8 days
Normal expected lead-time demand is:
80 × 5 = 400 Units
Maximum modeled lead-time demand is:
120 × 8 = 960 Units
Safety stock is:
Safety Stock = 960 − 400
Safety Stock = 560 Units
Using that buffer, the reorder point becomes:
Reorder Point = 400 + 560 = 960 Units
Under this simple maximum-use method, the company triggers replenishment early enough to cover the modeled maximum combination of demand and lead time.
That can be conservative when the maximum values are rare or unlikely to occur simultaneously.
Safety Stock From a Known Reorder Point
Suppose a company has already established:
Reorder Point = 1,000 Units
Expected demand during supplier lead time is:
750 Units
Then:
Safety Stock = 1,000 − 750
Safety Stock = 250 Units
The 750 units support expected demand.
The additional 250 units are the protection against uncertainty.
This is the simplest way to identify the safety-stock component within an existing replenishment policy.
Why Businesses Hold Safety Stock
A business forecasts demand and supplier performance using incomplete information.
Even a strong forecast can miss.
Safety stock helps protect against several forms of uncertainty.
Demand can exceed expectations.
Supplier deliveries can arrive late.
Lead times can become inconsistent.
Orders can contain fewer units than expected.
Manufacturing output can be disrupted.
Weather, transportation, or supply-chain events can delay replenishment.
The economic reason for safety stock is therefore risk management rather than simply “having more inventory.”
Safety Stock and Demand Variability
Suppose normal demand is 100 units per day.
During a five-day lead time, expected demand is:
100 × 5 = 500 Units
But actual daily demand sometimes rises to 140 units.
At 140 units per day:
140 × 5 = 700 Units
Without a buffer, the business could be short:
700 − 500 = 200 Units
A 200-unit safety-stock buffer could cover that particular demand increase if lead time remained unchanged.
The calculation becomes more difficult when demand itself varies unpredictably from day to day rather than remaining at one higher level throughout the lead period.
Safety Stock and Lead-Time Variability
Demand is not the only source of uncertainty.
Suppose demand remains exactly 80 units per day.
Normal supplier lead time is five days:
Expected Demand = 80 × 5 = 400 Units
If the supplier takes eight days:
Actual Lead-Time Demand = 80 × 8 = 640 Units
Additional inventory needed:
640 − 400 = 240 Units
A 240-unit buffer would cover that three-day delay under constant demand.
When both demand and lead time vary, the required buffer can be larger.
Statistical Safety Stock With Variable Demand
When lead time is relatively stable but demand varies, one common statistical approximation is:
Safety Stock = Z × Demand Standard Deviation × √Lead Time
or:
SS = Z × σd × √L
Where:
Z = service factor associated with the selected service target
σd = standard deviation of demand per period
L = lead time measured in the same demand periods
Suppose:
Daily Demand Standard Deviation = 15 Units
Lead Time = 9 Days
and the company uses a service factor of:
Z = 1.645
Then:
Safety Stock = 1.645 × 15 × √9
Safety Stock = 1.645 × 15 × 3
Safety Stock ≈ 74 Units
The result is approximately 74 units of safety stock under the model assumptions.
This approach treats demand variability statistically instead of relying on one historical maximum.
Why Service Level Affects Safety Stock
A company seeking greater protection against stockouts generally needs a larger buffer.
Suppose demand variability and lead time remain unchanged.
With a smaller statistical service factor, calculated safety stock is lower.
With a larger service factor, safety stock rises.
That creates an economic tradeoff.
Higher service protection can reduce stockouts but increases average inventory and inventory carrying cost.
Lower safety stock reduces the carrying burden but increases exposure to unavailable inventory.
There is therefore no universal “correct” service level for every item.
Safety Stock and Reorder Point
Safety stock and reorder point are related but not interchangeable.
Suppose:
Average Daily Demand = 100 Units
Lead Time = 6 Days
Safety Stock = 250 Units
Expected lead-time demand:
100 × 6 = 600 Units
Reorder point:
600 + 250 = 850 Units
The company orders at 850 units.
The safety stock itself is only 250 units.
Confusing these values could cause the business to wait far too long before replenishing.
Safety Stock vs. Economic Order Quantity
Safety stock also differs from economic order quantity.
EOQ answers:
How much should we order?
Safety stock answers:
How much additional inventory should we hold to protect against uncertainty?
A company might calculate:
EOQ = 1,500 Units
Safety Stock = 300 Units
Reorder Point = 900 Units
Under that policy, the business triggers replenishment at 900 units and orders approximately 1,500 units.
The three numbers serve different purposes.
Safety Stock and Average Inventory
Under a simple EOQ-style cycle with constant replenishment quantity, average inventory can be approximated as:
Average Inventory ≈ Order Quantity ÷ 2 + Safety Stock
Suppose:
Order Quantity = 2,000 Units
Safety Stock = 400 Units
Average cycle inventory is:
2,000 ÷ 2 = 1,000 Units
Adding safety stock:
Average Inventory ≈ 1,000 + 400 = 1,400 Units
Without safety stock, average inventory would be approximately 1,000 units.
The buffer raises average inventory by 400 units.
Safety Stock Carrying Cost
Suppose annual holding cost is $5 per unit and safety stock is 400 units.
Annual Safety-Stock Carrying Cost = 400 × $5
Annual Safety-Stock Carrying Cost = $2,000
If safety stock increases to 700 units:
700 × $5 = $3,500
The additional 300 units add:
$3,500 − $2,000 = $1,500
of annual carrying cost under the assumptions.
This illustrates why continually adding buffers is not a free way to improve service.
Safety Stock and Working Capital
Safety stock ties up working capital because money invested in the buffer remains committed to inventory until the stock is sold or consumed.
Suppose safety stock consists of 5,000 units costing $20 each.
Capital committed is:
5,000 × $20 = $100,000
If the company can safely reduce the buffer to 3,500 units:
3,500 × $20 = $70,000
Potential reduction in inventory investment:
$100,000 − $70,000 = $30,000
The change can release $30,000 from inventory, assuming the lower safety stock still supports an acceptable service level.
Safety Stock and Revenue
Safety stock can indirectly protect revenue by reducing lost sales from stockouts.
Suppose a retailer sells an item for $50 and unexpected demand would create a shortage of 300 units.
Potential unfulfilled sales are:
300 × $50 = $15,000
If sufficient safety stock allows all 300 sales to be completed, the buffer can protect up to $15,000 of potential revenue in that scenario.
That does not mean the safety stock “earns” $15,000 automatically.
Some customers might wait, substitute another product, or buy later.
The example simply quantifies the sales exposure associated with unavailable inventory.
Safety Stock and Gross Profit
Revenue protection is only part of the economics.
Suppose those 300 units sell for $50 but cost $30 each.
Gross profit per unit is:
$50 − $30 = $20
Potential gross profit protected:
300 × $20 = $6,000
If the annual carrying cost of the additional safety stock required to protect that demand is $1,500, the buffer may appear economically worthwhile in this simplified scenario.
A complete decision still needs to consider the frequency of stockouts and the probability that the protection will actually be needed.
Safety Stock and Forecast Variance
A meaningful forecast variance can signal that existing safety-stock assumptions no longer match demand.
Suppose forecast monthly demand is 10,000 units but actual demand becomes 13,000.
Variance:
13,000 − 10,000 = 3,000 Units
Percentage variance:
3,000 ÷ 10,000 × 100 = 30%
Actual demand is 30% above forecast.
If the increase is persistent rather than temporary, both normal replenishment assumptions and safety-stock calculations may need to be updated.
Simply consuming the buffer every month indicates that the “uncertainty” may have become the new normal demand level.
Safety Stock Is Not a Substitute for Forecasting
A company should not compensate for consistently poor forecasts by continually increasing safety stock.
Suppose expected monthly demand is always 20% too low.
The business could respond by carrying more and more inventory.
That may reduce stockouts, but it also hides the underlying forecasting problem and increases carrying cost.
The better response is to update the demand forecast first and then determine the additional buffer needed for the uncertainty that remains.
Safety stock protects against variability—not permanently incorrect baseline assumptions.
Safety Stock and Supplier Performance
Improving supplier reliability can reduce the buffer required.
Suppose a supplier’s lead time previously ranged from five to ten days.
After process improvements, deliveries consistently arrive within five to six days.
The reduction in lead-time variability can justify a review of safety stock.
If the company keeps the old buffer despite the improved supply performance, it may hold more inventory than necessary.
Tracking supplier consistency can therefore produce working-capital savings without reducing customer service.
Multiple Suppliers and Safety Stock
A second qualified supplier can also reduce supply risk.
Suppose the main supplier occasionally experiences long delays.
If an alternative supplier can provide emergency replenishment within two days, the business may not need to protect against the full historical delay with physical safety stock.
However, the alternative supplier might charge more.
The tradeoff becomes:
higher inventory carrying cost versus higher emergency purchasing cost and supplier flexibility.
This is an operational decision rather than a reason to eliminate safety stock automatically.
Safety Stock and Price Variance
Emergency purchasing caused by insufficient inventory can create unfavorable price variance.
Suppose the normal input price is $15.
A stockout forces the company to buy 2,000 emergency units for $18.
Price Variance = ($18 − $15) × 2,000
Price Variance = $6,000 Unfavorable
Adequate safety stock might have prevented the emergency purchase.
On the other hand, holding a very large permanent buffer to avoid a rare $6,000 event may cost even more.
The decision should compare probabilities and total economic costs.
Safety Stock and Inventory Turnover
Higher safety stock increases average inventory when everything else remains unchanged.
That can reduce inventory turnover.
Suppose annual COGS is $1,200,000.
At average inventory of $200,000:
Inventory Turnover = $1,200,000 ÷ $200,000 = 6 Times
If additional safety stock raises average inventory to $240,000:
Inventory Turnover = $1,200,000 ÷ $240,000 = 5 Times
Turnover falls from 6 to 5 even though sales have not changed.
The lower turnover is not automatically bad if the extra buffer materially improves product availability, but the cost should be understood.
Safety Stock and Revenue per Employee
Safety stock can indirectly affect revenue per employee when product availability limits the sales existing employees can support.
Suppose a retailer generates:
Revenue = $5,000,000
with:
50 Employees
Revenue per employee is:
$100,000
Improved inventory availability reduces stockouts and increases revenue to $5.25 million without additional hiring.
Revenue Per Employee = $5,250,000 ÷ 50 = $105,000
The ratio improves 5%.
The employees did not necessarily become more productive themselves. Better inventory availability allowed the existing workforce to support more completed sales.
Safety Stock and Sales per Square Foot
The same availability effect can influence sales per square foot.
Suppose a 5,000-square-foot store generates $1.5 million annually:
Sales Per Square Foot = $1,500,000 ÷ 5,000 = $300
If improved stock availability raises sales to $1.6 million without changing store area:
$1,600,000 ÷ 5,000 = $320
Sales per square foot improves from $300 to $320.
However, excessively high safety stock can overcrowd storage areas or increase markdown risk, so more inventory is not automatically better.
Safety Stock and Accounting Records
Safety stock is not a separate type of asset on the financial statements simply because management has designated part of inventory as a buffer.
The items remain part of inventory accounting.
Purchases and inventory movements are recorded through the accounting system, and the related account balances ultimately feed into the trial balance.
Management can separately identify how many physical units are classified as safety stock for operational planning.
The operational designation should not be confused with a separate accounting balance unless the company’s accounting structure specifically creates such internal tracking.
Safety Stock and Retained Earnings
Safety stock does not directly increase or decrease retained earnings.
Its effect is indirect.
Too little buffer can produce stockouts, lost sales, emergency freight, and higher input prices.
Too much buffer can increase carrying costs, obsolescence, shrinkage, and working-capital requirements.
Those economic effects can influence profit.
Profits retained after distributions can then affect retained earnings.
The inventory decision itself is therefore separate from the equity accounting.
Safety Stock for High-Value Items
Safety stock should usually be lower, more carefully justified, or more precisely modeled when each unit is expensive.
Suppose a spare part costs $5,000.
Holding 20 units of safety stock requires:
20 × $5,000 = $100,000
of inventory investment.
If the probability and economic cost of a stockout are low, carrying $100,000 of extra parts may be inefficient.
If one missing part can shut down a factory costing $50,000 per hour, the same buffer may be economically reasonable.
Unit value alone cannot determine the answer.
Safety Stock for Perishable Goods
Perishable items require additional caution because excess stock can expire or spoil.
Suppose a food retailer increases safety stock from 100 to 300 units to reduce stockouts.
If 80 of those extra units repeatedly expire before sale, the buffer is solving one problem while creating another.
The appropriate safety-stock level must therefore consider shelf life, demand variability, supplier frequency, markdowns, spoilage, and customer-service requirements.
Safety Stock for Slow-Moving Parts
Intermittent-demand items can also be difficult.
A replacement component may average only two units of demand per month, but demand can arrive in occasional bursts of five or ten units.
Averages alone can understate the operational risk.
Businesses managing spare parts often need to consider the cost of downtime or unavailable service alongside historical usage.
A low-volume item can justify substantial protection if a stockout has a very high consequence.
When Safety Stock Is Too High
Possible signs of excessive safety stock include rising inventory carrying costs, increasing obsolete inventory, consistently untouched buffers, falling inventory turnover, frequent markdowns, and storage congestion.
Suppose 1,000 units have been designated as safety stock but actual inventory has never fallen below 700 of those units in three years.
That does not prove the full buffer is unnecessary, but it provides evidence that the policy deserves review.
Historical consumption should be compared with the service risk the buffer was intended to protect against.
When Safety Stock Is Too Low
Signs of insufficient safety stock include repeated stockouts during ordinary demand fluctuations, frequent expedited orders, customers waiting for replenishment, production interruptions, and recurring emergency supplier purchases.
If the buffer is repeatedly consumed, management should determine whether:
- uncertainty has increased;
- baseline demand is understated;
- supplier lead time has changed; or
- the current service target is incompatible with the buffer.
Simply replenishing the same inadequate amount after every shortage does not correct the underlying assumptions.
How to Reduce Safety Stock Without Increasing Stockouts
The most sustainable reductions usually come from reducing uncertainty.
A business can improve forecast accuracy, shorten supplier lead times, reduce lead-time variability, increase replenishment frequency, improve inventory visibility, develop alternate suppliers, and identify slow-moving products separately.
For example, reducing lead time from ten days to five can materially lower the amount of demand that must be covered before replenishment.
Improving the system can therefore reduce inventory without accepting the same increase in stockout risk that an arbitrary buffer cut would create.
Common Safety Stock Mistakes
A common mistake is confusing safety stock with the reorder point.
Another is selecting a buffer simply as an arbitrary percentage of inventory without analyzing demand or lead-time uncertainty.
Businesses can also use historical maximum values that are extreme outliers, creating unnecessarily large buffers.
The opposite problem occurs when averages are treated as certainties and no protection is held against meaningful variability.
Another mistake is leaving the calculation unchanged after demand or supplier performance changes.
Finally, safety stock should not be optimized in isolation. Carrying cost, stockout cost, product value, shelf life, customer expectations, working capital, and supplier flexibility all matter.
Frequently Asked Questions
What is safety stock in simple terms?
Safety stock is extra inventory held as a buffer against unexpected demand or replenishment delays.
What is the safety stock formula?
One simple formula is:
Safety Stock = (Maximum Daily Usage × Maximum Lead Time) − (Average Daily Usage × Average Lead Time)
Another relationship is:
Safety Stock = Reorder Point − Expected Lead-Time Demand
What is an example of safety stock?
If expected lead-time demand is 500 units and the reorder point is 650:
Safety Stock = 650 − 500 = 150 Units
Is safety stock the same as reorder point?
No.
Safety stock is the buffer.
The reorder point generally combines expected lead-time demand with that buffer.
Is safety stock the same as EOQ?
No.
EOQ estimates how much to order.
Safety stock determines how much additional inventory to hold for uncertainty.
Does safety stock increase inventory carrying cost?
Generally, yes.
Additional safety stock increases average inventory and therefore increases carrying cost when the holding cost per unit is positive.
Does higher safety stock prevent every stockout?
No.
An unexpectedly large demand surge or very long supplier delay can still exhaust the buffer.
Safety stock reduces risk; it does not eliminate uncertainty.
Can safety stock be zero?
Yes, in situations where demand and replenishment are sufficiently predictable or the economic cost of carrying a buffer exceeds the expected stockout cost.
The decision depends on the operating environment.
Does higher demand always require more safety stock?
Not automatically.
Higher average demand raises normal lead-time demand and the reorder point. Safety stock depends more specifically on uncertainty, variability, service targets, and lead-time risk.
Can better suppliers reduce safety stock?
Yes.
Shorter and more reliable lead times can reduce replenishment uncertainty and may allow a smaller buffer.
Can too much safety stock hurt profitability?
Yes.
Excess inventory can increase storage, capital, obsolescence, shrinkage, insurance, and other carrying costs.
How often should safety stock be recalculated?
It should be reviewed whenever demand patterns, supplier lead times, variability, service requirements, product economics, or replenishment methods change materially.
Why is safety stock important?
It creates a planned buffer between ordinary inventory needs and unexpected operational conditions, helping a business balance product availability against the financial cost of holding additional stock.




