


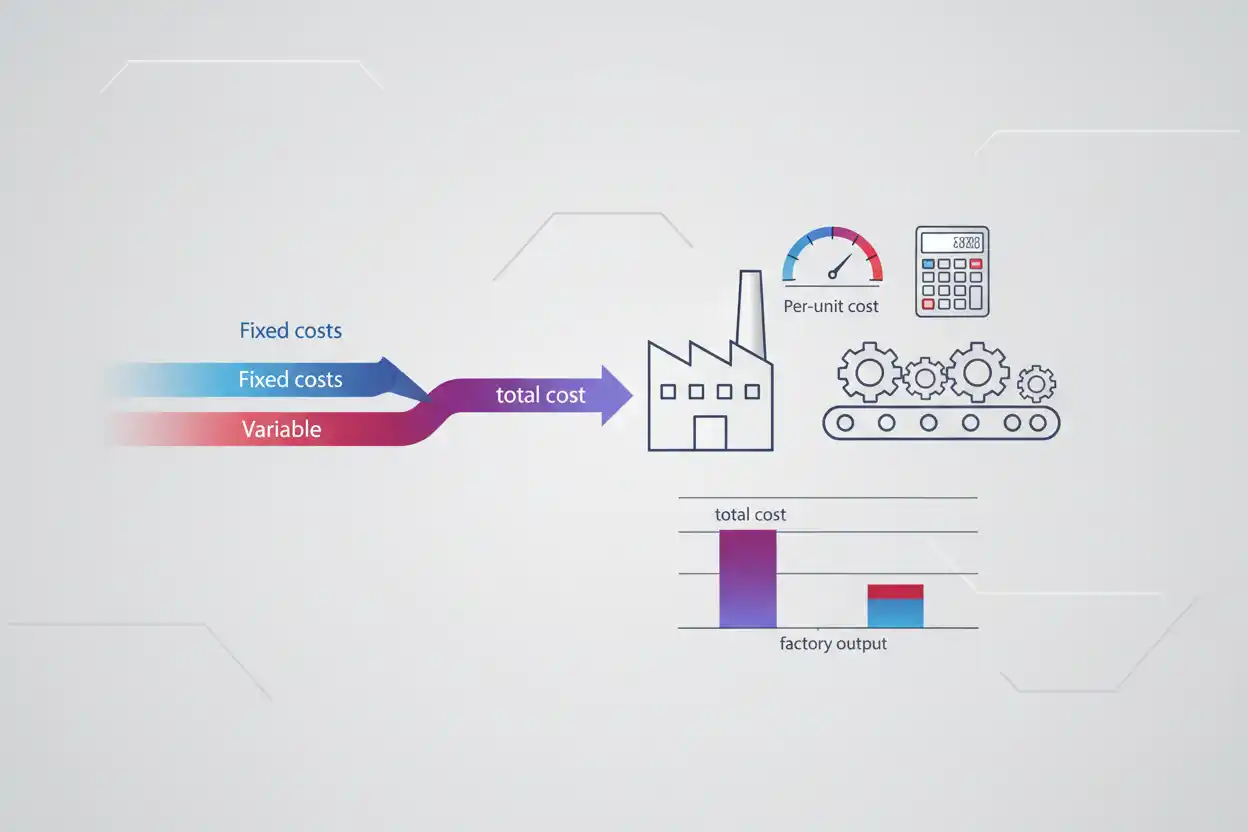
Unit cost is the average cost associated with producing, purchasing, or providing one unit of output. It is calculated by dividing the relevant total cost by the number of units associated with that cost.
If a manufacturer incurs $500,000 of qualifying costs to produce 100,000 units, its average unit cost is $5.
Unit Cost = Total Cost ÷ Number of Units
Unit Cost = $500,000 ÷ 100,000 = $5 per Unit
The usefulness of the result depends on what is included in total cost. A production unit cost, purchase unit cost, variable unit cost, and fully allocated unit cost can all differ because they include different cost components.
What Is Unit Cost?
Unit cost converts an aggregate cost into a cost per individual unit.
A business might use it to evaluate:
- manufacturing costs;
- purchasing costs;
- product profitability;
- pricing;
- cost trends;
- inventory economics;
- production efficiency; or
- operating decisions.
Suppose total relevant cost is $250,000 and output is 50,000 units.
Unit Cost = $250,000 ÷ 50,000 = $5
This means the included costs average $5 across each unit produced.
It does not necessarily mean every individual unit literally consumed exactly $5 of resources.
Unit cost is often an average.
Unit Cost Formula
The general formula is:
Unit Cost = Total Relevant Cost ÷ Total Units
When total cost contains fixed and variable costs:
Total Cost = Total Fixed Cost + Total Variable Cost
Therefore:
Unit Cost = (Total Fixed Cost + Total Variable Cost) ÷ Units Produced
Suppose:
Fixed Costs = $200,000
Variable Costs = $300,000
Output = 100,000 Units
Then:
Unit Cost = ($200,000 + $300,000) ÷ 100,000
Unit Cost = $5 per Unit
Unit Cost Example
Assume a factory produces 20,000 units during a month.
Relevant costs are:
| Cost Component | Amount |
|---|---|
| Direct materials | $80,000 |
| Direct labor | $50,000 |
| Manufacturing overhead | $30,000 |
| Total cost | $160,000 |
Unit cost is:
$160,000 ÷ 20,000
Unit Cost = $8 per Unit
The average manufacturing cost represented by the included expenses is $8 for each unit.
Whether all three categories should be included in a particular decision depends on the purpose of the analysis and accounting framework.
Direct Material Cost per Unit
Suppose total direct materials used are $120,000 for 30,000 units.
Material Cost per Unit = $120,000 ÷ 30,000
Material Cost per Unit = $4
If direct labor costs $2 per unit and allocated manufacturing overhead is $1.50:
Total Unit Cost = $4 + $2 + $1.50
Total Unit Cost = $7.50
Breaking unit cost into components makes it easier to identify what caused a change.
Direct Labor Cost per Unit
Suppose a business pays $180,000 of qualifying direct labor to produce 60,000 units.
Direct Labor Cost per Unit = $180,000 ÷ 60,000
Direct Labor Cost per Unit = $3
If labor productivity improves and the same $180,000 of labor supports 72,000 units:
New Labor Cost per Unit = $180,000 ÷ 72,000
New Labor Cost per Unit = $2.50
The labor component falls by $0.50 per unit.
This does not automatically mean total unit cost falls by the same amount if material, overhead, or other costs change.
Fixed Cost per Unit
Fixed costs are spread across the units used in the calculation.
Suppose annual fixed manufacturing cost is $600,000.
At 100,000 units:
Fixed Cost per Unit = $600,000 ÷ 100,000 = $6
At 150,000 units:
Fixed Cost per Unit = $600,000 ÷ 150,000 = $4
The total fixed cost remains $600,000, but the average amount allocated to each unit falls as output increases.
This is one reason scale can reduce average unit cost within the relevant capacity range.
Variable Cost per Unit
Variable cost per unit can remain relatively stable when cost changes proportionally with output.
Suppose materials cost $5 per unit.
At 10,000 units:
Total Variable Cost = 10,000 × $5 = $50,000
At 20,000 units:
Total Variable Cost = 20,000 × $5 = $100,000
The total doubles, but variable cost per unit remains:
$5
In practice, discounts, waste, overtime, supplier pricing, efficiency, and capacity constraints can cause variable unit costs to change.
Unit Cost With Fixed and Variable Components
Suppose:
Total Fixed Cost = $100,000
Variable Cost per Unit = $6
At 20,000 units:
Variable cost:
20,000 × $6 = $120,000
Total cost:
$100,000 + $120,000 = $220,000
Unit cost:
$220,000 ÷ 20,000 = $11
At 40,000 units:
Variable cost:
40,000 × $6 = $240,000
Total cost:
$100,000 + $240,000 = $340,000
Unit cost:
$340,000 ÷ 40,000 = $8.50
Average unit cost falls because the same $100,000 of fixed cost is spread across twice as many units.
Unit Cost and Production Volume
Production volume can materially affect average cost.
Suppose fixed manufacturing costs are $300,000 and variable cost is $4 per unit.
At 50,000 units:
Total Cost = $300,000 + ($4 × 50,000)
Total Cost = $500,000
Unit Cost = $500,000 ÷ 50,000 = $10
At 100,000 units:
Total Cost = $300,000 + ($4 × 100,000)
Total Cost = $700,000
Unit Cost = $700,000 ÷ 100,000 = $7
Volume doubles, while average unit cost declines 30%.
($7 − $10) ÷ $10 × 100 = −30%
The lower result is driven by spreading fixed costs across more units.
Volume Can Eventually Increase Unit Cost
Higher production does not reduce unit cost indefinitely.
Suppose a plant reaches normal capacity and then requires overtime, expedited materials, temporary facilities, additional maintenance, or less efficient production schedules.
Variable or semi-variable costs may increase.
For example:
At 100,000 units:
Total Cost = $700,000
Unit Cost = $7
At 120,000 units, capacity pressure pushes total cost to $900,000:
Unit Cost = $900,000 ÷ 120,000
Unit Cost = $7.50
Output increased, but average unit cost rose because the plant moved into a more expensive operating range.
Scale economies are therefore not unlimited.
Unit Cost vs. Selling Price
Unit cost is not the same as selling price.
Suppose:
Unit Cost = $12
Selling Price = $20
Simplified gross profit contribution before other applicable costs:
$20 − $12 = $8 per Unit
If the selling price falls to $15 while unit cost remains $12:
Difference = $3 per Unit
A product can therefore generate substantial sales while becoming much less profitable if selling prices fall toward cost.
Pricing decisions should reflect more than unit cost alone because other operating expenses and target returns may also need to be covered.
Unit Cost vs. Revenue per Unit
Revenue per unit measures the average sales amount generated for each unit.
Unit cost measures the average cost assigned to each unit under the chosen definition.
Suppose:
Revenue = $1,000,000
Units Sold = 50,000
Revenue per unit:
$1,000,000 ÷ 50,000 = $20
If unit cost is $13:
Simplified Difference = $20 − $13 = $7 per Unit
That $7 is not automatically final net profit per unit because selling, administrative, financing, tax, and other costs can still exist.
Unit Cost vs. Cost of Goods Sold
Cost of goods sold is the cost assigned to products actually sold during the period.
Unit cost describes cost on a per-unit basis.
Suppose 10,000 units are sold and the applicable cost is $8 per unit:
COGS = 10,000 × $8 = $80,000
If 3,000 additional units remain unsold, their applicable product cost can remain in inventory instead of entering current-period COGS.
Unit cost can therefore help determine both inventory valuation and COGS, depending on the accounting method and production-cost framework.
Unit Cost and Inventory
Inventory value often depends on the cost assigned to the units held.
Suppose a business has 5,000 finished units with an applicable unit cost of $12.
Inventory Value = 5,000 × $12
Inventory Value = $60,000
If unit cost rises to $14 and the same quantity is held:
5,000 × $14 = $70,000
The physical stock quantity has not changed, but its recorded cost basis in this simplified example rises by $10,000.
Accurate unit-cost determination is therefore important for inventory-intensive businesses.
Purchased Unit Cost
A retailer or distributor can calculate a purchase unit cost from the cost of acquired goods.
Suppose 2,000 units cost $40,000 in total.
Purchase Unit Cost = $40,000 ÷ 2,000 = $20
If qualifying inbound costs of $4,000 are included in the relevant inventory cost:
Adjusted Total Cost = $44,000
Adjusted Unit Cost = $44,000 ÷ 2,000 = $22
The exact costs included depend on the accounting framework and purpose of the analysis.
Unit Cost and Price Variance
A price variance can change unit cost when actual input prices differ from the standard.
Suppose each finished product uses two units of a material.
Standard input price:
$5 per Material Unit
Standard material cost per finished unit:
2 × $5 = $10
Actual input price rises to $6:
Actual Material Cost per Finished Unit = 2 × $6 = $12
The material component of unit cost increases by:
$12 − $10 = $2 per Finished Unit
An unfavorable purchasing price variance can therefore feed into higher actual unit costs.
Unit Cost and Volume Variance
A volume variance can help explain why actual activity differs from the production level used in planning.
Suppose a factory budgets fixed cost allocation based on 100,000 units but produces only 80,000.
A simplified fixed-cost-per-unit comparison is:
Budgeted volume:
$400,000 ÷ 100,000 = $4 per Unit
Actual volume:
$400,000 ÷ 80,000 = $5 per Unit
The same fixed cost is spread across fewer units, increasing average fixed cost per unit by $1.
Unit cost measures the resulting per-unit economics, while volume variance isolates the effect of activity differing from its benchmark within the assigned variance framework.
Unit Cost and Labor Productivity
Improved labor productivity can reduce the labor component of unit cost.
Suppose employees cost $30 per labor hour.
At productivity of 5 units per hour:
Labor Cost per Unit = $30 ÷ 5 = $6
At 6 units per hour:
Labor Cost per Unit = $30 ÷ 6 = $5
Productivity improves 20%:
(6 − 5) ÷ 5 × 100 = 20%
Labor cost per unit declines:
$6 − $5 = $1
If the company produces 100,000 units:
Potential Labor-Cost Difference = 100,000 × $1 = $100,000
Other costs need to remain comparable for the total unit-cost benefit to equal that amount.
Unit Cost and Revenue per Employee
Revenue per employee measures organizational revenue relative to workforce size.
Unit cost measures cost relative to output.
Suppose a company automates production.
Revenue per employee might increase because a smaller workforce supports more sales.
Unit cost may also fall if labor savings exceed new technology expenses.
But either metric can improve without the other.
For example, selling prices can raise revenue per employee even when production cost per unit is unchanged.
The measures therefore describe different dimensions of efficiency.
Unit Cost and Safety Stock
Safety stock does not normally change the production cost per unit merely because more physical units are held as a buffer.
However, safety stock can increase inventory carrying costs.
Suppose a product costs $20 per unit to acquire and the business carries another 1,000 units as safety stock.
Additional inventory investment is:
1,000 × $20 = $20,000
The $20 product unit cost and the carrying cost of maintaining extra units should be kept distinct.
Combining them without a clear analytical purpose can distort purchasing and inventory decisions.
Unit Cost and Sales per Square Foot
Sales per square foot measures retail revenue relative to selling space.
Unit cost measures the cost of products or output on a per-unit basis.
Consider two stores with identical sales density.
Store A may sell high-cost products with narrow margins.
Store B may sell lower-cost products with wider margins.
Both can report:
$300 Sales per Square Foot
while generating very different gross profit.
Sales density therefore cannot replace unit-cost analysis.
Unit Cost and Trial Balance
The trial balance contains ledger account balances that can support a unit-cost calculation.
A manufacturer might draw cost information from accounts representing materials, labor, manufacturing overhead, depreciation, and inventory movements.
The unit denominator comes from production records rather than the trial balance.
Suppose relevant accounting costs total $800,000 and production records show 100,000 units.
Unit Cost = $800,000 ÷ 100,000 = $8
A balanced trial balance helps support the integrity of the accounting data, but it does not prove that every cost has been allocated correctly to the product.
Unit Cost and Operating Expenses
Whether operating expenses should be included depends on what “unit cost” is intended to measure.
A manufacturing product cost might include production-related materials, labor, and qualifying manufacturing overhead but exclude selling and administrative expenses.
A broader fully loaded management calculation may allocate additional costs.
Suppose:
Manufacturing Unit Cost = $10
and allocated selling and administrative costs equal:
$3 per Unit
A fully loaded internal cost might be:
$13 per Unit
The two figures answer different questions.
The calculation should clearly state what costs are included.
Product Cost vs. Fully Loaded Unit Cost
Suppose a company produces 50,000 units.
Production costs:
$400,000
Selling and administrative costs:
$150,000
Product unit cost:
$400,000 ÷ 50,000 = $8
Fully allocated management cost:
($400,000 + $150,000) ÷ 50,000 = $11
A pricing decision based only on the $8 manufacturing figure can overlook $3 per unit of additional costs allocated in the broader analysis.
Conversely, including every corporate expense in a short-term production decision may also be inappropriate.
The purpose of the calculation determines the useful cost definition.
Unit Cost and Gross Profit
Suppose a product sells for $25 and carries an applicable product cost of $15.
Gross profit per unit is:
$25 − $15 = $10
If 20,000 units are sold:
Revenue = 20,000 × $25 = $500,000
COGS = 20,000 × $15 = $300,000
Gross Profit = $200,000
A $1 reduction in product unit cost, with sales volume and price unchanged, raises gross profit by:
20,000 × $1 = $20,000
Unit-cost improvements can therefore have a material effect on profitability at scale.
Unit Cost and Net Margin
Unit cost can affect net margin, but the relationship is not one-to-one because many expenses occur after product cost.
Suppose revenue is $1 million.
Original net income:
$100,000
Original net margin:
10%
Cost improvements increase net income by $40,000 with revenue unchanged.
New net income:
$140,000
New net margin:
14%
The four-percentage-point improvement could be partly driven by lower unit cost, but management should identify the specific cost and expense changes rather than attributing all margin movement to one factor.
Unit Cost and Production Waste
Waste or scrap can increase unit cost because resources are consumed without producing an equal number of saleable units.
Suppose total production cost is $100,000.
If 10,000 good units are produced:
Unit Cost = $10
If production problems reduce good output to 8,000 units while cost remains $100,000:
Unit Cost = $12.50
The average cost per usable unit increases 25%.
($12.50 − $10) ÷ $10 × 100 = 25%
Reducing waste can therefore improve unit economics even when supplier prices and wages do not change.
Unit Cost and Defective Output
Suppose a plant produces 10,000 physical units at a cost of $90,000.
Simple cost per physical unit:
$9
But 1,000 units are defective and cannot be sold.
Good units:
9,000
Cost per saleable unit, if all cost is effectively borne by the good output in a simple management analysis:
$90,000 ÷ 9,000 = $10
The quality-adjusted result is $1 higher.
This demonstrates why the denominator should represent meaningful output when unit cost is used for operational decisions.
Unit Cost and Capacity Utilization
If a company operates well below capacity, fixed costs are spread across fewer units.
Suppose fixed factory cost is $500,000.
At 50,000 units:
Fixed Cost per Unit = $10
At 100,000 units:
Fixed Cost per Unit = $5
If greater production can be sold profitably without triggering substantial new costs, better utilization can lower average unit cost.
Producing unnecessary inventory merely to spread fixed costs, however, can create carrying costs and obsolescence risks.
Lower accounting cost per unit is not valuable if excess products cannot be sold economically.
Economies of Scale
Unit cost can decline as production grows because of factors such as:
- spreading fixed costs;
- purchasing discounts;
- specialized equipment;
- process automation;
- better labor utilization; and
- more efficient logistics.
Suppose unit cost falls:
| Output | Total Cost | Unit Cost |
|---|---|---|
| 10,000 | $120,000 | $12 |
| 20,000 | $200,000 | $10 |
| 40,000 | $320,000 | $8 |
Average cost declines as output expands.
This pattern represents economies of scale within the observed production range.
Diseconomies of Scale
Beyond a certain point, unit cost can rise.
Suppose:
| Output | Total Cost | Unit Cost |
|---|---|---|
| 40,000 | $320,000 | $8.00 |
| 50,000 | $425,000 | $8.50 |
| 60,000 | $570,000 | $9.50 |
Possible reasons include overtime, congestion, equipment breakdowns, additional management layers, higher supplier costs, emergency logistics, and production inefficiencies.
More output does not guarantee lower unit cost.
Unit Cost Trend Example
Suppose:
| Quarter | Units Produced | Total Cost | Unit Cost |
|---|---|---|---|
| Q1 | 50,000 | $500,000 | $10.00 |
| Q2 | 55,000 | $522,500 | $9.50 |
| Q3 | 60,000 | $558,000 | $9.30 |
| Q4 | 65,000 | $617,500 | $9.50 |
Unit cost falls through Q3 but rises in Q4.
The Q4 increase deserves investigation.
Potential drivers include wage increases, material-price changes, lower quality, overtime, maintenance, or capacity constraints.
A trend is usually more informative than one isolated period.
Unit Cost Variance Example
Suppose standard unit cost is $8 and actual unit cost is $8.75.
Difference:
$8.75 − $8.00 = $0.75 Unfavorable per Unit
For 40,000 units:
Total Difference = $0.75 × 40,000
Total Difference = $30,000
The $30,000 difference may contain several drivers, including input prices, labor efficiency, production volume, overhead, or waste.
A unit-cost comparison shows the overall per-unit movement but does not isolate each cause.
Unit Cost for a Service Business
A service business can also calculate unit cost when it has a meaningful service unit.
Suppose a support operation handles 25,000 customer cases with $500,000 of relevant costs.
Cost per Case = $500,000 ÷ 25,000
Cost per Case = $20
A delivery company might calculate cost per delivery.
A payment processor might calculate cost per transaction.
A hotel might calculate cost per occupied room.
The concept is not limited to physical manufacturing.
Unit Cost for a Restaurant
Suppose a restaurant sells 5,000 portions of a menu item during a month.
Relevant ingredient cost is $25,000.
Ingredient Cost per Portion = $25,000 ÷ 5,000 = $5
If directly attributable packaging adds $1 per portion:
Basic Unit Cost = $6
Labor, occupancy, utilities, waste, delivery commissions, and other costs can be analyzed separately or included depending on the intended cost definition.
A clearly defined unit-cost measure is more useful than an apparently precise number with unclear components.
Unit Cost for Retail Purchases
Suppose a retailer purchases 1,000 identical items.
Invoice cost:
$18,000
Qualifying freight allocated to the shipment:
$2,000
Total relevant acquisition cost:
$20,000
Average acquisition cost:
$20,000 ÷ 1,000 = $20 per Unit
If 200 units remain in inventory:
Inventory at This Cost = 200 × $20 = $4,000
The remaining 800 units, if sold and otherwise applicable, represent:
800 × $20 = $16,000
of product cost associated with sold units in this simplified illustration.
Break-Even Considerations
Unit cost can inform pricing and break-even analysis, but average unit cost should not automatically replace the distinction between fixed and variable costs.
Suppose average total unit cost is $10 and selling price is $12.
The apparent spread is $2.
However, a short-term decision may depend primarily on incremental variable cost if fixed costs will exist regardless of the decision.
Conversely, long-term pricing must eventually support the broader cost structure and required return.
The purpose of the decision determines which cost measure is economically relevant.
Lower Unit Cost Is Not Always Better
A business can reduce unit cost in ways that damage the broader economics.
Cheaper materials can increase defects.
Larger purchase quantities can lower purchase cost but create excessive inventory.
Faster production can lower labor cost per unit while reducing quality.
Deferred maintenance can temporarily reduce cost while increasing future breakdowns.
The goal is therefore not to minimize unit cost at any cost.
It is to achieve an economically efficient cost while preserving quality, reliability, demand, and long-term performance.
Common Unit Cost Mistakes
A common mistake is dividing total company expenses by units without considering whether those costs actually belong in the unit-cost definition.
Another is mixing production units with units sold.
Businesses can also compare unit costs calculated using different cost components.
Another error is ignoring defective output or scrap in the denominator.
Companies sometimes assume unit cost will always decline when production volume rises, even when capacity constraints create additional costs.
Finally, a low unit cost should not be interpreted as evidence of high profitability unless selling prices, other expenses, and sales volume are also considered.
Frequently Asked Questions
What is unit cost in simple terms?
Unit cost is the average relevant cost associated with producing, purchasing, or providing one unit of output.
What is the unit cost formula?
Unit Cost = Total Relevant Cost ÷ Total Units
How do you calculate unit cost with fixed and variable costs?
Use:
Unit Cost = (Total Fixed Costs + Total Variable Costs) ÷ Units Produced
What is an example of unit cost?
If production costs $200,000 and output is 25,000 units:
Unit Cost = $200,000 ÷ 25,000 = $8
Is unit cost the same as selling price?
No.
Unit cost measures cost per unit.
Selling price is the amount charged to the customer.
The difference helps contribute toward profit and other costs.
Is unit cost the same as COGS?
No.
Unit cost is a per-unit measure.
COGS is the total applicable cost assigned to goods sold during the period.
Does higher production lower unit cost?
It can when fixed costs are spread across more units.
However, unit cost can eventually rise if higher output creates overtime, congestion, maintenance, or other capacity-related costs.
How does labor productivity affect unit cost?
Higher output per labor hour can reduce the labor-cost component per unit when hourly labor cost remains comparable.
How does price variance affect unit cost?
Higher-than-standard input prices can increase the material or purchasing component of actual unit cost.
Does safety stock increase product unit cost?
Safety stock primarily increases the quantity of inventory held and its carrying cost. It does not necessarily change the production or purchase cost assigned to each individual unit.
Why is cost definition important?
Different decisions require different costs. Manufacturing unit cost, purchase cost, variable cost, and fully allocated cost can all be legitimate but answer different questions.
Can unit cost be calculated for services?
Yes.
A business can calculate cost per customer case, delivery, transaction, appointment, occupied room, project, or another meaningful service unit.
Can unit cost fall while total costs rise?
Yes.
If output increases faster than total costs, the average cost per unit can decline even though the company spends more in total.
Why should unit cost be tracked over time?
Trend analysis can reveal changes in material prices, labor efficiency, production volume, overhead absorption, waste, capacity constraints, and other cost drivers that a single-period result cannot explain.




