


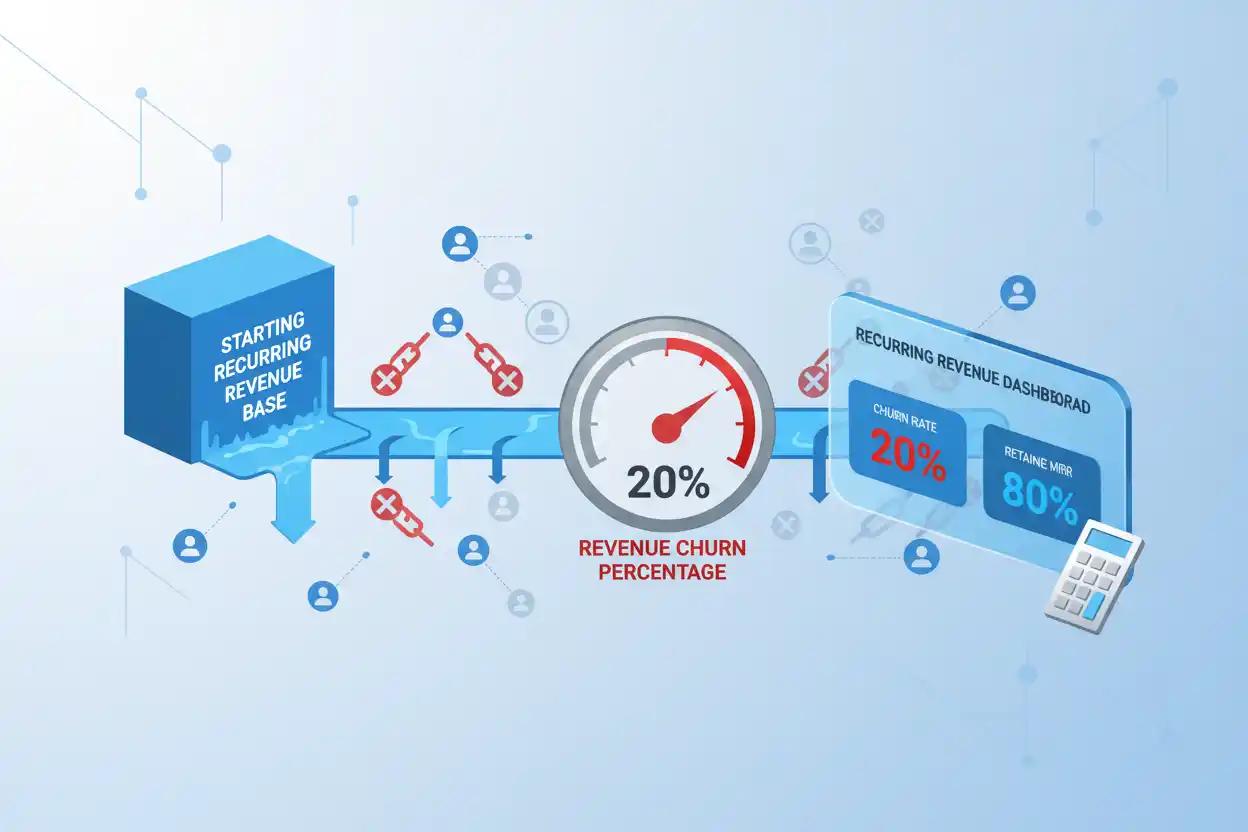
Revenue churn measures the percentage of recurring revenue lost from existing customers during a defined period.
If a subscription business begins a month with $500,000 of monthly recurring revenue and customers who cancel remove $25,000 of MRR:
Revenue Churn Rate = Churned Recurring Revenue ÷ Starting Recurring Revenue × 100
Revenue Churn Rate = $25,000 ÷ $500,000 × 100 = 5%
The business experienced 5% revenue churn during the month.
Revenue churn is different from customer churn because it weights losses by their revenue value. Losing one $20,000-per-month enterprise account can matter more financially than losing dozens of small accounts.
What Is Revenue Churn?
Revenue churn shows how much recurring revenue disappears because customers stop paying for a recurring product or service.
Suppose a SaaS business starts January with:
$1,000,000 MRR
During January, canceled customers remove:
$40,000 MRR
Revenue churn rate:
$40,000 ÷ $1,000,000 × 100 = 4%
The company lost 4% of its starting recurring revenue through complete customer cancellations.
If retained customers also downgrade, that separate contraction can be incorporated into a broader gross revenue churn calculation when the company’s reporting methodology defines it that way.
The exact definition should remain consistent across reporting periods.
Revenue Churn Formula
For revenue lost through complete customer cancellations:
Revenue Churn Rate = Churned Recurring Revenue ÷ Starting Recurring Revenue × 100
For example:
Starting MRR = $800,000
Churned MRR = $24,000
Then:
Revenue Churn Rate = $24,000 ÷ $800,000 × 100
= 3%
The business lost 3% of its starting recurring revenue because customers canceled.
Gross Revenue Churn Including Contraction
Some businesses use a broader revenue-churn definition that includes both full cancellations and customer downgrades.
Under that methodology:
Gross Revenue Churn Rate = (Churned Revenue + Contraction Revenue) ÷ Starting Recurring Revenue × 100
Suppose:
Starting MRR = $1,000,000
Churned MRR = $40,000
Contraction MRR = $20,000
Then:
Gross Revenue Churn = ($40,000 + $20,000) ÷ $1,000,000 × 100
= 6%
The company lost 6% of starting recurring revenue before considering expansion.
This broader calculation is closely related to gross revenue retention, which expresses the amount retained rather than the amount lost.
Revenue Churn Example
Suppose a company has four customers that cancel during the month:
| Customer | MRR Lost |
|---|---|
| A | $2,000 |
| B | $5,000 |
| C | $1,000 |
| D | $12,000 |
| Total | $20,000 |
Starting MRR is:
$400,000
Revenue churn:
$20,000 ÷ $400,000 × 100
= 5%
The company lost four customer accounts and 5% of its recurring revenue.
If the business started with 200 customers, customer-count churn would be:
4 ÷ 200 × 100 = 2%
The difference shows why customer churn and revenue churn should both be monitored.
Revenue Churn vs. Customer Churn
Customer churn weights every lost customer equally.
Revenue churn weights losses according to recurring revenue.
Suppose a company has 100 customers.
Ninety customers pay:
$100 per Month
Ten enterprise customers pay:
$5,000 per Month
Total MRR:
(90 × $100) + (10 × $5,000)
= $59,000
If one enterprise customer cancels:
Customer churn:
1 ÷ 100 × 100 = 1%
Revenue churn:
$5,000 ÷ $59,000 × 100 ≈ 8.47%
Only 1% of customer logos disappear, but approximately 8.47% of MRR is lost.
High Customer Churn With Low Revenue Churn
The reverse can also occur.
Suppose the same business loses ten small customers paying $100 each.
Customer churn:
10 ÷ 100 × 100 = 10%
Revenue lost:
$1,000
Revenue churn:
$1,000 ÷ $59,000 × 100 ≈ 1.69%
Ten percent of customers leave, but less than 2% of recurring revenue disappears.
The lost customers were much smaller than the average account.
Revenue Churn vs. Logo Retention
Logo retention measures how many customer accounts remain.
Suppose:
Logo Retention = 98%
That sounds strong.
But if the 2% of customers lost represent 20% of recurring revenue:
Revenue Churn = 20%
The business retains almost every customer by count while losing a large share of recurring value.
This is particularly important in enterprise businesses with concentrated customer revenue.
Revenue Churn vs. Gross Revenue Retention
Gross revenue retention is essentially the retained-revenue counterpart to gross revenue churn when both use matching definitions.
If gross revenue churn is:
7%
then:
GRR = 100% − 7% = 93%
provided both calculations use the same starting cohort and include the same churn and contraction categories.
GRR focuses on what survived.
Revenue churn focuses on what disappeared.
Revenue Churn vs. Net Revenue Retention
Net revenue retention adds expansion from retained customers.
Suppose:
Starting MRR = $1M
Churned Revenue = $50K
Contraction = $20K
Expansion = $150K
Gross revenue churn including contraction:
($50K + $20K) ÷ $1M = 7%
NRR:
($1M − $50K − $20K + $150K) ÷ $1M
= 108%
The company loses 7% of starting recurring revenue before expansion, yet the existing customer cohort grows to 108% of its original value.
Strong expansion does not mean revenue churn disappeared.
Revenue Churn vs. Expansion Revenue
Expansion revenue is the positive counterpart to recurring revenue loss from existing customers.
Suppose:
Churned MRR = $30,000
Expansion MRR = $50,000
The net impact of those two components is:
+$20,000
But revenue churn remains:
$30,000
It should not be reported as zero simply because expansion more than replaced the loss.
Keeping gross losses and positive expansion separate makes the customer-base economics easier to diagnose.
Revenue Churn and Monthly Recurring Revenue
Monthly recurring revenue provides the recurring base from which monthly revenue churn can be calculated.
Suppose:
Starting MRR = $2M
Churned customers remove:
$100,000
Revenue churn:
5%
Before new customers or expansion are added:
Remaining MRR = $1.9M
If new and expansion MRR total $250,000:
Ending MRR = $2.15M
The company grows MRR despite losing 5% of its starting recurring base.
Revenue Churn and MRR Growth
Monthly recurring revenue growth shows the net change in the total MRR base.
Suppose:
Starting MRR = $1M
New MRR = $100K
Expansion MRR = $50K
Churned MRR = $80K
Contraction MRR = $20K
Ending MRR:
$1M + $100K + $50K − $80K − $20K
= $1.05M
MRR growth:
5%
But gross recurring-revenue loss is:
$100K
or:
10% of Starting MRR
The company grows 5%, but significant revenue leakage exists underneath the result.
Revenue Churn and Annual Recurring Revenue
The same principle applies to annual recurring revenue.
Suppose:
Starting ARR = $20M
Canceled contracts remove:
$1M ARR
Revenue churn rate:
$1M ÷ $20M × 100 = 5%
The business needs at least $1 million of new or expansion ARR simply to replace the canceled recurring value before achieving net ARR growth.
Revenue Churn and Average Revenue Per Account
Average revenue per account helps identify whether churn is concentrated among large or small accounts.
Suppose:
Starting ARPA = $1,000
The business loses many $200-per-month customers.
Revenue churn can remain relatively low even when logo churn is significant.
If instead several $10,000-per-month accounts leave, revenue churn can rise sharply.
Segmenting churn by customer value reveals more than a company-wide percentage.
Revenue Churn and Price Increases
A price increase percentage can increase recurring revenue from retained customers but may also trigger churn.
Suppose 1,000 customers pay $100 per month:
Starting MRR = $100,000
Price increases 10% to:
$110
If all customers remain:
MRR = $110,000
But suppose 100 customers cancel.
Remaining MRR:
900 × $110 = $99,000
Revenue lost from canceled customers at the new recurring price is substantial enough that total MRR falls below the original level.
A successful pricing strategy therefore depends on both higher realized revenue and customer response.
Price Increase With High-Value Churn
Suppose a company raises prices 5%.
Most small accounts stay, but one major enterprise customer leaves.
Logo retention may remain close to 100%.
Revenue churn can still rise sharply.
The pricing decision should therefore be evaluated by:
customer churn;
revenue churn;
GRR;
NRR;
ARPA;
and total recurring-revenue growth.
No single measure captures the entire effect.
Revenue Churn and Price Decreases
A price decrease percentage can potentially reduce cancellation-driven revenue churn if price sensitivity is causing customers to leave.
Suppose the business expects:
$100,000 of Recurring Revenue to Churn
at the existing price.
A targeted lower price reduces expected churn to:
$30,000
but also creates:
$40,000 of Contraction
among customers accepting the lower rate.
Total recurring revenue loss becomes:
$70,000
The intervention improves the result relative to the original $100,000 expected loss, even though contraction increases.
Customer behavior and net economics determine whether the lower price is worthwhile.
Discounts Can Shift Churn Into Contraction
A retention discount can convert a full cancellation into a partial revenue loss.
Suppose a customer paying:
$1,000 per Month
plans to cancel.
Without intervention:
Revenue Churn = $1,000 MRR
The company offers a 20% discount and the customer remains at:
$800 MRR
Now:
Customer Churn = $0
Full Churned Revenue = $0
Contraction = $200
The business preserves $800 of recurring revenue.
From a GRR perspective, however, $200 of the starting revenue is still lost.
Revenue Churn and CAC Payback
Revenue churn is particularly damaging when customers leave before completing their CAC payback period.
Suppose:
CAC = $2,400
Monthly Gross Contribution = $200
Expected payback:
12 Months
A customer who churns after six months generates only:
6 × $200 = $1,200
of gross contribution.
Half of the acquisition investment remains unrecovered.
Churn therefore affects both recurring revenue and acquisition economics.
Revenue Churn and Lifetime Value to CAC
Higher recurring revenue churn usually reduces customer lifetime value.
Suppose the lifetime value to cac ratio is initially:
4:1
because customers are expected to remain for several years.
If revenue churn rises substantially, projected lifetime gross profit can decline.
If LTV falls from $8,000 to $5,000 while CAC remains $2,000:
Original:
4:1
New:
2.5:1
The acquisition cost has not changed.
Customer value has deteriorated because recurring revenue is less durable.
Revenue Churn and Sales Efficiency
Sales efficiency should be evaluated alongside revenue churn because the sales organization can appear productive while the existing revenue base leaks rapidly.
Suppose sales generates:
$2M of New ARR
but customer churn removes:
$1.5M
Net ARR growth:
$500K
The acquisition engine is producing substantial new revenue, yet much of that effort is merely replacing lost recurring value.
Reducing churn can sometimes improve net growth more efficiently than increasing acquisition spending further.
Revenue Churn and the Rule of 40
The rule of 40 combines a growth measure with profitability.
Revenue churn can weaken the growth side of that equation.
Suppose recurring revenue would have grown 25% before customer losses, but churn and contraction reduce realized growth to 15%.
If profitability is unchanged, the lower growth rate directly reduces the Rule of 40 score.
Retention therefore influences not only customer metrics but broader growth-quality assessments.
Revenue Churn and Quarter-Over-Quarter Growth
Quarter-over-quarter growth can be suppressed by recurring revenue churn.
Suppose:
New and Expansion Revenue Adds $3M
but:
Revenue Churn Removes $2M
Net recurring increase:
$1M
The company may report modest QoQ growth despite strong gross additions.
Breaking the quarterly movement into additions and losses shows whether growth is being constrained by acquisition or retention.
Revenue Churn Can Increase While Revenue Grows
Suppose:
Starting MRR = $1M
Churned MRR = $100K
Revenue churn:
10%
New and expansion MRR:
$300K
Ending MRR:
$1.2M
Total MRR grows:
20%
The company grows strongly while losing 10% of its starting recurring base.
Growth does not prove retention is healthy.
Revenue Churn Can Decline While Total Revenue Falls
Suppose revenue churn improves from 8% to 3%, but new customer acquisition collapses.
The existing base becomes more durable, yet total company revenue can decline if new additions are insufficient.
Churn measures revenue preservation, not overall growth.
Retention and acquisition must be analyzed together.
Revenue Churn by Customer Segment
Company-wide churn can hide major variation.
Suppose:
| Segment | Starting MRR | Churned MRR | Revenue Churn |
|---|---|---|---|
| Small Business | $200K | $20K | 10% |
| Mid-Market | $300K | $15K | 5% |
| Enterprise | $500K | $10K | 2% |
Total starting MRR:
$1M
Total churned MRR:
$45K
Company-wide revenue churn:
4.5%
The headline percentage hides a serious small-business retention problem.
Segment-level churn can make remediation more targeted.
Revenue Churn by Acquisition Channel
Suppose customers acquired through:
Paid social:
Revenue Churn = 9%
Organic search:
4%
Partner referrals:
2%
A channel producing inexpensive customers can still be unattractive if those customers generate unstable recurring revenue.
Acquisition-channel analysis should therefore extend beyond CAC to retention and lifetime economics.
Revenue Churn by Customer Tenure
Revenue loss often varies by customer age.
Suppose:
First 90 days:
Revenue Churn = 8%
Customers older than one year:
2%
That pattern can indicate weak onboarding, poor initial customer qualification, or a mismatch between sales promises and product value.
A company-wide average can hide where the actual problem occurs.
Revenue Churn by Contract Type
Monthly contracts may exhibit different churn from annual contracts.
Suppose:
Monthly plans:
Revenue Churn = 6% per Month
Annual contracts at renewal:
Lower Monthly Equivalent Churn
The difference can reflect customer commitment, switching friction, pricing, segment mix, or simply the opportunity to cancel.
Contract structure should therefore be considered before comparing churn percentages.
Revenue Churn and Customer Concentration
Revenue churn can be volatile when a few customers represent a large portion of recurring revenue.
Suppose:
Starting ARR = $10M
One customer contributes:
$2M
If that account cancels:
Revenue Churn = 20%
even if every other customer remains.
A concentrated revenue base can therefore produce low logo churn and extremely high revenue churn simultaneously.
Monthly Revenue Churn
Suppose:
Starting MRR = $500K
Churned MRR During Month = $15K
Monthly revenue churn:
3%
Monthly rates are useful for quickly detecting changes.
However, a single month can be noisy because of renewal timing, seasonal cancellations, large-account events, or billing issues.
Quarterly Revenue Churn
Suppose a quarter begins with:
$5M of Recurring Revenue
Starting customers that cancel during the quarter remove:
$300K
Quarterly revenue churn:
6%
If another $100K contracts, a broader gross revenue churn measure would be:
($300K + $100K) ÷ $5M
= 8%
The calculation must state whether contraction is included.
Annualizing Monthly Revenue Churn
A monthly churn rate should not simply be multiplied by 12 when estimating a compounded annual outcome.
Suppose the recurring base loses 2% of its remaining revenue every month with no expansion or new revenue.
Monthly retention factor:
98%
After 12 months:
0.98¹² ≈ 78.47%
Implied cumulative churn:
1 − 78.47% ≈ 21.53%
Simple multiplication would give:
24%
Compounding produces a different result because each month’s loss is applied to the remaining base.
Revenue Churn Trend Example
Suppose monthly revenue churn is:
| Month | Revenue Churn |
|---|---|
| January | 6.0% |
| February | 5.5% |
| March | 4.5% |
| April | 3.8% |
| May | 3.0% |
The rate improves by:
3 Percentage Points
from January to May.
Relative reduction:
(6% − 3%) ÷ 6% × 100 = 50%
The business cut its monthly revenue churn rate in half.
The next question is whether the improvement came from lower customer cancellations, smaller accounts churning, stronger onboarding, contract changes, or another factor.
What Is a Good Revenue Churn Rate?
There is no universal percentage.
An appropriate level depends on:
- customer segment;
- contract duration;
- pricing;
- natural customer lifecycle;
- account concentration;
- product maturity;
- expansion opportunity;
- switching costs; and
- measurement period.
A low-price monthly consumer service and a multi-year enterprise software contract should not be expected to have identical churn patterns.
The most useful comparison is generally with comparable customer cohorts and the company’s own historical trend.
How to Reduce Revenue Churn
Reducing revenue churn begins with identifying where recurring value is being lost.
Potential improvements include:
better customer qualification;
stronger onboarding;
faster time to value;
improved product reliability;
proactive account management;
better renewal processes;
appropriate pricing;
payment recovery;
and early intervention when usage or engagement declines.
The highest-impact approach depends on why customers are canceling.
Common Revenue Churn Mistakes
A common mistake is calculating revenue churn using ending recurring revenue as the denominator instead of the starting base.
Another is confusing revenue churn with customer churn.
Businesses can also mix full cancellations and contraction inconsistently between periods.
Another mistake is subtracting expansion from churn and then reporting only the net amount as churn.
New customer revenue should not reduce the churn rate.
Monthly percentages should not be annualized by simple multiplication when compounding matters.
Finally, low revenue churn does not guarantee profitability or efficient acquisition.
Frequently Asked Questions
What is revenue churn in simple terms?
Revenue churn measures the percentage of starting recurring revenue lost when existing customers cancel or, under broader definitions, reduce their recurring spending.
What is the revenue churn formula?
For complete cancellations:
Revenue Churn Rate = Churned Recurring Revenue ÷ Starting Recurring Revenue × 100
How do you calculate revenue churn?
If starting MRR is $500,000 and canceled customers remove $25,000:
$25,000 ÷ $500,000 × 100 = 5%
Does revenue churn include downgrades?
It depends on the metric definition. A narrow churn measure may include only full cancellations, while gross revenue churn can include both churn and contraction. The methodology should be labeled and applied consistently.
Is revenue churn the same as customer churn?
No.
Customer churn measures customers lost by count.
Revenue churn measures recurring revenue lost.
Can customer churn be low while revenue churn is high?
Yes.
Losing a small number of very large customers can create low customer-count churn and high revenue churn.
Can customer churn be high while revenue churn is low?
Yes.
Losing many small accounts can have limited recurring-revenue impact.
Is revenue churn the opposite of GRR?
Gross revenue churn and GRR can be complements when both use matching definitions:
GRR = 100% − Gross Revenue Churn
Does expansion revenue reduce revenue churn?
No.
Expansion can offset churn in NRR or total recurring growth, but the original revenue loss still occurred.
Can NRR exceed 100% while revenue churn is positive?
Yes.
Existing customers can expand enough to more than replace recurring revenue lost through churn and contraction.
How does revenue churn affect MRR growth?
Churn removes recurring revenue that new and expansion MRR must replace before the total MRR base can grow.
How does revenue churn affect CAC payback?
Customers who churn before acquisition cost is recovered can leave part of CAC unrecovered.
How does revenue churn affect LTV:CAC?
Higher churn generally reduces expected customer lifetime value and can weaken LTV:CAC if acquisition cost remains unchanged.
Can a price increase increase revenue churn?
Yes.
If customers respond to higher prices by canceling, recurring revenue lost to churn can increase.
Can a price decrease reduce revenue churn?
Potentially.
Lower pricing may retain price-sensitive customers, although it can create revenue contraction and weaker margins.
Why track revenue churn with sales efficiency?
A company can acquire new revenue efficiently while losing too much existing revenue. Combining both measures shows whether commercial spending is building on a durable recurring base.
Why is revenue churn important?
Revenue churn quantifies how much recurring value is leaking from an existing customer base. Combined with customer churn, GRR, NRR, MRR growth, pricing, and acquisition economics, it helps determine whether growth is durable or continually replacing revenue that disappears.




