

Mean Absolute Deviation: Definition, Formula & Example

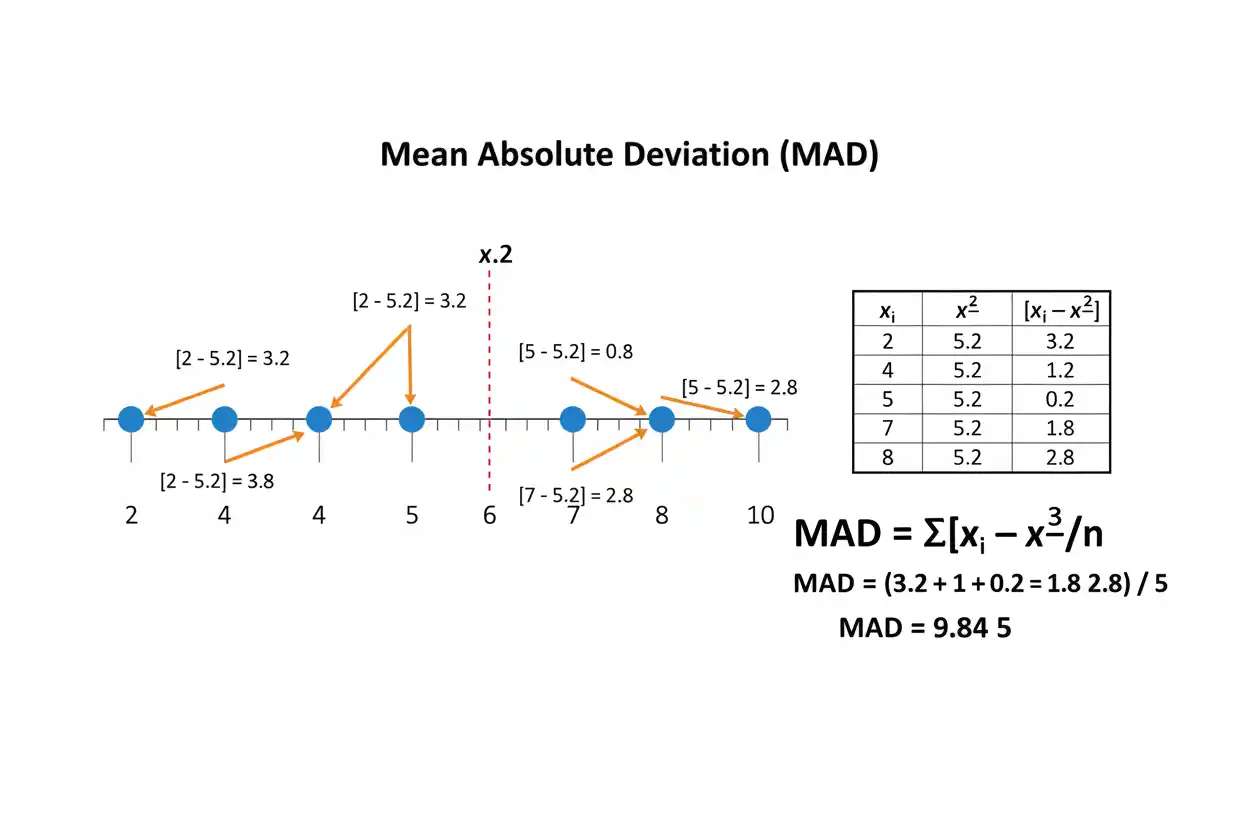
Mean absolute deviation is a measure of statistical dispersion that describes the average absolute distance between observations and a chosen center, most commonly the arithmetic mean. It is calculated by finding the mean of the data, measuring how far each observation lies from that mean without keeping positive or negative signs, and then averaging those absolute deviations. Because absolute values prevent deviations on opposite sides of the center from cancelling, mean absolute deviation provides an intuitive answer to the question: How far, on average, are the observations from the mean? Unlike variance, it does not square deviations, so its result remains in the same units as the original data. Mean absolute deviation is still affected by extreme observations because both the mean and the absolute distances respond to unusually large or small values, but it is generally less dominated by extreme deviations than a squared-error measure. It can be calculated for individual observations, frequency distributions, weighted data, and probability distributions, provided the relevant absolute expectation exists. The term should also be distinguished carefully from median absolute deviation, which uses the median in a different way and has different robustness properties.
Mean absolute deviation belongs to the descriptive measures of variability within core statistics and the broader Statistics & Probability framework. Its calculation begins with the arithmetic mean, but its purpose is to measure spread rather than central location.
What Is Mean Absolute Deviation?
Mean absolute deviation measures the average distance of observations from a specified center using absolute values.
When the arithmetic mean is used as the center, the sample formula is:
MAD = Σ|xᵢ − x̄|/n
where:
- MAD = mean absolute deviation
- xᵢ = individual observation
- x̄ = sample mean
- n = number of observations
- |xᵢ − x̄| = absolute deviation from the mean
The word absolute is essential.
Ordinary signed deviations from the mean satisfy:
Σ(xᵢ − x̄) = 0
so directly averaging signed deviations always gives zero.
Taking absolute values converts every distance into a nonnegative number:
|xᵢ − x̄| ≥ 0
Those distances can then be averaged meaningfully.
Mean Absolute Deviation Formula
For sample observations:
x₁, x₂, …, xₙ
first calculate:
x̄ = Σxᵢ/n
Then calculate:
MAD = Σ|xᵢ − x̄|/n
For a finite population with mean μ:
MADpopulation = Σ|xᵢ − μ|/N
where:
- μ = population mean
- N = population size
Unlike the familiar sample variance formula, descriptive sample mean absolute deviation typically divides by:
n
rather than:
n − 1
because the statistic is literally the arithmetic average of the observed absolute distances from the sample mean.
There are inferential questions surrounding estimation of population absolute deviation, but the basic descriptive calculation does not use a Bessel-style n − 1 correction.
Mean Absolute Deviation Example
Consider:
2, 4, 6, 8, 10
We will calculate the mean absolute deviation about the arithmetic mean.
Step 1: Calculate the Mean
x̄ = (2 + 4 + 6 + 8 + 10)/5
x̄ = 30/5
x̄ = 6
Step 2: Calculate Deviations From the Mean
| x | x − x̄ |
|---|---|
| 2 | −4 |
| 4 | −2 |
| 6 | 0 |
| 8 | 2 |
| 10 | 4 |
The signed deviations sum to:
−4 − 2 + 0 + 2 + 4 = 0
That is why signed deviations cannot simply be averaged to measure spread.
Step 3: Take Absolute Values
| x | |x − x̄| |
|—:|—:|
| 2 | 4 |
| 4 | 2 |
| 6 | 0 |
| 8 | 2 |
| 10 | 4 |
The total absolute deviation is:
4 + 2 + 0 + 2 + 4 = 12
Step 4: Divide by the Number of Observations
MAD = 12/5
MAD = 2.4
Therefore, the mean absolute deviation is:
2.4
The observations are, on average, 2.4 units away from their arithmetic mean.
Interpreting Mean Absolute Deviation
Suppose a data set has:
Mean = 50
and:
Mean absolute deviation = 6
The most direct interpretation is:
Observations are an average absolute distance of 6 units from the mean.
The result does not imply that every observation is exactly six units away.
Some may be close to the center, while others are much farther away.
The mean absolute deviation compresses those individual absolute distances into one average measure of dispersion.
Because it remains in the original units, its interpretation is usually more immediate than a variance expressed in squared units.
Why Signed Deviations Cannot Measure Spread Directly
Suppose the data are:
3, 5, 7
The mean is:
x̄ = 5
The deviations are:
−2, 0, 2
Their average is:
(−2 + 0 + 2)/3 = 0
Yet the data clearly have nonzero spread.
This cancellation occurs for every data set when deviations are taken from the arithmetic mean:
Σ(xᵢ − x̄) = 0
Mean absolute deviation solves the problem by replacing each signed deviation with its magnitude:
2, 0, 2
The average is then:
4/3 ≈ 1.333
which reflects actual dispersion.
Why Absolute Values Are Used
The absolute-value function treats deviations in both directions equally.
For example:
|−5| = 5
and:
|5| = 5
Therefore, an observation five units below the mean contributes exactly the same absolute distance as an observation five units above it.
This is appropriate when the goal is to measure distance rather than direction.
Mean absolute deviation therefore focuses on:
How far?
rather than:
Above or below?
Direction is removed intentionally.
Mean Absolute Deviation Is Always Nonnegative
Because every absolute deviation satisfies:
|xᵢ − x̄| ≥ 0
their sum is nonnegative.
Therefore:
MAD ≥ 0
Mean absolute deviation can never be negative.
If a calculation produces:
MAD < 0
an arithmetic or formula error has occurred.
When Does Mean Absolute Deviation Equal Zero?
Mean absolute deviation equals zero only when every observation equals the mean.
Suppose:
MAD = 0
Then:
Σ|xᵢ − x̄| = 0
A sum of nonnegative quantities can equal zero only if every term equals zero.
Therefore:
|xᵢ − x̄| = 0
for every observation, which means:
xᵢ = x̄
for all i.
For example:
7, 7, 7, 7
has:
x̄ = 7
and:
MAD = 0
There is no variability.
Example With Decimal Values
Consider:
1.5, 2.0, 3.0, 5.5
First calculate the mean:
x̄ = (1.5 + 2 + 3 + 5.5)/4
x̄ = 12/4
x̄ = 3
Absolute deviations are:
|1.5 − 3| = 1.5
|2 − 3| = 1
|3 − 3| = 0
|5.5 − 3| = 2.5
Their sum is:
1.5 + 1 + 0 + 2.5 = 5
Therefore:
MAD = 5/4
MAD = 1.25
The observations are an average absolute distance of 1.25 units from the mean.
Example With Negative Values
Consider:
−5, −1, 1, 5
The mean is:
x̄ = 0
Absolute deviations are:
5, 1, 1, 5
Therefore:
MAD = (5 + 1 + 1 + 5)/4
MAD = 12/4
MAD = 3
Negative observations cause no special difficulty.
The absolute-value calculation naturally converts signed differences into nonnegative distances.
Mean Absolute Deviation and Data Units
Mean absolute deviation has the same measurement units as the original variable.
If observations are measured in:
seconds
then the result is also measured in seconds.
If data are measured in:
kilograms
the result is in kilograms.
If observations are monetary values:
MAD
is expressed in the same currency units.
This is one of its most intuitive properties.
By contrast, a variance is expressed in squared units.
Mean Absolute Deviation vs Variance
Mean absolute deviation and variance both quantify spread around a center, but they use different loss functions.
Mean absolute deviation uses:
|xᵢ − x̄|
Variance uses:
(xᵢ − x̄)²
The main distinction is:
Mean absolute deviation → absolute distances
Variance → squared distances
Squaring increases the influence of large deviations much more strongly.
For example:
deviation = 2 → absolute contribution = 2, squared contribution = 4
deviation = 10 → absolute contribution = 10, squared contribution = 100
The larger deviation is five times as large in absolute-distance terms but twenty-five times as large in squared-distance terms.
The broader relationship between center and squared dispersion is treated separately in mean and variance.
Mean Absolute Deviation vs Standard Deviation
Standard deviation is the square root of variance.
It therefore returns dispersion to the original measurement units, just as mean absolute deviation does.
However, their calculations remain fundamentally different.
Mean absolute deviation averages:
|xᵢ − x̄|
Standard deviation is based on:
√[average or adjusted average of (xᵢ − center)²]
Because squared deviations penalize large errors more heavily, standard deviation is generally more sensitive to extreme values.
Mean absolute deviation often has a more direct interpretation:
average distance from the mean
while standard deviation is mathematically central to normal distributions, least-squares methods, standard errors, and many inferential procedures.
Example Comparing Absolute and Squared Deviations
Consider deviations:
−1, 0, 1, 8
Absolute magnitudes are:
1, 0, 1, 8
Their total is:
10
Squared deviations are:
1, 0, 1, 64
Their total is:
66
The extreme deviation of eight dominates the squared calculation much more strongly.
This difference is one reason squared-error methods react more dramatically to extreme observations.
Mean Absolute Deviation and Outliers
Mean absolute deviation is not immune to outliers.
Consider:
2, 4, 6, 8, 10
We found:
Mean = 6
MAD = 2.4
Now replace 10 with 100:
2, 4, 6, 8, 100
The new mean is:
x̄ = 120/5
x̄ = 24
Absolute deviations are:
|2 − 24| = 22
|4 − 24| = 20
|6 − 24| = 18
|8 − 24| = 16
|100 − 24| = 76
Their total is:
152
Therefore:
MAD = 152/5
MAD = 30.4
The mean absolute deviation increases dramatically.
This happens partly because the extreme observation is far from the mean and partly because the outlier moves the mean itself.
Mean Absolute Deviation Is Not Fully Robust
Absolute deviations are less aggressively affected by large errors than squared deviations, but mean absolute deviation about the arithmetic mean still depends on a non-robust center.
An extreme observation can move:
x̄
substantially.
That movement changes the absolute deviation of every observation, not just the outlier.
Therefore, mean absolute deviation should not be described as completely resistant to extreme observations.
If robust center-and-spread analysis is required, statistics based on the median may be more appropriate.
Mean Absolute Deviation vs Median Absolute Deviation
The phrase mean absolute deviation should not be confused with median absolute deviation.
Mean absolute deviation about the mean is:
Mean AD = mean(|xᵢ − x̄|)
Median absolute deviation is commonly:
Median AD = median(|xᵢ − median(x)|)
The first statistic:
- uses the arithmetic mean as center,
- averages the absolute distances.
The second:
- uses the median as center,
- takes the median of the absolute distances.
These are different statistics.
Median absolute deviation is substantially more resistant to extreme observations.
When the abbreviation MAD is used, the surrounding definition should therefore be checked carefully because different sources use MAD for different absolute-deviation measures.
Mean, Median, and Absolute Distance
An important optimization distinction is often overlooked.
The arithmetic mean minimizes the sum of squared deviations:
Σ(xᵢ − c)²
over choices of c.
The median minimizes the sum of absolute deviations:
Σ|xᵢ − c|
over choices of c.
Therefore, although mean absolute deviation is often calculated about the mean, the arithmetic mean is not generally the center that minimizes total absolute distance.
This distinction connects the measure with the broader comparison of mean, median, and mode.
Example: Mean Does Not Minimize Absolute Deviation
Consider:
0, 0, 0, 10
The arithmetic mean is:
x̄ = 2.5
Total absolute distance from the mean is:
|0 − 2.5| + |0 − 2.5| + |0 − 2.5| + |10 − 2.5|
= 2.5 + 2.5 + 2.5 + 7.5
= 15
A median is:
0
Total absolute distance from zero is:
0 + 0 + 0 + 10
= 10
Thus, the mean does not minimize absolute-distance loss.
This does not make mean absolute deviation incorrect. It simply means its center is chosen for a different reason than absolute-error minimization.
Mean Absolute Deviation From a Frequency Table
When values have frequencies, mean absolute deviation can be calculated without writing every observation individually.
Suppose:
| x | Frequency f |
|---|---|
| 2 | 2 |
| 5 | 3 |
| 8 | 1 |
Total frequency:
n = 2 + 3 + 1
n = 6
Calculate the mean:
x̄ = Σfx/Σf
x̄ = [2(2) + 3(5) + 1(8)]/6
x̄ = (4 + 15 + 8)/6
x̄ = 27/6
x̄ = 4.5
Now calculate weighted absolute deviations:
f|x − x̄|
For x = 2:
2|2 − 4.5| = 2(2.5) = 5
For x = 5:
3|5 − 4.5| = 3(0.5) = 1.5
For x = 8:
1|8 − 4.5| = 3.5
Total:
5 + 1.5 + 3.5 = 10
Therefore:
MAD = 10/6
MAD ≈ 1.667
Frequency Formula
For values xᵢ with frequencies fᵢ:
x̄ = Σfᵢxᵢ / Σfᵢ
Then:
MAD = Σfᵢ|xᵢ − x̄| / Σfᵢ
Frequency serves as a weight because a value occurring ten times should contribute ten times as much as a value occurring once.
This formula is equivalent to expanding the frequency table into the complete observation list and applying the ordinary calculation.
Weighted Mean Absolute Deviation
A more general weighted mean absolute deviation can be defined as:
MADw = Σwᵢ|xᵢ − μw| / Σwᵢ
where the weighted mean is:
μw = Σwᵢxᵢ/Σwᵢ
and weights satisfy suitable conditions, commonly:
wᵢ ≥ 0
This can be useful when observations represent unequal population amounts, survey weights, or other intentionally weighted quantities.
However, the interpretation depends on what the weights mean.
Arbitrary weighting changes the statistic being summarized.
Mean Absolute Deviation for Grouped Continuous Data
If only class intervals and frequencies are available, class midpoints can be used to approximate the mean and mean absolute deviation.
Suppose the classes are:
| Interval | Midpoint m | Frequency f |
|---|---|---|
| 0–10 | 5 | 3 |
| 10–20 | 15 | 5 |
| 20–30 | 25 | 2 |
First estimate:
x̄ ≈ Σfm/Σf
Then calculate:
MAD ≈ Σf|m − x̄|/Σf
The result is approximate because every observation inside a class is being represented by the class midpoint.
The wider the classes and the more unevenly values are distributed within them, the less exact the approximation may be.
Mean Absolute Deviation for a Probability Distribution
For a discrete random variable X with population mean:
μ = E(X)
the mean absolute deviation about μ is:
E|X − μ|
For a discrete distribution:
MAD = Σ|x − μ|P(X = x)
provided the expectation exists.
For a continuous variable with density f(x):
MAD = ∫|x − μ|f(x) dx
when the integral is finite.
Thus, mean absolute deviation is not restricted to finite observed samples. It can also describe theoretical distributions.
Probability Example
Suppose X takes values:
0, 1, 2
with probabilities:
P(X = 0) = 0.25
P(X = 1) = 0.50
P(X = 2) = 0.25
The mean is:
μ = 0(0.25) + 1(0.50) + 2(0.25)
μ = 1
The mean absolute deviation is:
E|X − 1|
= |0 − 1|(0.25) + |1 − 1|(0.50) + |2 − 1|(0.25)
= 1(0.25) + 0 + 1(0.25)
= 0.50
Therefore:
MAD = 0.5
Mean Absolute Deviation of a Normal Distribution
If:
X ~ N(μ, σ²)
then the mean absolute deviation about μ is:
E|X − μ| = σ√(2/π)
Numerically:
√(2/π) ≈ 0.7979
so:
MAD ≈ 0.7979σ
Equivalently:
σ ≈ MAD/0.7979
σ ≈ 1.2533 MAD
This relationship is specific to a normal distribution.
It should not be treated as a universal conversion between mean absolute deviation and standard deviation.
Different distributions produce different relationships.
Comparing Two Data Sets With Mean Absolute Deviation
Suppose:
Data A: Mean = 50, MAD = 3
Data B: Mean = 50, MAD = 12
Both distributions have the same arithmetic center.
However, Data B has observations that lie much farther from the mean on average.
Its mean absolute deviation is four times larger:
12/3 = 4
Therefore, Data B exhibits considerably greater absolute dispersion around its center.
Same Mean Absolute Deviation, Different Shapes
A single mean absolute deviation cannot describe an entire distribution.
Two data sets can share the same mean and the same mean absolute deviation while differing in:
- skewness,
- tail behavior,
- clusters,
- maximum values,
- minimum values,
- multimodality.
Mean absolute deviation is therefore a summary statistic.
A full distributional analysis may require plots, quantiles, additional spread measures, and context.
Mean Absolute Deviation and Linear Transformations
Suppose:
Y = aX + b
where a and b are constants.
The mean transforms as:
ȳ = ax̄ + b
Absolute deviations become:
|Yᵢ − ȳ|
= |aXᵢ + b − (ax̄ + b)|
= |a(Xᵢ − x̄)|
= |a||Xᵢ − x̄|
Therefore:
MAD(Y) = |a|MAD(X)
Adding b does not change mean absolute deviation.
Multiplying the variable by a scales the result by:
|a|
Effect of Adding a Constant
Suppose data have:
MAD = 5
Add 100 to every observation.
The mean also increases by 100, so every deviation from the new mean remains unchanged.
Therefore:
New MAD = 5
Changing location does not change spread.
This matches the intuitive idea that moving an entire distribution left or right does not alter the distances among its observations.
Effect of Multiplying by a Constant
Suppose:
MAD(X) = 4
and define:
Y = 3X
Then:
MAD(Y) = 3(4)
MAD(Y) = 12
If instead:
Y = −3X
we still obtain:
MAD(Y) = |−3|(4)
= 12
The negative sign reverses the data scale but absolute distances are multiplied by three.
Mean Absolute Deviation and Unit Conversion
Suppose measurements in meters have:
MAD = 0.25 m
Convert each observation to centimeters:
1 m = 100 cm
Then:
MAD = 0.25 × 100
MAD = 25 cm
The dispersion has not changed physically.
Only the numerical measurement scale changed.
This demonstrates why mean absolute deviation remains in the same units as the variable.
Mean Absolute Deviation in Linear Regression
In linear regression, ordinary least squares minimizes squared residuals:
Σ(yᵢ − ŷᵢ)²
Another useful descriptive prediction-error measure is the mean absolute error:
MAE = Σ|yᵢ − ŷᵢ|/n
This resembles mean absolute deviation mathematically, but the center differs.
For descriptive mean absolute deviation:
reference = x̄
For regression MAE:
reference = model prediction ŷᵢ
Thus, the two measures should not be treated as synonyms.
One summarizes dispersion around a center; the other summarizes predictive residual size.
Mean Absolute Deviation in Logarithmic Regression
A fitted logarithmic regression has predictions such as:
ŷ = a + b ln(x)
Its residuals are:
eᵢ = yᵢ − ŷᵢ
A mean absolute residual can then be calculated:
MAE = Σ|eᵢ|/n
This can supplement squared-error statistics by reporting prediction error directly in response units.
Again, that regression MAE is conceptually different from calculating mean absolute deviation of the original y observations around:
ȳ
The mathematical use of absolute values is similar, but the reference values are different.
Mean Absolute Deviation vs Interquartile Range
Both mean absolute deviation and interquartile range can describe spread in the original units.
However, they use the observations very differently.
Mean absolute deviation uses every data value through:
|xᵢ − x̄|
The interquartile range uses:
Q₃ − Q₁
and focuses on the middle 50% of ordered observations.
Consequently, an isolated extreme value can substantially affect mean absolute deviation while having no effect on the IQR if Q₁ and Q₃ remain unchanged.
For highly skewed or outlier-heavy data, the IQR is often the more robust descriptive measure.
Mean Absolute Deviation vs Range
The range is:
Maximum − Minimum
It depends only on two observations.
Mean absolute deviation uses every observation.
Suppose a sample contains one extreme maximum.
The range may become enormous even if every other observation is tightly grouped.
Mean absolute deviation also increases, but its result reflects absolute distances averaged across the full sample.
Therefore:
Range → total endpoint spread
Mean absolute deviation → average distance from the mean
These are different descriptions of variability.
Mean Absolute Deviation and Sample Size
Mean absolute deviation does not automatically increase or decrease as sample size grows.
Its value depends on the actual distribution of observations.
A larger random sample from the same stable population may provide a more reliable estimate of population mean absolute deviation, but the numerical statistic can move upward or downward from one sample to another.
Adding one extreme observation to a small sample can have a large effect.
The same observation generally has proportionally less influence in a much larger sample, although sufficiently extreme values can still matter substantially.
Updating Mean Absolute Deviation Is Not Simple
The arithmetic mean can be updated easily when a new observation is added:
x̄new = (nx̄old + xnew)/(n + 1)
Mean absolute deviation is harder to update from a single summary statistic.
Why?
Because adding a new observation changes the mean.
Once the mean changes, the absolute deviation:
|xᵢ − x̄|
changes for potentially every existing observation.
Therefore, knowing only the old mean absolute deviation, old mean, and sample size is generally insufficient to reconstruct the exact new result.
The individual observations or additional distributional information may be required.
Mean Absolute Deviation and Missing Data
Missing observations should not be replaced with zero unless zero is the true measured value.
Suppose observed data are:
5, 7, missing, 9
Entering the missing observation as zero changes:
- the sample mean,
- every absolute deviation,
- the final mean absolute deviation.
If the calculation uses only complete observations, the sample size should correspond to the values actually included.
However, systematic missingness can bias both the estimated center and dispersion.
The correct approach depends on why the values are missing.
Mean Absolute Deviation and Rounding
Rounding the mean too early can alter every subsequent absolute deviation.
Suppose the exact mean is:
x̄ = 4.376
If it is rounded immediately to:
4.4
then every calculation:
|xᵢ − x̄|
uses a slightly different center.
For high-precision work, retain additional digits through intermediate steps and round the final mean absolute deviation appropriately.
This is especially important when observations are close together or when many values are included.
Is Mean Absolute Deviation Less Than Standard Deviation?
For a collection of deviations treated with consistent averaging, the root mean square of absolute deviations is at least as large as their arithmetic mean.
This produces the general relationship:
Mean absolute deviation about the mean ≤ population-form root mean square deviation
For a population-style calculation, that root mean square deviation is the population standard deviation.
Thus:
MAD ≤ σ
when both are calculated from the same finite data set using divisor n.
Equality occurs only under particular structures where all absolute deviations have the same magnitude.
Care is needed when comparing sample MAD with sample standard deviation using the n − 1 denominator because the divisor conventions differ.
Why Mean Absolute Deviation Is Intuitive
Suppose someone says:
Standard deviation = 7.4
That number is in the original units after taking a square root, but its construction depends on squared deviations.
By contrast:
Mean absolute deviation = 5.8
can be explained directly as:
The observations lie an average of 5.8 units from the arithmetic mean.
This straightforward distance interpretation can make mean absolute deviation useful in descriptive communication.
Its simplicity does not mean it replaces variance or standard deviation in every statistical method.
Advantages of Mean Absolute Deviation
Mean absolute deviation has several useful features.
It is easy to calculate conceptually.
It remains in the original measurement units.
It uses every observation.
It does not suffer from cancellation of positive and negative deviations.
It penalizes extreme errors linearly rather than quadratically.
It has a direct interpretation as average absolute distance from a center.
These properties make it valuable for descriptive statistics and for understanding the broader idea of absolute-error measures.
Limitations of Mean Absolute Deviation
Mean absolute deviation also has limitations.
When calculated around the arithmetic mean, it remains sensitive to outliers.
Its absolute-value function is less algebraically convenient than squared deviations in many analytical derivations because the function is not differentiable at zero.
It is not as deeply embedded as variance in classical normal-theory inference, regression decompositions, and many probability formulas.
Its abbreviation can also create confusion with median absolute deviation.
Finally, one summary number cannot reveal distributional features such as skewness, multiple clusters, or tail structure.
Common Mean Absolute Deviation Mistakes
A frequent mistake is forgetting the absolute-value signs.
If signed deviations are averaged:
Σ(xᵢ − x̄)/n
the result is always:
0
and does not measure dispersion.
Another mistake is using:
n − 1
automatically because sample variance uses that denominator. The ordinary descriptive mean absolute deviation is the average of n observed absolute distances and typically uses:
n
Another error is calculating absolute deviations before finding the correct mean.
It is also common to confuse mean absolute deviation with median absolute deviation.
Another mistake is interpreting mean absolute deviation as though every observation lies exactly that far from the mean.
Analysts can also describe the statistic as completely robust to outliers, which is incorrect when the arithmetic mean is its center.
Finally, regression mean absolute error and descriptive mean absolute deviation should not be treated as identical merely because both average absolute differences.
How to Calculate Mean Absolute Deviation Step by Step
A reliable manual procedure is:
Step 1: List the Observations
Write:
x₁, x₂, …, xₙ
Step 2: Calculate the Arithmetic Mean
x̄ = Σxᵢ/n
Step 3: Calculate Each Deviation
xᵢ − x̄
Step 4: Take the Absolute Value
|xᵢ − x̄|
Step 5: Add the Absolute Deviations
Σ|xᵢ − x̄|
Step 6: Divide by n
MAD = Σ|xᵢ − x̄|/n
Step 7: Report the Original Units
The result has the same units as the observations.
Step 8: Interpret the Result
Describe the statistic as the average absolute distance of observations from the arithmetic mean.
Full Worked Example
Consider:
3, 5, 6, 8, 13
Find the Mean
x̄ = (3 + 5 + 6 + 8 + 13)/5
x̄ = 35/5
x̄ = 7
Calculate Absolute Deviations
|3 − 7| = 4
|5 − 7| = 2
|6 − 7| = 1
|8 − 7| = 1
|13 − 7| = 6
Add Them
4 + 2 + 1 + 1 + 6 = 14
Divide by the Sample Size
MAD = 14/5
MAD = 2.8
Therefore:
Mean absolute deviation = 2.8
The observations are an average absolute distance of 2.8 units from their arithmetic mean of 7.
Comparing Two Samples
Suppose:
Sample A: Mean = 20, MAD = 2
Sample B: Mean = 20, MAD = 8
The two samples have the same center.
However, Sample B’s observations lie four times farther from the mean on average:
8/2 = 4
This does not reveal every aspect of either distribution, but it clearly shows that Sample B has greater absolute dispersion around the shared mean.
How to Report Mean Absolute Deviation
A clear report includes the center and the dispersion statistic.
For example:
Mean = 42.0 minutes; mean absolute deviation = 5.6 minutes.
An interpretation can be added:
Observations differed from the sample mean by 5.6 minutes on average in absolute terms.
If unusual observations or strong skewness are present, it may also be helpful to report robust statistics or a distribution plot rather than relying on mean absolute deviation alone.
Frequently Asked Questions About Mean Absolute Deviation
What is mean absolute deviation?
Mean absolute deviation is the average absolute distance between observations and a specified center, commonly the arithmetic mean.
What is the mean absolute deviation formula?
For sample data around the arithmetic mean:
MAD = Σ|xᵢ − x̄|/n
How do you calculate mean absolute deviation?
Calculate the mean, subtract it from every observation, take the absolute value of each difference, add those distances, and divide by the number of observations.
Why are absolute values necessary?
Signed deviations above and below the arithmetic mean cancel:
Σ(xᵢ − x̄) = 0
Absolute values prevent that cancellation.
Can mean absolute deviation be negative?
No.
MAD ≥ 0
because every absolute deviation is nonnegative.
When is mean absolute deviation zero?
Only when every observation equals the center, giving zero absolute deviation for every value.
What units does mean absolute deviation use?
It has the same units as the original variable.
Does sample mean absolute deviation divide by n or n − 1?
The ordinary descriptive statistic:
Σ|xᵢ − x̄|/n
uses n because it averages the n observed absolute deviations.
Is mean absolute deviation the same as standard deviation?
No. Mean absolute deviation averages absolute distances. Standard deviation is based on squared deviations and a square root.
Is mean absolute deviation the same as variance?
No. Variance averages or estimates squared deviations and therefore uses squared units.
Is mean absolute deviation affected by outliers?
Yes. Extreme observations affect both the arithmetic mean and the absolute distances from it.
Is mean absolute deviation robust?
It is less aggressively influenced by large deviations than squared-error measures, but mean absolute deviation around the arithmetic mean is not fully robust because the mean itself is sensitive to outliers.
Is mean absolute deviation the same as median absolute deviation?
No. Mean absolute deviation averages distances, commonly from the mean. Median absolute deviation takes the median of distances from the median.
Why can both statistics be called MAD?
The abbreviation is used inconsistently in some contexts. The formula or definition should always be checked.
Does the arithmetic mean minimize mean absolute deviation?
Not generally. The median minimizes the sum of absolute deviations. The arithmetic mean minimizes the sum of squared deviations.
How do you calculate mean absolute deviation from a frequency table?
Use:
MAD = Σfᵢ|xᵢ − x̄|/Σfᵢ
after calculating the frequency-weighted mean.
Can mean absolute deviation be calculated for a probability distribution?
Yes. For a random variable with mean μ:
MAD = E|X − μ|
when the expectation exists.
What is the mean absolute deviation of a normal distribution?
For:
X ~ N(μ, σ²)
the population mean absolute deviation about μ is:
σ√(2/π)
or approximately:
0.7979σ
How does adding a constant affect mean absolute deviation?
It does not.
If:
Y = X + b
then:
MAD(Y) = MAD(X)
How does multiplying all values affect it?
If:
Y = aX
then:
MAD(Y) = |a|MAD(X)
What is the difference between mean absolute deviation and mean absolute error?
Mean absolute deviation typically describes data dispersion around a center such as x̄. Mean absolute error commonly describes average absolute prediction error around fitted or forecast values.
Is a larger mean absolute deviation more variable?
When two data sets use the same measurement units and comparable centers or contexts, a larger value indicates greater average absolute dispersion from the chosen center.
Can two very different distributions have the same mean absolute deviation?
Yes. Mean absolute deviation is only one summary statistic and does not uniquely determine distribution shape, skewness, or tails.
When is mean absolute deviation useful?
It is useful when a direct, original-unit measure of average distance from a center is desired and absolute deviations provide a more interpretable description than squared deviations.




