


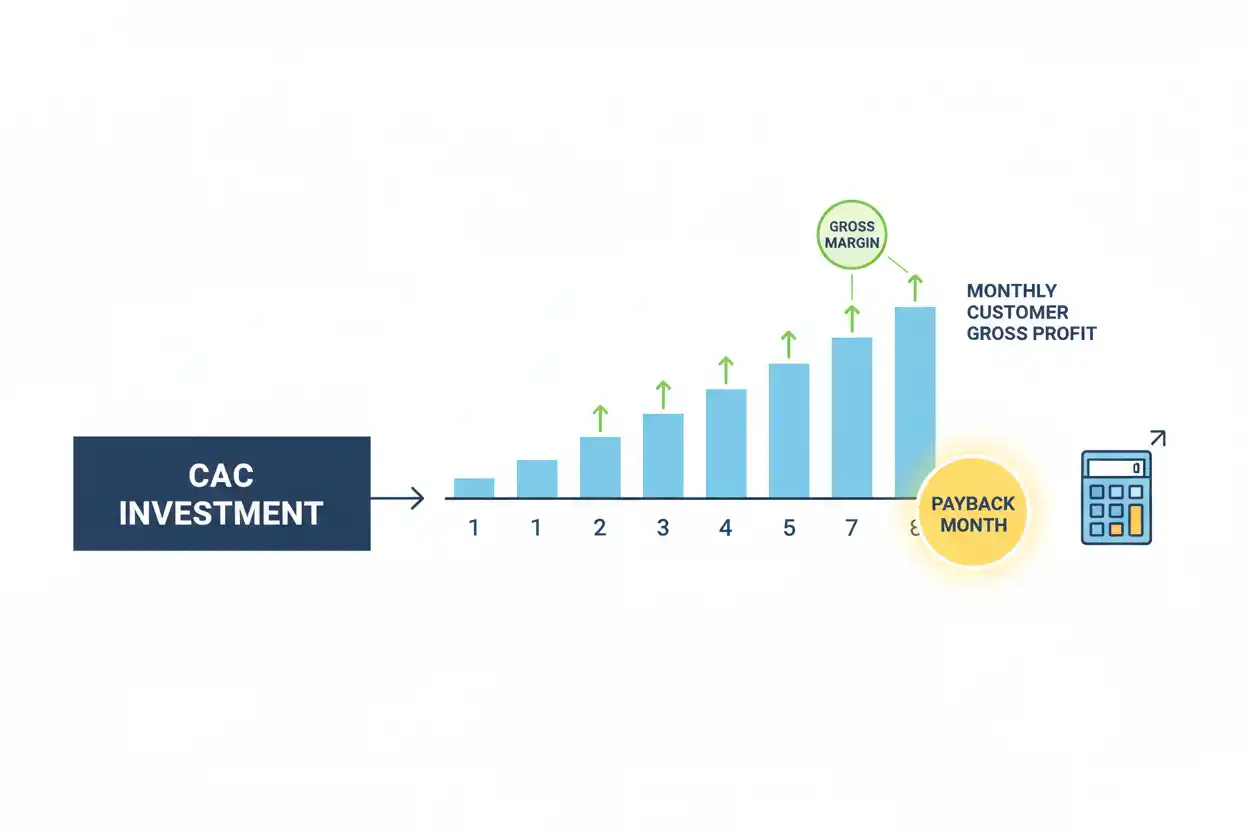
CAC payback period measures how long it takes for the gross profit or applicable contribution generated by an acquired customer to recover the amount spent to acquire that customer.
If customer acquisition cost is $1,800 and the customer generates $240 of monthly gross profit, CAC payback is 7.5 months.
CAC Payback Period = Customer Acquisition Cost ÷ Monthly Gross Profit per Customer
CAC Payback Period = $1,800 ÷ $240 = 7.5 Months
For recurring businesses, CAC payback helps answer a critical growth question:
How long must a newly acquired customer remain economically productive before the company earns back its acquisition investment?
Revenue alone should normally not be used in the denominator when substantial cost of revenue exists. Using gross profit or the appropriate contribution gives a more realistic picture of how quickly acquisition spending is recovered.
What Is CAC Payback Period?
CAC payback period connects acquisition spending with the economics generated after a customer is acquired.
Suppose a business spends $2,400 to acquire a customer.
The customer pays $500 per month.
At first glance, someone might calculate:
$2,400 ÷ $500 = 4.8 Months
But if the business retains only 60% of that revenue as gross profit, monthly gross profit is:
$500 × 60% = $300
A more economically meaningful simplified payback is:
$2,400 ÷ $300 = 8 Months
The difference is substantial.
The business collects $500 of revenue per month, but only $300 is available after the cost of delivering the product or service under this simplified gross-margin approach.
CAC Payback Period Formula
A common formula is:
CAC Payback Period in Months = CAC per Customer ÷ Monthly Gross Profit per Customer
When average monthly revenue per customer and gross margin are available:
Monthly Gross Profit per Customer = Monthly ARPA × Gross Margin %
Therefore:
CAC Payback Period = CAC ÷ (Monthly ARPA × Gross Margin %)
For a user-based business:
CAC Payback Period = CAC per User ÷ (Monthly ARPU × Gross Margin %)
The formula should use consistent customer units.
If CAC is calculated per account, use account-level economics.
If CAC is calculated per individual user, use user-level economics.
Mixing the two creates a meaningless result.
CAC Payback Period Example
Suppose a SaaS company has:
- CAC per new customer: $1,800
- Monthly average revenue per account: $300
- Gross margin: 80%
Monthly gross profit per customer:
$300 × 80% = $240
CAC payback:
$1,800 ÷ $240
CAC Payback = 7.5 Months
The company needs approximately seven and a half months of that customer’s modeled gross profit to recover the $1,800 acquisition investment.
If the customer churns after four months, the acquisition may not fully pay back under those economics.
If the customer remains and expands for several years, the acquisition can produce substantial value after payback.
CAC Payback With ARPU
For a user-based product, average revenue per user may be the more appropriate revenue input.
Suppose:
CAC per Paying User = $120
Monthly ARPU = $25
Gross Margin = 70%
Monthly gross profit per user:
$25 × 70% = $17.50
Payback:
$120 ÷ $17.50 ≈ 6.86 Months
The user acquisition investment is recovered in approximately 6.9 months under the simplified assumptions.
CAC Payback Using Annual Economics
CAC payback can also be calculated from annual gross profit and then converted into months.
Suppose:
CAC = $3,000
Annual Revenue per Customer = $6,000
Gross Margin = 75%
Annual gross profit:
$6,000 × 75% = $4,500
Payback in years:
$3,000 ÷ $4,500 ≈ 0.667 Years
Convert to months:
0.667 × 12 ≈ 8 Months
The result should match a monthly calculation when the underlying economics are stable and consistently normalized.
Why Gross Margin Matters
Gross margin prevents revenue from being mistaken for money available to recover CAC.
Suppose two businesses each generate $500 of monthly revenue per customer.
Company A has an 80% gross margin:
Monthly Gross Profit = $400
Company B has a 30% gross margin:
Monthly Gross Profit = $150
If CAC is $1,200 for both:
Company A:
$1,200 ÷ $400 = 3 Months
Company B:
$1,200 ÷ $150 = 8 Months
Their revenue per customer is identical.
Their payback economics are dramatically different because the cost of serving customers differs.
CAC Payback vs. Customer Acquisition Cost
Customer acquisition cost answers:
How much did it cost to acquire a customer?
CAC payback answers:
How long does customer gross profit take to recover that acquisition cost?
Suppose CAC declines from $2,000 to $1,500 while monthly customer gross profit stays at $250.
Original payback:
$2,000 ÷ $250 = 8 Months
New payback:
$1,500 ÷ $250 = 6 Months
Reducing acquisition cost shortens payback by two months.
CAC alone does not show how quickly the cost is recovered; the payback period combines acquisition cost with post-acquisition economics.
CAC Payback and Break-Even Price
Break-even price asks what selling price covers the relevant cost structure at a specified volume.
CAC payback addresses a different issue.
A customer’s recurring price can be above the operating break-even level while acquisition spending still takes a long time to recover.
Suppose:
Customer Price = $300 per Month
Ongoing Cost to Serve = $150
Monthly contribution before acquisition cost:
$150
If CAC is:
$3,000
Payback:
$3,000 ÷ $150 = 20 Months
The recurring price covers ongoing service economics, but customer acquisition requires nearly two years of contribution to repay.
CAC Payback and Average Revenue Per Account
ARPA is often an important input because many B2B businesses acquire accounts rather than individual users.
Suppose CAC remains $4,000.
At monthly ARPA of $500 and 80% gross margin:
Gross Profit = $400
Payback = $4,000 ÷ $400 = 10 Months
If ARPA increases to $625 with the same margin:
Gross Profit = $500
Payback = $4,000 ÷ $500 = 8 Months
Higher monetization shortens payback by two months, assuming retention and acquisition cost do not deteriorate.
CAC Payback and Average Revenue Per User
For consumer subscription businesses, ARPU can play the same role.
Suppose:
CAC = $60 per User
Monthly ARPU = $10
Gross Margin = 75%
Monthly gross profit:
$7.50
Payback:
$60 ÷ $7.50 = 8 Months
If ARPU increases to $12 while margin stays at 75%:
Monthly Gross Profit = $9
Payback = $60 ÷ $9 ≈ 6.67 Months
The higher monetization accelerates recovery of acquisition spending.
CAC Payback and Customer Churn
Customer churn determines whether customers stay long enough to reach payback.
Suppose payback is 12 months.
A customer who leaves after six months does not generate a full 12 months of contribution.
If monthly gross profit is $100:
Six-Month Gross Profit = $600
If CAC was $1,200:
Unrecovered CAC = $600
A high churn rate can therefore make a seemingly reasonable payback calculation overly optimistic if many customers disappear before the modeled recovery point.
Payback Must Be Shorter Than Customer Lifetime to Create Post-Payback Value
Suppose:
CAC Payback = 10 Months
and the average economically meaningful customer lifetime is only:
8 Months
The company will generally struggle to recover acquisition cost before the relationship ends under those assumptions.
If average lifetime is 36 months instead, the company can potentially generate substantial contribution after the first 10 months.
CAC payback should therefore be evaluated alongside retention rather than treated as an isolated acquisition metric.
CAC Payback and Revenue Churn
Revenue churn matters because customers can reduce the recurring revenue base even when customer-count churn appears moderate.
Suppose an enterprise customer starts at $1,000 of monthly revenue but contracts to $600 after three months.
A payback model assuming $1,000 every month will recover CAC too quickly on paper.
If gross margin is 80%:
Initial modeled monthly gross profit:
$800
After contraction:
$600 × 80% = $480
The real cumulative payback trajectory slows materially.
CAC Payback and Discount Percentage
A discount percentage can improve conversion but extend CAC payback.
Suppose:
Normal Monthly Price = $200
Gross Margin = 80%
Monthly gross profit:
$160
CAC:
$1,600
Normal payback:
$1,600 ÷ $160 = 10 Months
A 25% discount reduces price to:
$200 × 75% = $150
Assuming the same underlying cost structure produces an 80% gross-margin rate for this simplified comparison:
Monthly Gross Profit = $120
Payback becomes:
$1,600 ÷ $120 ≈ 13.33 Months
The discount lengthens modeled payback by more than three months.
If it significantly reduces CAC or improves retention, the total result could still be attractive.
Discounted Acquisition Can Reduce CAC
Discounting does not always worsen payback.
Suppose a promotion reduces customer revenue but also makes acquisition substantially easier.
Original:
CAC = $1,600
Monthly Gross Profit = $160
Payback = 10 Months
After promotion:
CAC = $900
Monthly Gross Profit = $120
New payback:
$900 ÷ $120 = 7.5 Months
Despite lower customer contribution, acquisition cost falls sufficiently to shorten payback.
This is why both the numerator and denominator need to be measured rather than assuming a discount always worsens unit economics.
CAC Payback and Monthly Recurring Revenue
Monthly recurring revenue provides the recurring revenue base, but total MRR should not normally be divided directly into total CAC without aligning customer cohorts.
Suppose the company has $1 million of MRR from thousands of historical customers but spends $100,000 acquiring 100 new customers this month.
Using total company MRR would make payback appear almost immediate.
Instead, the acquisition spending should be matched with the economics of the customers acquired by that spending.
Cohort alignment is essential.
CAC Payback and Annual Recurring Revenue
Annual recurring revenue can help describe customer scale, but ARR alone does not determine payback.
Suppose:
New Customer ARR = $12,000
CAC = $6,000
It would be wrong to conclude automatically that payback is six months by comparing $6,000 of CAC with $12,000 of revenue.
If gross margin is 50%:
Annual Gross Profit = $6,000
Payback is approximately:
12 Months
under stable annualized economics.
Revenue must be converted into an appropriate contribution measure.
CAC Payback and Annual Contract Value
A high annual contract value can support faster CAC recovery when gross margins are strong.
Suppose:
Customer A:
ACV = $100,000
Gross Margin = 80%
Customer B:
ACV = $100,000
Gross Margin = 25%
Annual gross contribution:
Customer A:
$80,000
Customer B:
$25,000
If CAC is $20,000 for both, their payback periods differ substantially despite identical ACV.
Contract size is therefore only one part of customer acquisition economics.
CAC Payback and Lifetime Value to CAC Ratio
The lifetime value to cac ratio asks how much lifetime customer value is expected relative to acquisition cost.
CAC payback instead measures time.
Consider two customers with the same 3:1 lifetime value-to-CAC ratio.
Customer A might recover CAC in six months and then generate value for several years.
Customer B might take 30 months to recover CAC.
Their LTV:CAC ratios can look similar while their cash requirements and financing risk differ considerably.
Using both metrics provides more information than either alone.
CAC Payback and Gross Revenue Retention
Gross revenue retention helps indicate how well recurring revenue survives churn and contraction before expansion.
Weak GRR can undermine payback assumptions.
Suppose a payback model assumes each customer maintains $500 of monthly recurring revenue.
If customers routinely downgrade, the contribution available for CAC recovery shrinks over time.
A company with strong initial ARPA but poor GRR can therefore experience slower realized payback than the simple formula suggests.
CAC Payback and Net Revenue Retention
Net revenue retention includes expansion as well as churn and contraction.
Strong expansion can accelerate realized payback for customer cohorts.
Suppose a customer’s monthly gross profit begins at $200 but increases to $300 after an upgrade.
The original payback model using $200 per month may be conservative.
However, expansion should not be assumed for every customer simply because company-wide NRR is high.
Cohort behavior and customer mix matter.
CAC Payback With Expansion
Suppose CAC is $2,000.
Months 1–4 generate:
$200 of Gross Profit per Month
Cumulative contribution after four months:
4 × $200 = $800
The customer then upgrades and generates:
$300 per Month
Remaining CAC:
$2,000 − $800 = $1,200
Additional time required:
$1,200 ÷ $300 = 4 Months
Total payback:
4 + 4 = 8 Months
A constant-$200 model would have estimated:
$2,000 ÷ $200 = 10 Months
Expansion shortens actual modeled payback by two months.
Cohort CAC Payback
A cohort approach compares total acquisition spending for a group with the cumulative contribution generated by that same group.
Suppose a company spends:
$150,000
to acquire 100 customers.
Average CAC:
$1,500
The cohort generates $30,000 of gross profit per month.
If that contribution remains stable:
Payback = $150,000 ÷ $30,000 = 5 Months
At the end of month five:
Cumulative Gross Profit = $150,000
The acquisition investment has been recovered.
Real cohorts often produce changing contribution because of churn, expansion, discounts, and usage, so cumulative tracking can be more accurate than a static average.
CAC Payback With Declining Cohort Revenue
Suppose a cohort costs $100,000 to acquire and generates monthly gross profit of:
| Month | Cohort Gross Profit |
|---|---|
| 1 | $25,000 |
| 2 | $22,000 |
| 3 | $20,000 |
| 4 | $18,000 |
| 5 | $16,000 |
Cumulative after Month 4:
$25,000 + $22,000 + $20,000 + $18,000 = $85,000
After Month 5:
$85,000 + $16,000 = $101,000
The cohort reaches payback during Month 5.
A simple calculation based only on Month 1 contribution would have estimated:
$100,000 ÷ $25,000 = 4 Months
That would be too optimistic because customer contribution declined.
CAC Payback With Upfront Annual Billing
Cash collection can occur faster than economic payback.
Suppose a customer pays $12,000 upfront for a year.
CAC is $4,000.
The company receives enough cash on Day 1 to exceed the acquisition cost.
But if gross margin is 50%, the annual gross profit associated with the contract is:
$12,000 × 50% = $6,000
and the economic contribution is earned as the service is delivered under the relevant analytical framework.
Cash payback and gross-profit payback are therefore not necessarily the same measure.
Businesses should specify which one they are tracking.
CAC Payback and Pricing Increases
A successful price increase can shorten payback.
Suppose:
CAC = $2,400
Monthly ARPA = $300
Gross Margin = 80%
Original gross profit:
$240
Original payback:
10 Months
ARPA rises to $350 while gross-margin percentage remains 80%:
Gross Profit = $280
New payback:
$2,400 ÷ $280 ≈ 8.57 Months
Payback improves by approximately 1.43 months.
The improvement is valuable only if customer acquisition and retention remain sufficiently strong after the higher price.
CAC Payback and Sales Efficiency
Sales efficiency provides a complementary view of how productively commercial spending generates new revenue.
CAC payback focuses on the time required to recover customer-level acquisition cost.
A sales organization can appear efficient in producing new recurring revenue while still having a long payback if gross margins are weak.
Conversely, a customer segment with expensive acquisition can have acceptable payback if the accounts generate very high recurring contribution.
Both perspectives help evaluate growth investment.
CAC Payback and Magic Number SaaS
The magic number saas metric is another commercial-efficiency measure used in recurring-revenue businesses.
Its methodology focuses on incremental recurring revenue relative to prior sales and marketing expenditure.
CAC payback works at a different level by estimating how long customer gross contribution takes to recover acquisition spending.
The two can move in the same direction but should not be treated as equivalent formulas.
CAC Payback and Margin
A change in margin can materially alter payback even when customer price is unchanged.
Suppose monthly customer revenue remains $400.
At 80% gross margin:
Gross Profit = $320
With CAC of $2,400:
Payback = 7.5 Months
If gross margin falls to 60%:
Gross Profit = $240
Payback = 10 Months
A 20-percentage-point margin decline extends payback by 2.5 months.
Improving cost-to-serve can therefore improve acquisition economics without changing CAC or selling price.
Why Revenue-Based Payback Can Mislead
Suppose CAC is $1,000 and monthly revenue per customer is $250.
Revenue-based calculation:
$1,000 ÷ $250 = 4 Months
But gross margin is only 40%.
Monthly gross profit:
$250 × 40% = $100
Gross-profit payback:
$1,000 ÷ $100 = 10 Months
The revenue-based calculation understates the economic recovery period by six months.
For businesses with meaningful cost of revenue, gross-margin adjustment is critical.
What Is a Good CAC Payback Period?
There is no universal ideal period that applies to every business.
A viable payback depends on:
- gross margin;
- customer retention;
- access to capital;
- billing terms;
- growth rate;
- sales cycle;
- contract length;
- expansion potential;
- market maturity; and
- risk.
A business with annual upfront billing and exceptionally durable customers may tolerate a different economic payback than a cash-constrained company with high monthly churn.
The most important question is whether the payback period fits the company’s customer lifetime, financing capacity, and return expectations.
Short CAC Payback
A shorter payback generally means acquisition capital is recovered sooner.
That can allow a business to reinvest the recovered contribution into acquiring more customers.
For example:
Company A:
CAC Payback = 6 Months
Company B:
CAC Payback = 18 Months
If everything else were equal, Company A can recycle acquisition capital much faster.
But everything else is rarely equal.
Company B might have much longer customer lifetime, greater expansion potential, or larger post-payback contribution.
Long CAC Payback
A long payback means more capital remains tied up in customer acquisition before recovery.
Suppose the company acquires 10,000 customers at:
CAC = $1,000 Each
Total acquisition investment:
$10 Million
If payback takes 24 months, substantial capital must finance that customer base while the company waits for cumulative contribution to recover the $10 million.
Rapid acquisition combined with long payback can create severe cash requirements even when lifetime economics ultimately appear attractive.
Improving CAC Payback
There are three fundamental ways to shorten payback.
First, reduce acquisition cost.
Second, increase customer revenue or expansion.
Third, improve gross margin or contribution by reducing the cost to serve.
Retention does not directly change the static formula when monthly contribution is constant, but it determines whether customers survive long enough to complete the modeled payback.
The strongest improvements usually come from better economics rather than from manipulating one metric.
Common CAC Payback Period Mistakes
A common mistake is dividing CAC by customer revenue without adjusting for gross margin.
Another is calculating CAC per account while using revenue per user in the denominator.
Businesses also mix acquisition spending from one period with customers acquired in another.
Another mistake is ignoring churn and assuming every acquired customer survives through the entire payback period.
Company-wide MRR should not be used to pay back current-period CAC when most of that MRR comes from historical customers.
Upfront cash collection can also be confused with economic contribution payback.
Finally, an attractive average payback can conceal poorly performing channels, customer segments, or acquisition cohorts.
Frequently Asked Questions
What is CAC payback period in simple terms?
CAC payback period is the amount of time required for the gross profit or applicable contribution from a customer to recover that customer’s acquisition cost.
What is the CAC payback formula?
A common formula is:
CAC Payback Months = CAC per Customer ÷ Monthly Gross Profit per Customer
How do you calculate CAC payback using ARPA?
Use:
CAC Payback = CAC ÷ (Monthly ARPA × Gross Margin %)
If CAC is $1,800, ARPA is $300, and gross margin is 80%:
CAC Payback = $1,800 ÷ $240 = 7.5 Months
How do you calculate CAC payback using ARPU?
For a user-based model:
CAC Payback = CAC per User ÷ (Monthly ARPU × Gross Margin %)
The customer unit must match the CAC denominator.
Why use gross profit instead of revenue?
Part of customer revenue is required to deliver the product or service. Gross-profit adjustment gives a more realistic estimate of the amount available to recover acquisition spending.
Is CAC payback the same as CAC?
No.
CAC measures acquisition cost.
CAC payback measures how long customer economics take to recover that cost.
Is CAC payback the same as LTV:CAC?
No.
CAC payback measures time to recovery.
LTV:CAC compares estimated lifetime customer value with acquisition cost.
How does churn affect CAC payback?
Customers who churn before the modeled payback date may never fully recover their acquisition cost. High churn can therefore make static payback estimates overly optimistic.
Can expansion revenue shorten CAC payback?
Yes.
If existing customers upgrade or increase usage, the additional contribution can accelerate recovery of acquisition spending.
Do discounts increase CAC payback?
They can if they reduce customer contribution without sufficiently reducing CAC or improving retention. A discount can also shorten payback if it dramatically lowers acquisition cost.
Does annual upfront billing mean CAC is paid back immediately?
Not necessarily.
Cash may be collected immediately, but economic payback based on gross contribution can occur over a different period.
Can a business have strong ARR growth and poor CAC payback?
Yes.
A company can add recurring revenue rapidly while spending so much to acquire customers that the acquisition investment takes a long time to recover.
Why should CAC payback be calculated by cohort?
Cohort analysis matches acquisition spending with the customers produced by that spending and captures actual churn, expansion, and contribution changes more accurately than company-wide averages.
What makes CAC payback shorter?
Lower acquisition cost, higher ARPA or ARPU, stronger gross margins, and customer expansion can shorten payback.
What makes CAC payback longer?
Higher acquisition spending, discounts, lower gross margin, contraction, weak monetization, and churn before recovery can worsen realized payback economics.
Why is CAC payback period important?
It shows how quickly growth investment returns to the business. That helps management evaluate acquisition efficiency, cash requirements, pricing, margins, retention, and how aggressively the company can afford to grow.




