

Lifetime Value To Cac Ratio: Formula, Meaning & Example

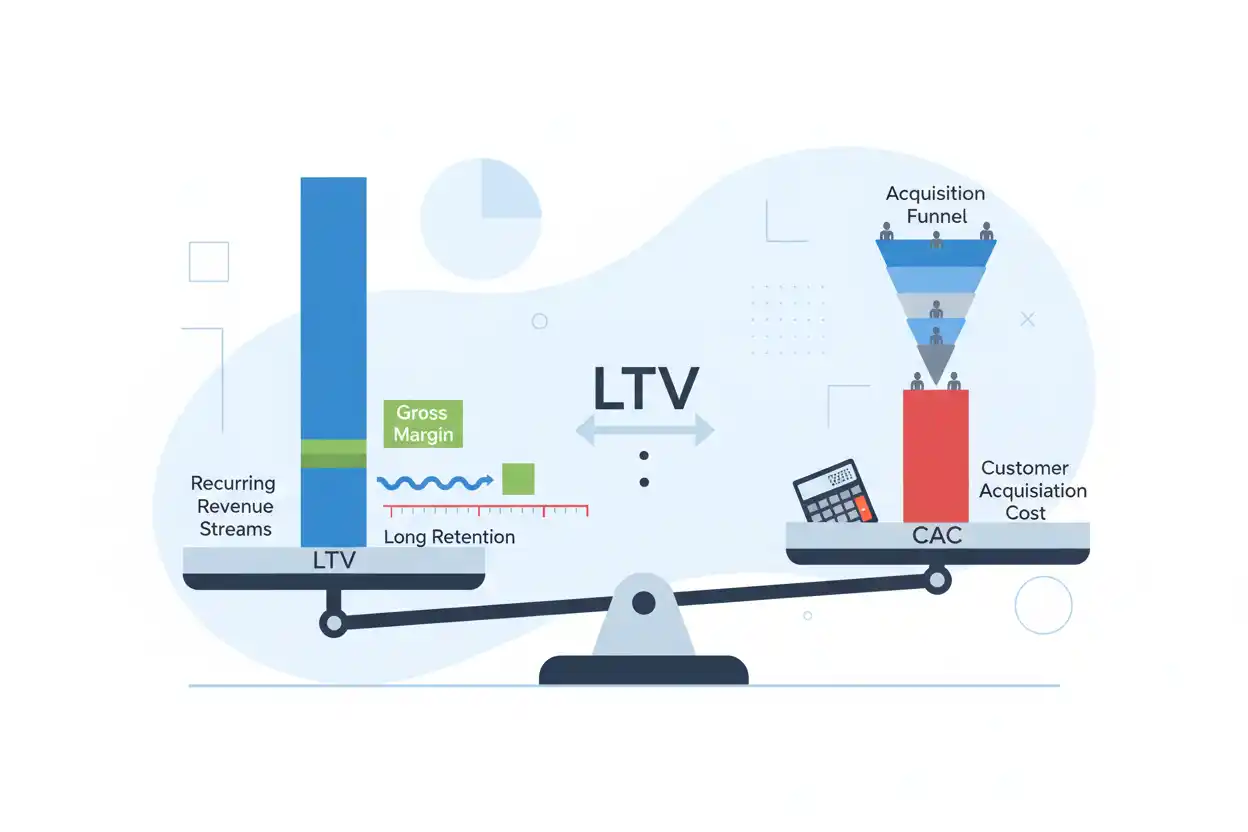
The lifetime value to CAC ratio, usually written LTV:CAC, compares the estimated economic value generated by a customer over the customer relationship with the cost required to acquire that customer.
If estimated customer lifetime value is $4,000 and customer acquisition cost is $1,000:
LTV:CAC Ratio = Customer Lifetime Value ÷ Customer Acquisition Cost
LTV:CAC = $4,000 ÷ $1,000 = 4.0
The relationship can be written as:
4:1
Under the assumptions, the customer’s estimated lifetime value is four times the cost required to acquire the customer.
The ratio is widely used in subscription, SaaS, e-commerce, and other customer-acquisition businesses, but it should not be interpreted without understanding how lifetime value and CAC were calculated.
What Is the Lifetime Value to CAC Ratio?
LTV:CAC asks a simple economic question:
How much customer value is expected for each dollar spent acquiring the customer?
Suppose:
Lifetime Value = $6,000
CAC = $2,000
Then:
LTV:CAC = 3:1
For every $1 of acquisition cost, the business expects approximately $3 of customer lifetime value under the model.
The ratio becomes meaningful only when lifetime value reflects a relevant economic contribution rather than simply lifetime revenue.
Using revenue without accounting for gross margin can overstate customer value substantially.
Lifetime Value to CAC Ratio Formula
The core formula is:
LTV:CAC Ratio = Customer Lifetime Value ÷ Customer Acquisition Cost
If:
LTV = $9,000
and:
CAC = $3,000
then:
LTV:CAC = 3.0
or:
3:1
The calculation itself is straightforward.
The difficulty lies in estimating LTV reliably and calculating CAC consistently.
Small changes in churn, margin, expansion assumptions, acquisition spending, or customer lifetime can produce large changes in the ratio.
LTV:CAC Example
Suppose a subscription company estimates:
Customer Lifetime Value = $5,000
and calculates:
Customer Acquisition Cost = $1,250
Then:
LTV:CAC = $5,000 ÷ $1,250
LTV:CAC = 4.0
The customer is expected to generate four times the economic value represented by acquisition cost.
If the LTV estimate later falls to $3,000 because retention weakens:
LTV:CAC = $3,000 ÷ $1,250
= 2.4
CAC has not changed.
The ratio deteriorates because expected customer value is lower.
A Simplified LTV Formula for Subscription Businesses
A common simplified subscription estimate is:
Customer LTV ≈ Average Monthly Revenue per Customer × Gross Margin % ÷ Monthly Customer Churn Rate
This assumes a relatively stable customer base and uses:
Approximate Lifetime = 1 ÷ Churn Rate
Suppose:
Monthly ARPA = $200
Gross Margin = 80%
Monthly Churn = 4%
Monthly gross profit per customer:
$200 × 80% = $160
Approximate customer lifetime:
1 ÷ 0.04 = 25 Months
Estimated LTV:
$160 × 25 = $4,000
Equivalent shortcut:
$200 × 80% ÷ 4% = $4,000
If CAC is $1,000:
LTV:CAC = $4,000 ÷ $1,000 = 4:1
This simplified approach is useful for illustration but relies on strong assumptions.
Why Gross Margin Should Be Included
Suppose two companies each generate $200 of monthly revenue per customer and both have an expected lifetime of 24 months.
Company A gross margin:
80%
Company B gross margin:
30%
Company A monthly gross profit:
$160
Approximate LTV:
$160 × 24 = $3,840
Company B monthly gross profit:
$60
Approximate LTV:
$60 × 24 = $1,440
If CAC is $1,000 for both:
Company A:
LTV:CAC = 3.84
Company B:
LTV:CAC = 1.44
Their lifetime revenue is identical, but their lifetime gross-profit economics are very different.
Revenue-Based LTV Can Overstate the Ratio
Suppose:
Monthly Revenue per Customer = $500
Average Lifetime = 20 Months
Lifetime revenue:
$10,000
CAC:
$2,000
Revenue-based ratio:
5:1
But gross margin is only 40%.
Gross-profit LTV:
$10,000 × 40% = $4,000
Gross-profit-based LTV:CAC:
$4,000 ÷ $2,000 = 2:1
Ignoring gross margin doubles the apparent ratio in this example.
The LTV definition should therefore be stated clearly.
Lifetime Value and Customer Churn
Customer churn is one of the most powerful LTV drivers.
Suppose monthly gross profit per customer is $100.
At 5% monthly churn, a simple lifetime approximation is:
1 ÷ 0.05 = 20 Months
Estimated LTV:
20 × $100 = $2,000
At 2.5% churn:
1 ÷ 0.025 = 40 Months
Estimated LTV:
40 × $100 = $4,000
Halving the churn rate doubles the simplified lifetime estimate.
This demonstrates why logo retention and revenue-retention quality matter so much to customer economics.
LTV:CAC and Gross Revenue Retention
Gross revenue retention provides a revenue-based view of how much customer value survives before expansion.
Weak GRR generally means recurring revenue is disappearing through churn or contraction.
That erosion can reduce lifetime value.
Suppose two customer cohorts begin with identical revenue and CAC.
Cohort A retains 98% of recurring revenue over the relevant interval.
Cohort B retains only 85%.
If the weaker retention persists, Cohort B should generally produce less lifetime gross profit, all else equal.
GRR therefore provides useful evidence when evaluating whether an LTV estimate is realistic.
LTV:CAC and Logo Retention
Logo retention measures the percentage of customer accounts that remain.
A business can have high logo retention but poor revenue retention if retained accounts repeatedly downgrade.
Conversely, losing some very small accounts can reduce logo retention while having limited impact on lifetime revenue.
Lifetime value should therefore not be modeled from customer-count retention alone when account sizes vary significantly.
Customer-level and revenue-level retention both provide useful context.
Expansion Revenue Can Increase LTV
Expansion revenue can materially increase customer lifetime value.
Suppose a customer initially generates:
$200 Monthly Revenue
At an 80% gross margin:
Monthly Gross Profit = $160
If the customer remains at that level for 24 months:
Simplified LTV = $160 × 24 = $3,840
Now assume the customer expands after Month 12 and monthly gross profit rises to $240.
First 12 months:
12 × $160 = $1,920
Next 12 months:
12 × $240 = $2,880
Total:
LTV = $4,800
Expansion increases modeled lifetime value by:
$960
If CAC is unchanged at $1,200:
Original ratio:
$3,840 ÷ $1,200 = 3.2
Expanded ratio:
$4,800 ÷ $1,200 = 4.0
Expansion can therefore improve LTV:CAC materially.
Do Not Assume Expansion Without Evidence
Expansion improves LTV only when customers actually expand.
Suppose management assumes every customer will increase spending 20% annually because company-wide net revenue retention has been strong.
That assumption may be unrealistic if expansion comes from only a small group of enterprise customers.
An LTV model should reflect the behavior of the relevant customer segment or cohort rather than applying the strongest company-wide result to every acquired customer.
LTV:CAC and CAC Payback Period
The cac payback period and LTV:CAC measure different aspects of acquisition economics.
LTV:CAC asks:
How much lifetime value is expected relative to CAC?
CAC payback asks:
How long does it take to recover CAC?
Suppose two customers each have:
LTV = $6,000
CAC = $2,000
Both have:
LTV:CAC = 3:1
Customer A produces $400 of gross profit monthly:
Payback = 5 Months
Customer B produces $100 monthly:
Payback = 20 Months
The lifetime ratio is identical.
The timing of recovery is dramatically different.
A business facing cash constraints should therefore care about both.
High LTV:CAC With Slow Payback
Suppose:
LTV = $10,000
CAC = $2,000
Ratio:
5:1
That appears attractive.
But if the customer produces only $100 of gross profit per month:
CAC Payback = $2,000 ÷ $100 = 20 Months
The business must finance acquisition spending for a long period before recovering it.
A high lifetime ratio does not eliminate cash-flow risk.
Lower LTV:CAC With Fast Payback
Now suppose:
LTV = $3,000
CAC = $1,500
Ratio:
2:1
Monthly gross profit is:
$500
Payback:
3 Months
The lifetime ratio is lower, but acquisition capital returns much faster.
Whether this customer is economically superior depends on lifetime, reinvestment opportunities, risk, capital constraints, and return requirements.
LTV:CAC and Average Revenue Per Account
Average revenue per account can be an important input in account-based LTV.
Suppose monthly ARPA is $500.
Gross margin:
80%
Monthly account contribution:
$400
If expected customer lifetime is 30 months:
LTV = $400 × 30 = $12,000
With CAC of $3,000:
LTV:CAC = 4:1
If ARPA rises through sustainable customer expansion while retention remains stable, customer lifetime value can improve.
LTV:CAC and Average Revenue Per User
A consumer or user-based business may instead use average revenue per user.
Suppose:
Monthly ARPU = $15
Gross Margin = 70%
Expected Lifetime = 18 Months
Monthly gross profit:
$15 × 70% = $10.50
LTV:
$10.50 × 18 = $189
If acquisition cost per user is $63:
LTV:CAC = $189 ÷ $63 = 3:1
The customer unit used in LTV must match the unit used in CAC.
Account-level CAC should not be divided into user-level LTV without a deliberate conversion.
LTV:CAC and Annual Contract Value
Annual contract value can provide information about customer monetization but is not the same as LTV.
Suppose:
ACV = $100,000
A customer stays for three years and gross margin is 80%.
Simplified lifetime gross profit:
$100,000 × 3 × 80% = $240,000
If CAC is $60,000:
LTV:CAC = $240,000 ÷ $60,000 = 4:1
ACV contributes to the lifetime calculation, while customer duration and margin determine how much of the contract value becomes modeled lifetime economic value.
LTV:CAC and Annual Recurring Revenue
Annual recurring revenue measures the company’s recurring revenue base.
LTV:CAC measures customer unit economics.
A business can have $100 million of ARR and weak LTV:CAC if acquiring and retaining customers is extremely expensive.
Another company can have only $5 million ARR but excellent unit economics.
Scale and acquisition efficiency should therefore be evaluated separately.
LTV:CAC and Discounted Price
A lower discounted price can reduce lifetime value if it permanently lowers customer revenue.
Suppose a customer originally pays:
$200 per Month
At 80% gross margin:
Monthly Gross Profit = $160
A permanent 25% discount reduces price to:
$150
At the same gross-margin assumption:
Monthly Gross Profit = $120
For a 24-month customer lifetime:
Original LTV:
$160 × 24 = $3,840
Discounted LTV:
$120 × 24 = $2,880
Difference:
−$960
If CAC remains $1,000:
Original ratio:
3.84
Discounted ratio:
2.88
The discount can still be rational if it meaningfully improves retention or lowers CAC, but those benefits must be measured.
Retention Discounts Can Improve LTV
Suppose the same 25% discount reduces monthly gross profit from $160 to $120 but extends expected lifetime from 12 months to 24 months.
Without discount:
LTV = $160 × 12 = $1,920
With discount:
LTV = $120 × 24 = $2,880
Despite lower monthly economics, estimated lifetime value increases by $960.
This shows why price and retention should be analyzed together rather than assuming every discount necessarily reduces lifetime value.
LTV:CAC and Acquisition Channels
Different acquisition channels can have very different ratios.
Suppose:
| Channel | LTV | CAC | LTV:CAC |
|---|---|---|---|
| Organic Search | $4,000 | $800 | 5.0 |
| Paid Search | $4,500 | $1,500 | 3.0 |
| Paid Social | $3,000 | $1,500 | 2.0 |
Organic customers appear most attractive by this metric.
However, management should also consider how much scalable customer volume each channel can produce.
A channel with a 6:1 ratio but only 50 available customers may contribute less total value than a scalable 3:1 channel.
LTV:CAC by Customer Segment
Suppose:
Small Business:
LTV = $3,000
CAC = $1,000
Ratio = 3:1
Mid-Market:
LTV = $15,000
CAC = $4,000
Ratio = 3.75:1
Enterprise:
LTV = $100,000
CAC = $30,000
Ratio ≈ 3.33:1
The enterprise segment has the highest absolute customer value but not the highest ratio.
Segment analysis separates customer scale from acquisition efficiency.
LTV:CAC by Cohort
Company-wide averages can conceal deterioration in newer customers.
Suppose:
2024 cohort:
LTV:CAC = 4.5
2025 cohort:
3.5
2026 cohort:
2.4
The downward trend could indicate:
higher acquisition costs, weaker retention, deeper discounts, lower margins, worse customer fit, or reduced expansion.
Cohort analysis helps identify whether headline company economics are being supported by older, stronger customers while newer acquisitions weaken.
LTV:CAC and Magic Number SaaS
The magic number saas metric provides another perspective on commercial efficiency.
LTV:CAC focuses on the expected lifetime economics of acquired customers.
The SaaS Magic Number generally evaluates how effectively sales and marketing spending creates incremental recurring revenue across periods.
A business can show an attractive lifetime ratio but weak current sales efficiency if acquisition spending has recently become less productive.
The metrics complement rather than replace one another.
LTV:CAC and Sales Efficiency
Sales efficiency also looks at the productivity of commercial spending.
A customer-level LTV:CAC ratio may look strong while the sales organization takes years to generate enough volume to justify its fixed operating structure.
Conversely, strong near-term sales efficiency does not guarantee customers will remain long enough to produce attractive lifetime economics.
One measures expected unit value relative to acquisition cost; the other evaluates how efficiently commercial investment creates growth under its assigned framework.
LTV:CAC and Margin
The margin used in LTV should reflect the economics the company intends to measure.
If gross margin improves from 60% to 75% while customer revenue and retention stay unchanged, LTV can increase materially.
Suppose lifetime revenue is:
$10,000
At 60% margin:
LTV = $6,000
At 75%:
LTV = $7,500
With CAC of $2,000:
Original ratio:
3.0
New ratio:
3.75
Cost-to-serve improvements can therefore strengthen LTV:CAC without changing customer pricing or acquisition cost.
LTV:CAC and Customer Acquisition Cost Growth
Suppose LTV remains $6,000.
CAC rises:
From $1,500 to $2,000
Original ratio:
$6,000 ÷ $1,500 = 4.0
New ratio:
$6,000 ÷ $2,000 = 3.0
Customer value has not deteriorated.
Acquisition has simply become more expensive.
This can happen when advertising markets become more competitive, sales cycles lengthen, conversion falls, or the company moves into harder-to-acquire segments.
Improving LTV:CAC by Reducing CAC
Suppose:
LTV = $4,000
CAC = $2,000
Ratio:
2:1
The company improves acquisition efficiency and reduces CAC to $1,250.
New ratio:
$4,000 ÷ $1,250 = 3.2:1
Lifetime value is unchanged.
The economics improve because the business spends less to acquire the same expected value.
Improving LTV:CAC Through Retention
Suppose monthly gross profit per customer is $100.
Expected lifetime rises:
From 20 Months to 30 Months
Original LTV:
$2,000
New LTV:
$3,000
If CAC is $750:
Original:
$2,000 ÷ $750 ≈ 2.67
New:
$3,000 ÷ $750 = 4.0
A retention improvement produces a large ratio change without altering price or acquisition spending.
Improving LTV:CAC Through Expansion
Suppose initial modeled lifetime gross profit is $3,000 and CAC is $1,000:
LTV:CAC = 3:1
Historical expansion adds an expected $1,000 of incremental gross profit over the average customer lifetime.
Adjusted LTV:
$4,000
New ratio:
4:1
Expansion can strengthen unit economics when it is repeatable and supported by actual customer behavior.
When a Very High LTV:CAC Ratio Can Be Misleading
A very high ratio is not automatically evidence that acquisition strategy is optimized.
Suppose:
LTV:CAC = 10:1
That can indicate outstanding customer economics.
It can also indicate the business is underinvesting in customer acquisition and could profitably spend more to grow.
Alternatively, the LTV estimate may simply be too optimistic.
Management should ask:
Are lifetime assumptions realistic?
Does expansion repeat across cohorts?
Is churn understated?
Are all acquisition costs included?
Could more acquisition spending produce attractive incremental returns?
The ratio is an analytical tool, not a target to maximize without limit.
Low LTV:CAC Does Not Always Mean Stop Acquiring
A low ratio can occur temporarily in a new market where initial acquisition spending is unusually high.
Suppose a company invests heavily in building a sales organization before revenue scales.
Early CAC appears high.
As conversion improves and the team becomes productive, CAC may decline.
Likewise, new customer cohorts may still be too young to estimate LTV accurately.
A weak early ratio deserves investigation, but management should distinguish a temporary investment phase from structurally poor unit economics.
LTV:CAC and the Timing of Cash Flows
The standard ratio does not show when customer value arrives.
Suppose two customers each have:
LTV = $5,000
CAC = $1,000
Both have a 5:1 ratio.
Customer A generates most value during the first year.
Customer B generates it over five years.
The second customer exposes the company to more time, retention, and financing risk.
Discounted cash-flow or cohort-based lifetime analysis can provide a more precise economic view when timing is material.
LTV Should Not Be Treated as Certain
Lifetime value is an estimate.
It can depend on:
- future customer retention;
- future pricing;
- gross margin;
- expansion;
- contraction;
- product usage;
- competitive conditions; and
- customer behavior.
A ratio such as 4.0 should therefore not be interpreted as a guaranteed four-dollar return for every dollar spent.
It is the output of a model based on assumptions and historical evidence.
What Is a Good LTV:CAC Ratio?
There is no universal ratio that is correct for every business.
An economically attractive level depends on payback timing, margins, business risk, capital requirements, retention, contract length, market maturity, and reinvestment opportunities.
A higher ratio generally indicates more lifetime value relative to acquisition cost.
But very high ratios can sometimes indicate underinvestment in growth, while low ratios can indicate expensive acquisition, weak retention, poor margins, or immature customer cohorts.
The appropriate benchmark should reflect the specific business model.
Common Lifetime Value to CAC Ratio Mistakes
A common mistake is using lifetime revenue rather than an economic value adjusted for the relevant margin.
Another is using customer revenue and CAC calculated at different levels, such as user LTV with account CAC.
Businesses can also estimate lifetime from short-term churn that is not representative of mature customers.
Another error is assuming expansion that only a small subset of customers achieves.
Some calculations omit sales salaries, marketing overhead, commissions, or other legitimate acquisition costs from CAC.
A high LTV:CAC ratio can also obscure an excessively long CAC payback period.
Finally, lifetime value is a forecast, not a guaranteed realized amount.
Frequently Asked Questions
What is the lifetime value to CAC ratio in simple terms?
LTV:CAC compares the estimated economic value generated by a customer over the relationship with the cost required to acquire that customer.
What is the LTV:CAC formula?
LTV:CAC = Customer Lifetime Value ÷ Customer Acquisition Cost
What does a 3:1 LTV:CAC ratio mean?
It means estimated customer lifetime value is three times the customer acquisition cost under the model’s assumptions.
How do you calculate LTV:CAC?
If customer lifetime value is $6,000 and CAC is $2,000:
$6,000 ÷ $2,000 = 3
The ratio is 3:1.
Should LTV use revenue or gross profit?
Using gross profit or another appropriate contribution measure usually gives a more economically meaningful result than using revenue alone when serving customers has material costs.
How does customer churn affect LTV:CAC?
Higher churn generally shortens expected customer lifetime and reduces LTV, weakening the ratio if other factors remain unchanged.
How does gross revenue retention affect LTV:CAC?
Weak GRR indicates recurring customer revenue is eroding through churn or contraction. Persistent erosion can reduce expected customer lifetime value.
Can expansion revenue improve LTV:CAC?
Yes.
Sustainable expansion can increase the gross profit generated over a customer relationship, increasing LTV while CAC remains unchanged.
Is LTV:CAC the same as CAC payback?
No.
LTV:CAC measures total expected value relative to acquisition cost.
CAC payback measures the time required to recover acquisition cost.
Can two customers have the same LTV:CAC but different payback periods?
Yes.
They can generate the same lifetime value but produce that value at very different speeds.
Can discounts reduce LTV:CAC?
Yes, if they reduce customer contribution without sufficiently improving retention, expansion, or CAC.
Can better retention offset a lower price?
Yes.
A lower monthly contribution can still produce a higher lifetime value if customer lifetime increases enough.
Why compare LTV:CAC by acquisition channel?
Different channels can produce customers with different CAC, retention, expansion, and lifetime value. Channel-level analysis helps identify where acquisition spending creates the strongest economics.
Can LTV:CAC be too high?
A very high ratio can reflect excellent economics, but it can also indicate overly optimistic LTV assumptions or underinvestment in profitable acquisition opportunities.
Does a high LTV:CAC guarantee profitability?
No.
The ratio does not capture every operating expense, fixed cost, financing requirement, or timing issue across the business.
Why should LTV:CAC be tracked with GRR and logo retention?
Retention metrics provide evidence about whether customers remain and preserve their revenue, which are important assumptions behind lifetime-value estimates.
Why is the lifetime value to CAC ratio important?
It connects customer value with acquisition spending. Combined with retention, expansion, margin, CAC payback, and sales-efficiency metrics, it helps determine whether customer growth is economically sustainable rather than merely fast.




