

Monthly Recurring Revenue Growth: Formula, Meaning & Example

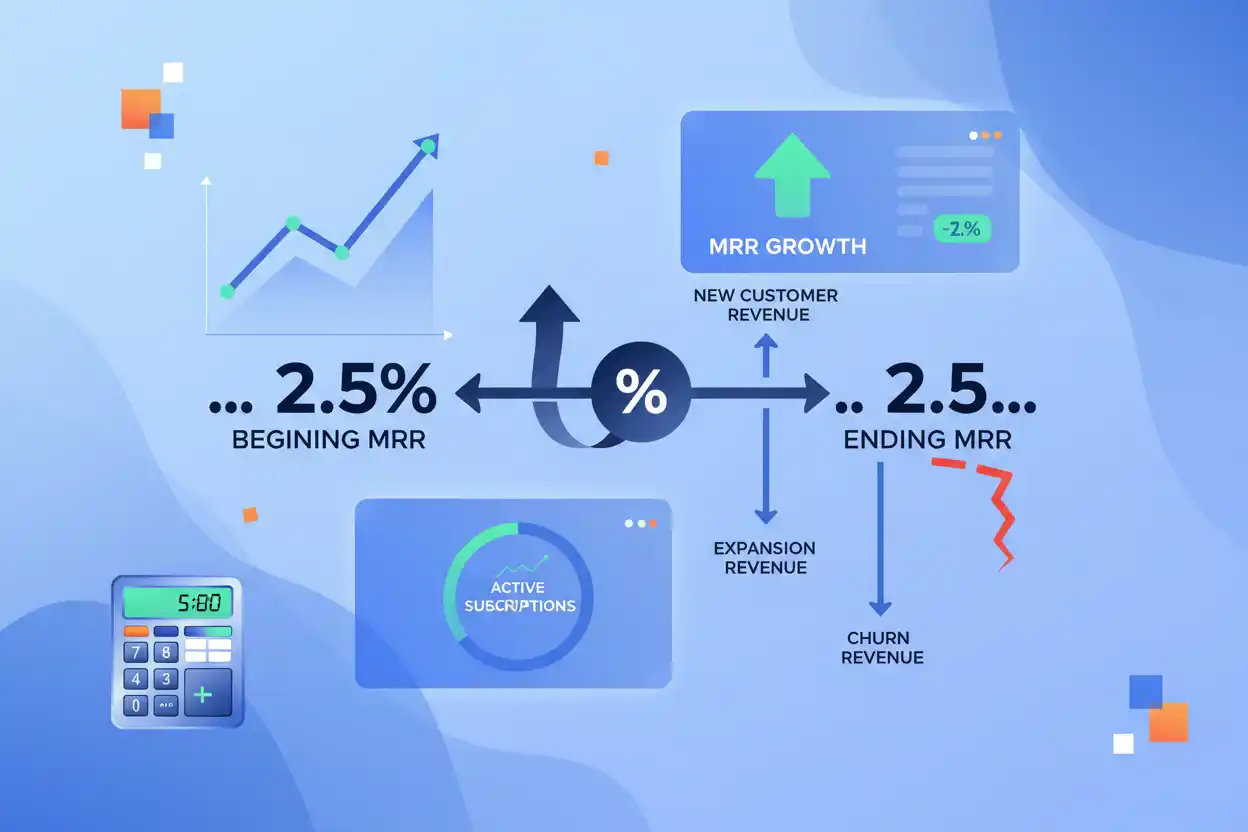
Monthly recurring revenue growth measures the percentage increase or decrease in MRR between two periods.
If monthly recurring revenue rises from $500,000 to $550,000:
Monthly Recurring Revenue Growth = (Ending MRR − Beginning MRR) ÷ Beginning MRR × 100
MRR Growth = ($550,000 − $500,000) ÷ $500,000 × 100
MRR Growth = 10%
The recurring revenue base grew 10% over the period.
When the comparison is between consecutive months, this is a month-over-month MRR growth rate. The formula can also be used across longer periods as long as the beginning and ending MRR values are clearly defined.
What Is Monthly Recurring Revenue Growth?
MRR growth shows how quickly a recurring-revenue base changes.
The MRR balance answers:
How much recurring monthly revenue do we have?
MRR growth answers:
How fast is that recurring base increasing or decreasing?
Suppose:
January MRR = $200,000
February MRR = $220,000
Absolute increase:
$20,000
Percentage growth:
$20,000 ÷ $200,000 × 100 = 10%
The company added $20,000 of net MRR and grew its recurring base by 10%.
Monthly Recurring Revenue Growth Formula
The formula is:
MRR Growth % = (Ending MRR − Beginning MRR) ÷ Beginning MRR × 100
An equivalent form is:
MRR Growth % = Net New MRR ÷ Beginning MRR × 100
when:
Net New MRR = Ending MRR − Beginning MRR
Suppose:
Beginning MRR = $800,000
Ending MRR = $860,000
Net New MRR:
$60,000
Growth:
$60,000 ÷ $800,000 × 100
= 7.5%
MRR Growth Example
Suppose a SaaS company starts March with:
$1,000,000 MRR
During March it adds:
New MRR = $80,000
Expansion MRR = $50,000
and loses:
Churned MRR = $30,000
Contraction MRR = $20,000
Net New MRR:
$80,000 + $50,000 − $30,000 − $20,000
= $80,000
Ending MRR:
$1,000,000 + $80,000 = $1,080,000
MRR growth:
$80,000 ÷ $1,000,000 × 100
= 8%
The recurring base grew 8% during the month.
MRR Growth From Beginning and Ending Values
If only beginning and ending MRR are known, the calculation is straightforward.
Suppose:
Beginning MRR = $400,000
Ending MRR = $460,000
Increase:
$60,000
Growth:
$60,000 ÷ $400,000 × 100 = 15%
The company does not need a component breakdown to calculate the headline growth percentage.
However, without new, expansion, contraction, and churn data, management cannot explain why MRR grew 15%.
Positive MRR Growth
When:
Ending MRR > Beginning MRR
the MRR growth rate is positive.
Suppose:
Beginning MRR = $100K
Ending MRR = $112K
Growth:
12%
The recurring base increased.
Positive growth can be driven by:
- new customers;
- existing-customer expansion;
- price increases;
- reactivations; or
- reduced churn and contraction relative to additions.
The growth rate alone does not identify the cause.
Negative MRR Growth
When ending MRR is below beginning MRR, growth is negative.
Suppose:
Beginning MRR = $500,000
Ending MRR = $475,000
Difference:
−$25,000
Growth:
−$25,000 ÷ $500,000 × 100 = −5%
MRR contracted by 5%.
The decline can result from churn, customer downgrades, pricing reductions, or insufficient new and expansion revenue.
Zero MRR Growth
If:
Beginning MRR = Ending MRR
then:
MRR Growth = 0%
But flat MRR does not mean there was no commercial activity.
Suppose:
New MRR = $100K
Expansion = $20K
Churn + Contraction = $120K
Net New MRR:
$0
The company ends with unchanged MRR despite substantial acquisition and revenue loss underneath the headline result.
MRR Growth Bridge
The recurring bridge explains the growth rate:
Ending MRR = Beginning MRR + New MRR + Expansion MRR − Churned MRR − Contraction MRR
Therefore:
MRR Growth % = (New MRR + Expansion MRR − Churned MRR − Contraction MRR) ÷ Beginning MRR × 100
If reactivation is tracked separately, it can be added to the positive side.
This decomposition turns a growth percentage into an operating explanation.
Example: Acquisition-Led MRR Growth
Suppose:
Beginning MRR = $1M
New MRR = $120K
Expansion = $20K
Churn = $30K
Contraction = $10K
Net New MRR:
$100K
Growth:
10%
Most positive movement comes from new customers.
The company has an acquisition-led growth model during this period.
Example: Expansion-Led MRR Growth
Now suppose:
Beginning MRR = $1M
New MRR = $30K
Expansion = $120K
Churn = $40K
Contraction = $10K
Net New MRR:
$100K
Growth:
10%
The headline result is identical.
But most growth comes from expansion revenue inside the existing customer base.
The business relies much less heavily on new acquisition.
Example: High Acquisition Masking Churn
Suppose:
Beginning MRR = $1M
New MRR = $200K
Expansion = $20K
Churn = $130K
Contraction = $40K
Net New MRR:
$50K
MRR growth:
5%
The company still grows 5%, but it needs $220,000 of positive additions to overcome $170,000 of revenue loss.
The headline growth rate understates how hard the acquisition engine is working to offset retention problems.
MRR Growth vs. Month-Over-Month Growth
Month-over-month growth is a general time-comparison formula that can be applied to revenue, customers, expenses, transactions, or other metrics.
MRR growth applies that growth concept specifically to recurring monthly revenue.
Suppose:
Total Monthly Revenue Grows = 25%
but:
MRR Grows = 6%
A large one-time contract or implementation project may explain much of the total-revenue growth.
The recurring base is growing more slowly.
MRR Growth vs. Revenue Growth
Suppose:
January
MRR = $500K
One-Time Revenue = $100K
Total Revenue = $600K
February
MRR = $525K
One-Time Revenue = $250K
Total Revenue = $775K
MRR growth:
($525K − $500K) ÷ $500K = 5%
Total revenue growth:
($775K − $600K) ÷ $600K ≈ 29.17%
The company reports nearly 30% monthly revenue growth while its recurring base grows only 5%.
Both numbers are correct but describe different business dynamics.
MRR Growth and Net Revenue Retention
Net revenue retention measures how the starting customer cohort’s recurring revenue changes after churn, contraction, and expansion.
MRR growth includes the effect of new customers as well.
Suppose:
Beginning MRR = $1M
Existing-customer cohort ends at:
$1.05M
NRR:
105%
New customers add:
$100K MRR
Total ending MRR:
$1.15M
Overall MRR growth:
15%
NRR explains 5% growth within the starting customer base.
New acquisition adds another 10 percentage points of total MRR growth in this simplified example.
MRR Growth and Gross Revenue Retention
Gross revenue retention shows how much starting MRR survives before expansion.
Suppose:
Beginning MRR = $1M
GRR:
90%
This means $100,000 of starting MRR is lost to churn and contraction before expansion.
If the company still reports 20% total MRR growth, new and expansion MRR must more than compensate for that loss.
A high growth rate combined with weak GRR can therefore indicate a fast-growing but leaky recurring-revenue engine.
MRR Growth and Logo Retention
Logo retention helps explain whether recurring growth is supported by stable customer relationships.
Suppose:
MRR Growth = 15%
but:
Logo Retention Is Weak
The company may be replacing many lost customers with new ones or shifting toward larger accounts.
Another business could show only 8% MRR growth with exceptionally strong logo retention and expansion.
The slower headline growth may be more durable.
MRR Growth and Customer Churn
Customer churn reduces the customer base available to produce recurring revenue.
Suppose:
Beginning Customers = 1,000
Monthly Churn = 5%
The company loses:
50 Customers
If each contributes $500 MRR:
Churned MRR = $25,000
New and expansion MRR must first replace that $25,000 before the overall recurring base grows.
Reducing churn can therefore increase MRR growth even without increasing customer acquisition.
MRR Growth Through Pricing
A price increase can create MRR growth without adding customers.
Suppose:
2,000 Customers × $50 = $100,000 MRR
Price increases to:
$55
If customer count is unchanged:
New MRR = $110,000
MRR growth:
10%
All growth came from pricing.
If the change causes customer churn, the realized growth rate can be lower—or negative.
MRR Growth From a Price Decrease
A price decrease percentage can initially reduce MRR unless the customer base or usage expands sufficiently.
Suppose:
1,000 Customers × $100 = $100,000 MRR
Price falls 10% to:
$90
With customer count unchanged:
MRR = $90,000
Growth:
−10%
To restore $100,000 MRR:
Required Customers = $100,000 ÷ $90 ≈ 1,111.11
At least 1,112 customers would be required in whole-customer terms to exceed the old MRR level in this simplified model.
Discounting and MRR Growth
A permanent discounted price can reduce recurring growth even when it improves customer acquisition.
Suppose a promotion lowers monthly price from $100 to $80.
Before the offer:
1,000 Customers = $100K MRR
After the offer:
1,400 Customers × $80 = $112K MRR
MRR growth:
12%
Customer count grows 40%.
MRR grows only 12% because monetization per customer is lower.
The promotion may still be economically attractive, but margin and acquisition cost also need to be evaluated.
MRR Growth and Margin
MRR growth should be interpreted alongside margin.
Suppose MRR grows:
From $1M to $1.2M = 20%
Gross margin falls:
From 80% to 60%
Beginning monthly gross profit:
$1M × 80% = $800K
Ending:
$1.2M × 60% = $720K
MRR grows 20%.
Gross profit falls 10%.
The recurring base is larger but economically less productive.
MRR Growth and CAC Payback
Rapid MRR growth can require substantial customer-acquisition spending.
Suppose new MRR increases quickly because the company doubles paid acquisition.
If the resulting CAC payback period also doubles, the company may face increasing cash requirements.
Recurring growth should therefore be evaluated not only by speed but by the cost and time required to generate it.
MRR Growth and LTV:CAC
The lifetime value to cac ratio adds another quality dimension.
Suppose MRR growth accelerates from 5% to 12% monthly, but acquisition spending rises so sharply that LTV:CAC falls from:
4:1 to 1.5:1
The company is growing faster but generating less expected customer value per acquisition dollar.
Faster recurring growth is not automatically better growth.
MRR Growth and the SaaS Magic Number
The magic number saas helps connect recurring-revenue growth with sales and marketing expenditure.
Two companies can each produce 10% MRR growth.
Company A spends $500,000 to create the relevant growth.
Company B spends $2 million.
Their headline growth rates are identical, but their commercial efficiency is very different.
The Magic Number provides the spending context that the MRR growth percentage lacks.
MRR Growth and Average Revenue Per Account
Average revenue per account can help decompose recurring growth.
Because approximately:
MRR = Active Accounts × Recurring ARPA
MRR can grow through:
- more accounts;
- greater recurring revenue per account;
- or both.
Suppose account count stays at 1,000.
ARPA rises:
From $500 to $550
MRR increases:
From $500K to $550K
Growth:
10%
The recurring base grew entirely through monetization.
MRR Growth and Average Revenue Per User
For a user-based business:
MRR ≈ Paying Users × Monthly Recurring ARPU
Suppose paying users rise 20% while ARPU falls 10%.
Starting:
100,000 Users × $10 = $1M MRR
Ending:
120,000 × $9 = $1.08M
MRR growth:
8%
User growth is much faster than revenue growth because average monetization declined.
The average revenue per user trend helps explain the difference.
Absolute MRR Growth vs. Percentage Growth
Suppose Company A grows:
From $100K to $120K
Absolute increase:
$20K
Growth rate:
20%
Company B grows:
From $10M to $10.5M
Absolute increase:
$500K
Growth rate:
5%
Company A grows faster in percentage terms.
Company B adds 25 times more MRR dollars.
Both absolute and percentage growth matter.
Why Growth Rates Usually Decline as the Base Gets Larger
Suppose a company adds a consistent:
$100K Net New MRR per Month
When beginning MRR is $500K:
Growth = 20%
At $1M:
10%
At $2M:
5%
The business adds the same $100,000 each month, yet the percentage growth rate declines because the denominator becomes larger.
Slowing percentage growth does not necessarily mean the company is adding fewer recurring-revenue dollars.
MRR Growth Acceleration
Suppose growth rates are:
January to February = 4%
February to March = 6%
March to April = 8%
The recurring base is growing at an increasing percentage rate.
That is growth acceleration.
Possible drivers include stronger new acquisition, better expansion, lower churn, better pricing, or several effects together.
MRR Growth Deceleration
Suppose:
10% → 8% → 6% → 4%
MRR is still growing, but the rate is slowing.
This is growth deceleration.
It can happen because:
- the revenue base is larger;
- acquisition slows;
- churn rises;
- expansion weakens;
- a price increase anniversary passes; or
- market demand becomes more difficult.
A falling growth rate is not the same thing as declining MRR.
Compounding MRR Growth
If MRR grows by a constant percentage each month:
Future MRR = Starting MRR × (1 + Monthly Growth Rate)^Number of Months
Suppose:
Starting MRR = $100,000
Monthly Growth = 5%
After 12 compounded months:
$100,000 × 1.05¹² ≈ $179,586
The mathematical increase is approximately:
79.59%
This is much greater than simply multiplying:
5% × 12 = 60%
because each month’s growth builds on a larger base.
Annualizing an MRR Growth Rate
A constant monthly growth rate can be converted into a mathematical annualized rate:
Annualized Growth = (1 + Monthly MRR Growth Rate)¹² − 1
At 3% monthly:
1.03¹² − 1 ≈ 42.58%
At 5%:
≈ 79.59%
At 10%:
≈ 213.84%
These are mathematical annualizations, not forecasts.
High monthly growth rates often become harder to maintain as MRR scales.
MRR Growth From $0
If beginning MRR is zero and ending MRR is $10,000:
($10,000 − $0) ÷ $0
is undefined.
The company added:
$10,000 of MRR
but a conventional percentage growth rate cannot be calculated from a zero denominator.
For a new recurring business, report the absolute MRR addition or mark the percentage as not meaningful.
MRR Growth Trend Example
Suppose:
| Month | MRR | MoM MRR Growth |
|---|---|---|
| January | $500K | — |
| February | $550K | 10.0% |
| March | $594K | 8.0% |
| April | $630K | 6.06% |
| May | $655K | 3.97% |
MRR increases every month.
Percentage growth slows steadily.
Management should determine whether net new MRR dollars are also declining or whether the percentage slowdown primarily reflects a larger recurring base.
Same Growth Rate, Different Quality
Suppose two companies both report:
10% MRR Growth
Company A:
GRR = 98%
Strong Expansion
Efficient Acquisition
Company B:
GRR = 75%
Heavy Discounting
Large Acquisition Spend
The headline recurring growth is identical.
The durability and economics are not.
MRR growth should therefore be evaluated with retention, margin, and acquisition metrics.
What Is a Good MRR Growth Rate?
There is no universal rate.
An appropriate result depends on:
- company size;
- market maturity;
- starting MRR;
- customer retention;
- gross margin;
- acquisition cost;
- capital availability;
- customer segment; and
- stage of growth.
A young company can grow rapidly from a small base.
A mature company can add far more MRR dollars while reporting a lower percentage.
The most useful benchmark combines the percentage rate with absolute net new MRR and underlying unit economics.
How to Improve Monthly Recurring Revenue Growth
MRR growth can improve through four broad mechanisms:
Add more new recurring customers.
Expand existing customer relationships.
Reduce churn.
Reduce contraction.
Pricing can also increase the recurring amount per customer.
The most attractive strategy depends on economics. Aggressive acquisition with poor retention can produce growth that is expensive to sustain, while strong retention and expansion can compound recurring revenue more efficiently.
Common Monthly Recurring Revenue Growth Mistakes
A common mistake is calculating growth from total monthly revenue rather than MRR.
Another is dividing the difference by ending MRR instead of beginning MRR.
Businesses can also celebrate net growth without examining churn and contraction underneath it.
Another error is assuming a high growth rate from a small base can continue indefinitely.
Annualizing a monthly rate by multiplying it by 12 ignores compounding.
A zero beginning value makes the standard percentage formula undefined.
Finally, MRR growth should not be interpreted independently of retention, pricing, margin, CAC payback, and sales efficiency.
Frequently Asked Questions
What is monthly recurring revenue growth?
Monthly recurring revenue growth measures how much a company’s recurring monthly revenue base increased or decreased relative to its beginning MRR.
What is the MRR growth formula?
MRR Growth % = (Ending MRR − Beginning MRR) ÷ Beginning MRR × 100
How do you calculate MRR growth?
If MRR rises from $200,000 to $230,000:
($230,000 − $200,000) ÷ $200,000 × 100 = 15%
Is MRR growth the same as MRR?
No.
MRR is the amount of recurring monthly revenue.
MRR growth is the percentage change in that amount.
Is MRR growth the same as month-over-month growth?
MRR growth can be measured month over month, but general MoM growth can apply to any metric. MRR growth specifically concerns recurring monthly revenue.
What causes MRR to grow?
New customers, existing-customer expansion, pricing increases, and reactivations can increase MRR. Lower churn and contraction also improve net growth.
What causes negative MRR growth?
Churn and contraction exceeding new and expansion MRR produce negative growth.
Can MRR growth be positive while GRR is weak?
Yes.
Strong new acquisition and expansion can overcome substantial churn and contraction.
Can NRR exceed 100% while total MRR growth is low?
Yes.
Existing customers can expand strongly while new customer acquisition remains weak, producing strong NRR but modest total MRR growth.
Can customer count grow faster than MRR?
Yes.
That happens when newly added customers generate less recurring revenue per account or user than the existing base.
Can MRR grow while customer count falls?
Yes.
Expansion, higher pricing, or a shift toward larger accounts can increase recurring revenue despite fewer customers.
How do price decreases affect MRR growth?
Lower prices reduce MRR unless greater customer volume, usage, retention, or expansion compensates for the lower recurring amount per customer.
Why does margin matter when MRR is growing?
MRR measures recurring revenue, not profit. Revenue can grow while gross profit falls if margins deteriorate enough.
How does CAC payback relate to MRR growth?
Acquisition can create rapid MRR growth but require substantial upfront spending. CAC payback shows how quickly customer contribution recovers that investment.
How does the SaaS Magic Number relate to MRR growth?
It adds sales-and-marketing efficiency context by relating recurring-revenue growth to commercial spending.
How do you annualize monthly MRR growth?
For a constant monthly rate:
Annualized Growth = (1 + Monthly Growth Rate)¹² − 1
This is a mathematical annualization and should not be treated as a guaranteed forecast.
What happens when beginning MRR is zero?
The conventional percentage-growth formula is undefined because the denominator is zero. Report the absolute MRR added instead.
Why is monthly recurring revenue growth important?
It shows the speed at which the recurring business is expanding or contracting. Breaking the rate into new MRR, expansion, churn, and contraction reveals whether that growth is being created by durable customer economics or by continually replacing lost revenue.




