


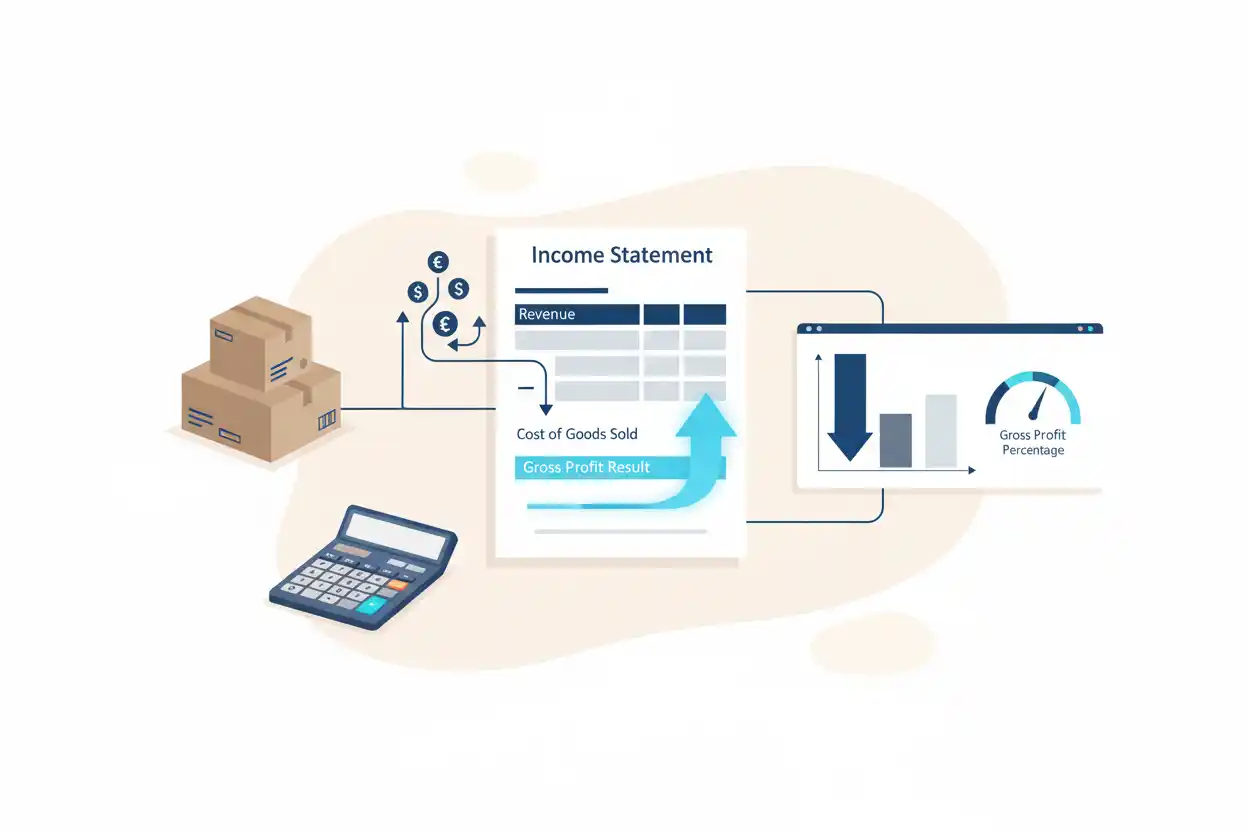
Gross profit is the amount of revenue a business keeps after subtracting the direct cost of the goods or services it sold. It shows, in dollar terms, how much money remains from sales before operating expenses, financing costs, taxes, and other costs farther down the income statement are considered.
If a company generates $500,000 in sales and incurs $300,000 in cost of goods sold, its gross profit is $200,000.
That $200,000 is not the company’s final profit. Instead, it represents the amount available to help cover payroll not included in cost of sales, rent, administration, marketing, interest, taxes, and other expenses.
Gross profit is therefore one of the foundational measurements in business finance. It connects revenue with the direct costs required to generate those sales and provides the starting point for several deeper measures of profitability.
What Is Gross Profit?
Gross profit is the difference between revenue and cost of goods sold, commonly abbreviated COGS.
In its simplest form:
Gross Profit = Revenue − Cost of Goods Sold
Suppose a retailer sells $80,000 of merchandise during a month and the merchandise sold cost the retailer $48,000.
The calculation is:
Gross Profit = $80,000 − $48,000
Gross Profit = $32,000
The business therefore generated $32,000 of gross profit during the period.
This calculation focuses on the first major layer of profitability. It does not attempt to calculate everything the business ultimately earns.
Understanding that boundary is important because profit can refer to several different levels of earnings, including gross profit, operating profit, and net profit.
Gross Profit Formula
The standard gross profit formula is:
Gross Profit = Revenue − Cost of Goods Sold
Revenue represents the sales associated with the period being measured. Cost of goods sold represents the costs classified as directly associated with producing, purchasing, or otherwise supplying the goods or services that generated those sales.
The detailed composition of COGS depends on the business and its accounting policies. The dedicated cost of goods sold calculation therefore needs to be understood separately rather than assuming every business includes exactly the same expenses.
How to Calculate Gross Profit
Consider a manufacturer with the following annual figures:
Revenue: $1,250,000
Cost of goods sold: $775,000
Apply the formula:
Gross Profit = $1,250,000 − $775,000
Gross Profit = $475,000
The manufacturer’s gross profit is $475,000.
This means $475,000 remains after the costs classified within COGS have been deducted from revenue.
The calculation does not mean that the company earned $475,000 in final profit. Operating expenses and other costs still need to be considered.
Gross Profit Example
Suppose a furniture business sells 1,000 desks during the year.
Average selling price per desk: $400
Revenue: $400,000
Cost attributable to the desks sold: $250,000
Gross profit is:
Gross Profit = $400,000 − $250,000
Gross Profit = $150,000
The business generated $150,000 in gross profit from its $400,000 of sales.
If its operating expenses were another $110,000, however, the amount remaining from operations would be only $40,000 before considering other applicable items.
This is why gross profit should be interpreted as one layer of the income statement rather than as the company’s final earnings.
Where Gross Profit Appears on the Income Statement
Gross profit normally appears near the top of an income statement.
A simplified structure looks like this:
Revenue
− Cost of goods sold
= Gross profit
− Operating expenses
= Operating profit
− Other expenses and applicable taxes
= Net profit
This progression shows why gross profit is useful. It separates the economics of producing or obtaining what was sold from many broader expenses involved in operating and financing the company.
What Does Gross Profit Tell You?
Gross profit answers a direct question:
How much money remains from sales after the direct cost of those sales has been deducted?
Suppose two companies each generate $1 million in revenue.
Company A has COGS of $600,000:
Gross Profit = $1,000,000 − $600,000 = $400,000
Company B has COGS of $800,000:
Gross Profit = $1,000,000 − $800,000 = $200,000
Company A generates twice as much gross profit from the same revenue.
However, that does not automatically mean Company A is the better overall business. Company A could have much larger operating expenses, greater capital requirements, more debt, or weaker cash collection.
Gross profit reveals an important part of the economics, but not the entire financial picture.
Gross Profit vs Gross Margin
Gross profit and gross margin are closely connected, but they are not interchangeable.
Gross profit is a dollar amount.
Gross Profit = Revenue − Cost of Goods Sold
Gross margin is a percentage.
Gross Margin = Gross Profit ÷ Revenue × 100
Suppose revenue is $500,000 and COGS is $300,000.
Gross profit is:
$500,000 − $300,000 = $200,000
Gross margin is:
$200,000 ÷ $500,000 × 100 = 40%
Therefore:
Gross profit = $200,000
Gross margin = 40%
The distinction matters because gross profit tells you the absolute amount generated, while gross margin describes how efficiently revenue converts into gross profit.
A growing company can produce more gross profit dollars even while its gross margin percentage declines.
Example: Gross Profit Rises While Gross Margin Falls
Suppose a company reports these results in Year 1:
Revenue: $1,000,000
COGS: $600,000
Gross Profit = $400,000
Gross Margin = 40%
In Year 2:
Revenue: $1,500,000
COGS: $975,000
Gross Profit = $525,000
Gross Margin = 35%
Gross profit increased from $400,000 to $525,000.
However, gross margin declined from 40% to 35%.
The company therefore generates more gross profit dollars because sales are larger, but it keeps a smaller percentage of each revenue dollar after COGS.
This example demonstrates why the dollar amount and percentage should be analyzed separately.
Gross Profit vs Operating Profit
Gross profit only subtracts cost of goods sold.
Operating profit goes further by subtracting operating expenses.
Suppose a company reports:
Revenue: $2,000,000
COGS: $1,200,000
Operating expenses: $500,000
Gross profit is:
Gross Profit = $2,000,000 − $1,200,000 = $800,000
Operating profit is:
Operating Profit = $800,000 − $500,000 = $300,000
The $500,000 difference represents operating expenses that are not included in the gross-profit calculation.
The corresponding operating margin converts operating profit into a percentage of revenue, making it useful when assessing profitability after the broader operating cost structure.
Gross Profit vs Net Profit
Gross profit measures profitability before many expenses.
Net profit reflects what remains after the broader set of expenses applicable to the business has been recognized.
Suppose:
Revenue: $1,000,000
COGS: $550,000
Operating expenses: $300,000
Interest and other applicable expenses: $50,000
Taxes: $25,000
Gross profit is:
$1,000,000 − $550,000 = $450,000
Net profit in this simplified example is:
$450,000 − $300,000 − $50,000 − $25,000 = $75,000
The business therefore has $450,000 of gross profit but only $75,000 of final net profit.
The related net profit margin would express that final profit relative to revenue.
Gross Profit vs Contribution Margin
Gross profit is also different from contribution margin.
Gross profit subtracts COGS from revenue.
Contribution margin subtracts variable costs:
Contribution Margin = Revenue − Variable Costs
The distinction matters because cost of goods sold and variable costs are not always identical.
Some costs included in COGS may behave as fixed costs over a particular range of activity, while some variable business costs may appear outside COGS.
Gross profit is primarily tied to financial-statement presentation. Contribution margin is especially useful for managerial decisions involving pricing, volume, incremental sales, and break-even calculations.
Are Fixed Costs Included in Gross Profit?
It depends on the nature of the cost and how the company classifies it.
A common mistake is to assume that gross profit always excludes every fixed cost. In practice, some fixed production costs may be included in inventory and cost of goods sold, while administrative fixed costs such as corporate office expenses may appear below gross profit.
For example, a manufacturer’s factory-related costs may be treated differently from the rent on its corporate headquarters.
Because classification can differ by business model and accounting presentation, analysts should examine the actual components of cost of sales rather than relying solely on whether a cost seems “fixed” or “variable.”
How Pricing Affects Gross Profit
Gross profit can rise when a company increases prices without experiencing an equivalent increase in direct costs.
Suppose a product costs $60 to supply and sells for $100.
Gross profit per unit is:
$100 − $60 = $40
If the company increases the selling price to $110 while the direct cost stays at $60:
$110 − $60 = $50
Gross profit per unit rises from $40 to $50.
However, pricing changes can also affect demand. A higher selling price that produces more gross profit per unit may reduce the number of units sold.
For that reason, gross-profit analysis can support pricing decisions, but it should be considered alongside volume, customer behavior, competitive positioning, and tools such as margin vs markup.
How Cost Changes Affect Gross Profit
Gross profit falls when direct costs rise without a corresponding increase in revenue.
Suppose a company sells a product for $200.
Originally, the product costs $120:
Gross Profit per Unit = $200 − $120 = $80
If the cost increases to $145:
Gross Profit per Unit = $200 − $145 = $55
Gross profit per unit falls by $25.
This type of pressure can result from higher materials costs, supplier pricing, manufacturing expenses, freight, labor included in COGS, purchasing terms, or changes in product mix.
Management may respond through pricing, sourcing, product redesign, efficiency improvements, or changes in sales mix.
Gross Profit and Break-Even Analysis
Gross profit should not be confused with break-even.
A business may generate positive gross profit on every sale and still lose money overall if that gross profit is insufficient to cover its remaining costs.
For instance, suppose a business earns $30 of gross profit per unit and sells 1,000 units, producing $30,000 of gross profit. If operating expenses outside COGS equal $50,000, the business is still unprofitable.
Break-even analysis examines the relationship among price, volume, variable costs, and fixed costs to determine when total economics move from loss to profit.
Gross profit is an input into understanding performance, but it does not independently establish whether the business has broken even.
Gross Profit and Unit Economics
Gross profit can also help evaluate unit economics.
Suppose a company earns $120 of revenue from a typical transaction and incurs $45 of direct cost.
Gross profit per transaction is:
$120 − $45 = $75
That figure provides one view of the economic value generated before broader operating and customer-related expenses.
However, if acquiring that customer is extremely expensive or supporting the customer requires substantial costs outside COGS, the overall unit economics may still be unattractive.
Gross profit therefore provides an important starting point without replacing a complete unit-level analysis.
Gross Profit and Inventory Turnover
For product-based businesses, gross profit becomes more informative when considered alongside inventory turnover.
Consider two products:
Product A generates $100 of gross profit each time it sells but turns over only twice per year.
Product B generates $50 of gross profit each time it sells but turns over ten times per year.
The larger gross profit per sale does not automatically make Product A economically superior. The speed at which inventory sells and capital is recycled can materially affect the overall return generated by the business.
Retailers and distributors therefore often need to consider both gross profit economics and inventory efficiency.
Gross Profit and Asset Turnover
The same principle applies to asset turnover.
Gross profit measures the dollars remaining after direct cost of sales. Asset turnover measures the amount of revenue generated relative to the asset base.
A high-gross-profit business that requires enormous amounts of inventory, property, machinery, or working capital may have very different economics from an asset-light company generating the same gross profit.
For that reason, profitability and capital efficiency should be analyzed together rather than treating gross profit as a complete measure of performance.
Gross Profit and Return on Assets
Gross profit also differs from return on assets.
Gross profit focuses on the relationship between sales and direct costs. Return on assets evaluates profit relative to the assets used by a business.
Two companies can produce identical gross profit while having significantly different asset bases.
If one requires $10 million of assets while another requires $2 million to support similar earnings, the underlying efficiency of their capital use may be substantially different.
Gross Profit and Cash Flow
Gross profit is an accounting profit measure. It does not show how much cash the business generated.
For example, a company may make a profitable sale on credit and recognize revenue and gross profit before receiving cash from the customer.
Likewise, inventory purchases, supplier payment timing, capital spending, receivables, and other working-capital movements can make cash generation differ significantly from reported gross profit.
Operating cash flow examines cash generated through operating activities, while free cash flow goes further by considering capital investment requirements.
Neither should be replaced with gross profit.
Gross Profit and Interest Coverage
Gross profit does not measure a company’s ability to service debt.
A business can report substantial gross profit while carrying enough operating expenses and debt that meeting interest obligations becomes difficult.
Interest coverage is designed more specifically to evaluate how comfortably earnings can cover interest expense.
As a result, gross profit can contribute to the economic foundation that eventually supports debt service, but it is not itself a solvency or debt-coverage ratio.
Gross Profit and Investment Returns
Gross profit is also distinct from investment appraisal metrics.
For example, internal rate of return evaluates the implied return associated with a sequence of project or investment cash flows. Gross profit simply measures sales minus COGS for a business or reporting period.
A product, division, or project can generate positive gross profit without producing an attractive investment return after operating costs, capital expenditures, timing, and required investment are considered.
What Causes Gross Profit to Increase?
Gross profit can increase because revenue grows, selling prices rise, direct costs fall, purchasing improves, production becomes more efficient, or sales shift toward products that generate more gross profit per unit.
However, the reason for an increase matters.
Suppose gross profit rises from $5 million to $6 million because revenue expands rapidly while gross margin deteriorates. That result is different from a company producing the same $1 million increase through better pricing and cost efficiency.
The gross-profit dollar trend should therefore be evaluated together with margins, sales growth, volume, product mix, and cost behavior.
What Causes Gross Profit to Decrease?
Gross profit can fall because sales decline, selling prices fall, discounts increase, supplier costs rise, manufacturing becomes less efficient, or the company sells a larger proportion of lower-profit products.
A reduction in gross profit is not automatically evidence that the business is deteriorating.
For example, a company may intentionally accept lower gross profit in the short term to launch a product, clear inventory, enter a market, or change its business mix.
The correct interpretation depends on why the figure changed and whether the change supports the company’s wider economics.
Can Gross Profit Be Negative?
Yes.
Gross profit becomes negative when cost of goods sold exceeds revenue.
Suppose revenue is $100,000 and COGS is $125,000:
Gross Profit = $100,000 − $125,000
Gross Profit = −$25,000
The company has a gross loss of $25,000.
This is generally a serious economic warning because the business is losing money before operating expenses, financing costs, and taxes are considered.
However, analysts should still investigate why the loss occurred. Unusual inventory adjustments, temporary production problems, major write-downs, startup conditions, accounting classifications, or one-time operational disruptions can affect reported results.
Is Higher Gross Profit Always Better?
Higher gross profit is generally preferable when other factors remain constant, but “higher” cannot be interpreted without context.
A company could double gross profit only by making an enormous investment in inventory, equipment, acquisitions, or working capital.
Likewise, gross profit could increase while operating profit or cash flow declines.
A broader evaluation may therefore include measures such as return on equity or return on invested capital to examine how efficiently the business converts the capital supporting its operations into returns.
How to Analyze Gross Profit Over Time
Gross profit is usually more informative as a trend than as a single isolated number.
Suppose a company reports:
Year 1 gross profit: $2.0 million
Year 2 gross profit: $2.4 million
Year 3 gross profit: $2.9 million
At first glance, performance appears to be improving.
However, an analyst should also ask:
Did revenue grow faster or slower than gross profit?
Did the gross margin improve?
Did operating expenses grow faster than gross profit?
Was the improvement driven by higher prices, volume, or product mix?
Did working-capital requirements increase?
Did the company need substantially more assets or capital?
These questions help distinguish simple dollar growth from genuine improvement in business economics.
Comparing Gross Profit Between Companies
Gross profit is usually unsuitable for direct comparison between differently sized companies without additional context.
A company generating $1 billion of gross profit is obviously producing more gross-profit dollars than one generating $10 million, but that tells you little about efficiency by itself.
Percentage margins and return metrics help normalize differences in scale.
Comparability also depends on accounting presentation. Businesses may classify certain costs differently, particularly when they operate in different industries or use different distribution, production, and service models.
Before comparing gross profit between companies, examine how each business defines cost of sales and whether the underlying operations are sufficiently similar.
Limitations of Gross Profit
Gross profit is useful because it is simple, but that simplicity creates limitations.
It does not directly measure operating efficiency outside cost of sales. It does not incorporate financing costs. It does not capture taxes. It does not show capital intensity. It does not describe liquidity. It does not measure cash generation. It does not tell you how much shareholders ultimately earn.
A company can therefore report strong gross profit while experiencing weak final profitability or financial stress.
The metric works best as the first layer in a broader analysis rather than as a standalone verdict on business quality.
Why Gross Profit Matters
Gross profit reveals the dollar value created between sales and the direct costs recognized in producing those sales.
That makes it useful for understanding whether changes in revenue are actually translating into more economic value at the gross-profit level.
Managers can use it to evaluate products, pricing, sourcing, purchasing, and cost trends. Analysts can use it to understand income-statement structure and investigate changes in profitability. Business owners can use it to determine whether the core sales activity generates enough money to support the rest of the organization.
The key is to preserve the measurement’s scope:
Gross Profit = Revenue − Cost of Goods Sold
It is the dollar amount remaining after cost of goods sold—not the percentage margin, not operating profit, not net profit, and not cash flow.
Frequently Asked Questions
What is gross profit in simple terms?
Gross profit is the amount of revenue left after subtracting the direct cost of the goods or services sold. If a business has $100,000 in revenue and $60,000 in COGS, its gross profit is $40,000.
What is the gross profit formula?
The formula is:
Gross Profit = Revenue − Cost of Goods Sold
Revenue and cost of goods sold should relate to the same accounting period.
Is gross profit the same as gross margin?
No. Gross profit is normally expressed as a dollar amount, while gross margin expresses gross profit as a percentage of revenue.
For example, $40,000 of gross profit on $100,000 of revenue equals a 40% gross margin.
Is gross profit the same as net profit?
No. Gross profit subtracts only cost of goods sold from revenue. Net profit reflects the broader set of expenses recognized before reaching the company’s final profit.
Does gross profit include salaries?
It depends on how the salaries relate to operations and how the company classifies them. Certain direct production labor costs may be included in cost of goods sold, while administrative, sales, or corporate salaries are commonly recognized elsewhere.
Does gross profit include rent?
Not automatically. Production or facility costs may sometimes enter product costs depending on the accounting treatment, while office or administrative rent may appear in operating expenses. The correct treatment depends on what the cost relates to and how the business accounts for it.
Can gross profit be higher than revenue?
Under the normal revenue-minus-COGS calculation, positive COGS means gross profit will be below revenue. Unusual presentations, credits, reversals, or other accounting circumstances can complicate reported figures, so the underlying statements should be examined when an apparently unusual result appears.
Can gross profit be negative?
Yes. If cost of goods sold is greater than revenue, the business records a negative gross profit, often described as a gross loss.
For example:
$80,000 Revenue − $100,000 COGS = −$20,000 Gross Profit
What is a good gross profit?
There is no universal good gross-profit dollar amount because the appropriate figure depends heavily on company size, industry, sales volume, operating expenses, and capital needs.
For meaningful comparison, gross profit is often evaluated alongside gross margin and historical performance.
Why did gross profit increase but net profit decrease?
Gross profit can rise while net profit falls if operating expenses, interest, taxes, or other costs increase by more than the improvement in gross profit.
The two metrics measure profitability at different stages of the income statement.
Why is gross profit important?
Gross profit shows whether sales generate enough money above the direct cost of those sales to contribute toward operating expenses and eventual profit. It also helps analysts identify changes in pricing, product mix, sales volume, and direct costs.
How do you increase gross profit?
A business can potentially increase gross profit by increasing sales volume, raising prices where economically viable, reducing direct costs, improving purchasing terms, increasing production efficiency, reducing excessive discounting, or shifting sales toward products with stronger economics. The most appropriate approach depends on demand, competition, cost structure, and the company’s wider objectives.




