


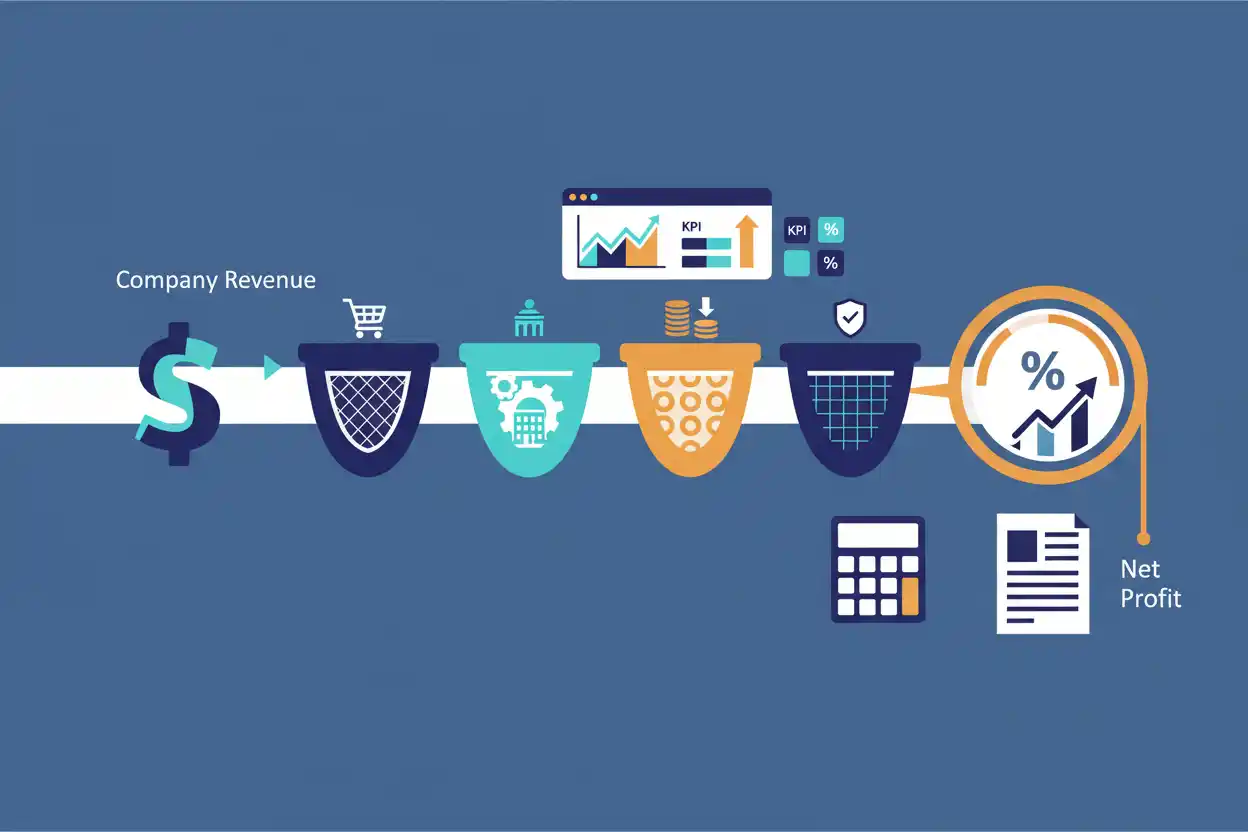
Net profit margin measures the percentage of revenue that remains as net profit after the business accounts for its expenses. It answers a straightforward profitability question: how much of each sales dollar ultimately becomes bottom-line profit?
If a company generates $1 million in revenue and earns $80,000 of net profit, its net profit margin is 8%.
Net Profit Margin = $80,000 ÷ $1,000,000 × 100 = 8%
That means the company retains $0.08 of net profit from each $1.00 of revenue after the expenses reflected in net profit.
Net profit margin belongs to the broader framework of business finance analysis. Unlike the dollar-based net profit figure, the margin converts bottom-line earnings into a percentage, making profitability easier to compare across periods and companies of different sizes.
What Is Net Profit Margin?
Net profit margin is the percentage of revenue represented by net profit.
The standard formula is:
Net Profit Margin = Net Profit ÷ Revenue × 100
Suppose a company reports:
Revenue = $2,500,000
Net profit = $250,000
Then:
Net Profit Margin = $250,000 ÷ $2,500,000 × 100
Net Profit Margin = 10%
A 10% net profit margin means approximately ten cents of every revenue dollar remains as net profit under the reported figures.
The ratio is normally calculated from figures found on the income statement, although analysts should verify exactly which revenue and net-income figures are being used when financial statements contain unusual or adjusted items.
Net Profit Margin Formula
The basic formula is:
Net Profit Margin = Net Profit ÷ Revenue × 100
Because net profit broadly represents revenue remaining after expenses, the relationship can also be understood conceptually as:
Net Profit Margin = (Revenue − Total Applicable Expenses) ÷ Revenue × 100
The direct net-profit formula is generally cleaner because actual financial statements may contain multiple layers of cost, operating expenses, interest, taxes, gains, losses, and other items.
The denominator should correspond to the revenue figure associated with the same reporting period as the net profit numerator.
How to Calculate Net Profit Margin
Consider a business with the following annual results:
Revenue = $1,500,000
Net profit = $120,000
Divide net profit by revenue:
$120,000 ÷ $1,500,000 = 0.08
Convert the decimal to a percentage:
0.08 × 100 = 8%
Therefore:
Net Profit Margin = 8%
The company earns eight cents of bottom-line accounting profit for every dollar of revenue.
Worked Net Profit Margin Example
Suppose a manufacturer reports:
Revenue = $4,000,000
Cost of goods sold = $2,200,000
Operating expenses = $1,050,000
Interest expense = $150,000
Tax expense = $150,000
First calculate gross profit:
Gross Profit = $4,000,000 − $2,200,000 = $1,800,000
Then calculate operating profit:
Operating Profit = $1,800,000 − $1,050,000 = $750,000
After interest:
Pretax Profit = $750,000 − $150,000 = $600,000
After taxes:
Net Profit = $600,000 − $150,000 = $450,000
Now calculate the net profit margin:
Net Profit Margin = $450,000 ÷ $4,000,000 × 100
Net Profit Margin = 11.25%
The company therefore retains approximately $0.1125 of net profit from every $1.00 of revenue.
This step-by-step progression also demonstrates why net profit margin is substantially different from gross profit. Gross profit appears much earlier in the income statement and does not yet incorporate the broader operating, financing, and tax structure.
What Does a 10% Net Profit Margin Mean?
A 10% net profit margin means that net profit equals 10% of revenue.
For every $100 of revenue:
Net Profit = $10
For every $1,000 of revenue:
Net Profit = $100
For $5 million of revenue:
Net Profit = $500,000
assuming the same 10% margin applies.
The remaining 90% of revenue has been absorbed by the costs, expenses, taxes, and other items reflected before arriving at net profit.
The percentage therefore provides an intuitive measure of how effectively revenue ultimately converts into bottom-line earnings.
Net Profit Margin vs Net Profit
Net profit and net profit margin use the same bottom-line earnings figure but present it differently.
Net profit is expressed in money:
Net Profit = Revenue − Applicable Expenses
Net profit margin expresses net profit relative to revenue:
Net Profit Margin = Net Profit ÷ Revenue × 100
Suppose two companies each earn $1 million of net profit.
Company A generates $10 million of revenue:
Net Profit Margin = $1 million ÷ $10 million = 10%
Company B generates $50 million of revenue:
Net Profit Margin = $1 million ÷ $50 million = 2%
Both companies earn the same absolute net profit, but Company A converts a much larger share of revenue into earnings.
This is the key cannibalization boundary between the two metrics: Net Profit owns the dollar bottom line; Net Profit Margin owns the percentage relationship between net profit and revenue.
Net Profit Margin vs Gross Margin
Gross margin measures profitability much earlier in the income statement.
Its formula is:
Gross Margin = Gross Profit ÷ Revenue × 100
Net profit margin instead uses final net profit:
Net Profit Margin = Net Profit ÷ Revenue × 100
Suppose:
Revenue = $1,000,000
Gross profit = $400,000
Net profit = $80,000
Gross margin:
$400,000 ÷ $1,000,000 × 100 = 40%
Net profit margin:
$80,000 ÷ $1,000,000 × 100 = 8%
The 32-percentage-point difference represents the effect of operating expenses, financing costs, taxes, and other items recognized after gross profit in this simplified example.
A company can therefore have strong product-level economics and still produce a weak bottom line.
Net Profit Margin vs Operating Margin
Operating margin measures operating profit as a percentage of revenue.
Operating Margin = Operating Profit ÷ Revenue × 100
Net profit margin includes additional items below operating profit.
Suppose:
Revenue = $2,000,000
Operating profit = $300,000
Net profit = $180,000
Operating margin:
$300,000 ÷ $2,000,000 × 100 = 15%
Net profit margin:
$180,000 ÷ $2,000,000 × 100 = 9%
The six-percentage-point difference reflects the effect of financing, taxes, and any other applicable items between operating profit and the bottom line.
Operating margin is useful when the objective is to evaluate the economics of core operations. Net profit margin gives the broader final-profit view.
Net Profit Margin vs EBITDA Margin
EBITDA excludes interest, taxes, depreciation, and amortization under its standard construction.
An EBITDA margin therefore sits farther from the final bottom line than net profit margin.
Suppose:
Revenue = $5 million
EBITDA = $1 million
Net profit = $300,000
Then:
EBITDA Margin = $1,000,000 ÷ $5,000,000 × 100 = 20%
while:
Net Profit Margin = $300,000 ÷ $5,000,000 × 100 = 6%
The substantial gap may reflect depreciation, amortization, financing costs, taxes, and other items.
For this reason, an attractive EBITDA margin should not automatically be interpreted as equally strong final profitability.
Net Profit Margin vs EBIT Margin
EBIT measures earnings before interest and taxes.
If EBIT equals operating profit under the financial presentation being analyzed, EBIT margin may closely resemble operating margin.
However, net profit margin occurs after interest and taxes.
Suppose:
Revenue = $10 million
EBIT = $1.5 million
Interest and taxes = $600,000
Net profit = $900,000
EBIT margin:
$1.5 million ÷ $10 million × 100 = 15%
Net profit margin:
$900,000 ÷ $10 million × 100 = 9%
That difference can help reveal how financing and taxation affect final earnings.
What Is a Good Net Profit Margin?
There is no universal net profit margin that is good for every company.
Appropriate margins differ by industry, business model, scale, pricing power, cost structure, capital intensity, competition, financing, taxation, geographic exposure, and economic conditions.
A grocery retailer operating on high sales volume may function successfully with a relatively thin net margin.
A specialized software or intellectual-property business may have a fundamentally different margin structure.
Similarly, an early-stage company reinvesting heavily for growth may report a low or negative margin while a mature company in the same sector reports a much higher one.
Meaningful benchmarks usually include the company’s own history, comparable businesses, normalized industry economics, management objectives, and the durability of the margin.
Is a Higher Net Profit Margin Better?
All else equal, a higher net profit margin means the company retains more net profit from each dollar of revenue.
But all else is rarely equal.
A company might increase its margin temporarily by cutting research, maintenance, customer service, employee development, or other expenditures that support future performance.
Another company might intentionally accept a lower current margin while investing in new stores, products, markets, or technology.
A higher net profit margin can also result from unusual gains or temporarily favorable taxes rather than stronger recurring operations.
The direction is useful, but the quality and source of the margin matter.
What Does a Low Net Profit Margin Mean?
A low net profit margin means only a small percentage of revenue reaches the bottom line.
Suppose:
Revenue = $5,000,000
Net profit = $100,000
Net Profit Margin = $100,000 ÷ $5,000,000 × 100 = 2%
Only two cents from every sales dollar becomes net profit.
That may reflect normal industry economics, or it may signal pressure from product costs, payroll, rent, marketing, financing expenses, taxes, inefficient operations, or competitive pricing.
A low margin is therefore a starting point for investigation rather than a diagnosis by itself.
Can Net Profit Margin Be Negative?
Yes.
If the company reports a net loss, net profit margin becomes negative.
Suppose:
Revenue = $1,000,000
Net loss = $150,000
Net Profit Margin = −$150,000 ÷ $1,000,000 × 100
Net Profit Margin = −15%
A −15% net profit margin means the company lost approximately $0.15 for every $1.00 of revenue during the period.
A negative margin can result from temporary investments, unusual charges, startup conditions, restructuring, cyclical weakness, or an economically unsustainable operating model.
Understanding the cause is more important than the negative sign alone.
Can Net Profit Margin Be Above 100%?
Under ordinary recurring business economics, a net profit margin above 100% would be unusual because it means net profit exceeds reported revenue.
However, unusual gains, accounting events, disposals, or other non-operating income can sometimes make reported net income unusually large relative to revenue.
When a margin looks economically surprising, inspect the underlying financial statements rather than assuming the figure represents normal recurring operations.
What Does a 0% Net Profit Margin Mean?
A 0% net profit margin means net profit is zero relative to revenue.
Net Profit Margin = $0 ÷ Revenue × 100 = 0%
At the final accounting-profit level, revenue and recognized expenses have offset one another.
This should not be confused with the more operational framework of break-even analysis, which examines selling price, variable costs, fixed costs, and volume.
Accounting break-even and a managerial break-even calculation may use different cost definitions and answer different questions.
How Revenue Growth Affects Net Profit Margin
Higher revenue does not automatically produce a higher net profit margin.
Suppose:
Year 1 revenue = $1,000,000
Year 1 net profit = $100,000
Year 1 Margin = 10%
In Year 2:
Revenue = $1,500,000
Net profit = $120,000
Year 2 Margin = 8%
Revenue increased 50%, and net profit increased 20%, yet the margin declined from 10% to 8%.
The company became larger and earned more total profit, but each revenue dollar produced less bottom-line earnings.
This illustrates why absolute growth and margin performance should be analyzed separately.
How Costs Affect Net Profit Margin
Net profit margin can fall whenever expenses consume a greater proportion of revenue.
Higher input costs, payroll, rent, logistics, marketing, depreciation, interest, taxes, and other costs can all exert pressure.
Understanding fixed costs and variable costs can help explain why margins respond differently to changes in sales.
If a company’s sales increase while fixed costs remain largely stable, margin may improve because those costs are spread over a larger revenue base.
If variable costs rise faster than selling prices, the opposite can occur.
How Pricing Affects Net Profit Margin
Pricing changes can improve net profit margin when the business can raise prices without losing enough sales volume to offset the benefit.
Suppose a business sells 100,000 units at $10.
Revenue:
100,000 × $10 = $1,000,000
Assume net profit is $100,000, producing a 10% margin.
If price increases to $10.50 and volume remains unchanged, revenue becomes $1.05 million.
If most costs remain unchanged, the incremental $50,000 can significantly improve net profit and margin.
However, customers may buy fewer units at the higher price.
The standalone markup metric can help establish selling price from cost, but markup should not be confused with bottom-line margin. A large markup on a product can coexist with a low company-wide net profit margin when overhead and other expenses are substantial.
Net Profit Margin and Gross Profit Pressure
A deterioration in gross profit can flow directly toward lower net profitability if other expenses remain constant.
Suppose revenue remains $2 million while cost of goods sold rises by $150,000.
If no pricing or cost reduction offsets the increase, gross profit falls by $150,000.
That lower gross profit leaves less money available to cover operating expenses, interest, and taxes, potentially reducing net profit by a similar pretax amount.
This is why changes in product cost, supplier pricing, manufacturing efficiency, and sales mix can eventually appear in the net margin.
Net Profit Margin and Operating Expenses
The difference between gross margin and net profit margin often reflects the scale of operating expenses.
Marketing, administrative salaries, offices, software, research, customer support, distribution, and other expenses may consume a large portion of gross profit.
The operating profit level helps identify what remains after those operating expenses before financing and tax effects are fully incorporated.
If gross margin is stable but net profit margin declines, examining operating expenses is a logical next step.
Net Profit Margin and Interest Expense
Debt financing can materially affect bottom-line profitability.
Suppose two companies have identical revenue and EBIT:
Revenue = $5 million
EBIT = $750,000
Company A pays $50,000 of annual interest.
Company B pays $300,000.
Before taxes and other differences, Company B has $250,000 less earnings available after interest.
The interest coverage ratio evaluates this financing burden more directly, while net profit margin captures its eventual effect on bottom-line profitability.
Net Profit Margin and Financial Leverage
Financial leverage can increase potential returns to equity when borrowed capital is used productively, but interest expense can also compress net profit margin.
A highly leveraged company may therefore report attractive operating margins while producing a much thinner final net margin.
The gap does not necessarily mean operations are weak. It may instead reflect financing choices.
However, greater leverage can also make bottom-line profitability more sensitive to changes in operating earnings and interest rates.
Net Profit Margin and Taxes
Taxes can cause two companies with similar operating performance to report different net profit margins.
Suppose each company earns $1 million before tax on $5 million of revenue.
Company A records $200,000 of tax expense:
Net Profit = $800,000
Net Profit Margin = 16%
Company B records $300,000:
Net Profit = $700,000
Net Profit Margin = 14%
The two-percentage-point gap occurs below the pretax level.
Changes in tax rates, jurisdictions, deductions, credits, deferred tax effects, and unusual tax items can therefore affect net margin without reflecting a comparable change in operating performance.
Net Profit Margin and Cash Flow
Net profit margin is an accounting-profit ratio, not a cash-flow ratio.
A company can report positive net income while experiencing weak cash generation because customers have not paid, inventory has increased, suppliers were paid early, or capital spending is substantial.
The distinction is visible when comparing net margin with operating cash flow.
The SEC also emphasizes that cash-flow information can help explain differences between net income and actual cash receipts and payments. For analysis, this means a strong margin should be checked against the company’s cash conversion rather than assumed to represent cash already received.
Net Profit Margin and Free Cash Flow
Free cash flow provides another perspective because it considers capital expenditure requirements under its applicable formula.
Imagine a company earning:
Revenue = $10 million
Net profit = $1 million
Its net profit margin is:
$1 million ÷ $10 million × 100 = 10%
But suppose the company needs $2 million of annual capital expenditure merely to maintain and expand its asset base.
The accounting margin may remain positive while free cash flow is weak or negative.
This distinction becomes especially important in capital-intensive industries.
Net Profit Margin and Working Capital
Changes in working capital can also separate profitability from liquidity.
A fast-growing company might report higher net profit while its accounts receivable and inventory increase even faster.
That expansion can consume cash.
The net profit margin tells you what percentage of revenue became accounting earnings.
It does not tell you how quickly those earnings converted into available cash.
Net Profit Margin and Liquidity
Strong liquidity ratios and strong net profit margin often support each other over time, but one does not guarantee the other.
A profitable company can experience temporary liquidity pressure when customers pay slowly or debt obligations fall due before expected collections.
Conversely, a company can hold a large cash balance and report excellent liquidity while operating at a net loss.
Profitability and short-term payment capacity should therefore be assessed separately.
Net Profit Margin and Return on Assets
Return on assets adds an asset-efficiency perspective.
Suppose two businesses have identical 10% net profit margins.
Company A produces $1 million of net profit using $5 million of assets.
Company B also produces $1 million of net profit but uses $20 million of assets.
Their margins are identical, but the amount of assets required to produce those earnings is very different.
Net profit margin measures profitability relative to sales. ROA measures profitability relative to the asset base.
Net Profit Margin and Return on Equity
Return on equity evaluates profit relative to shareholders’ equity.
Two companies can report identical net margins but significantly different ROE because they use different amounts of equity and debt financing.
A higher ROE produced through aggressive leverage may also carry greater financial risk.
This is why margin and return ratios complement rather than replace one another.
Net Profit Margin and Asset Turnover
Asset turnover measures how efficiently assets generate revenue.
A business can achieve attractive economic returns through a high margin, rapid asset turnover, or some combination of both.
For example, a high-volume retailer may operate with a thin net profit margin but turn its asset base rapidly.
A specialized business may operate with a much higher margin but generate less revenue per dollar of assets.
Understanding both dimensions gives a more complete view of operating economics.
Net Profit Margin and ROI
ROI measures a return relative to an investment amount under its chosen formula.
Net profit margin measures profit relative to revenue.
Suppose a project generates $1 million in annual sales and $100,000 of profit, creating a 10% net margin.
If establishing the project required $5 million of capital, the return on the investment may be relatively modest despite the 10% sales margin.
If the project required only $200,000, the investment economics could look very different.
Revenue efficiency and investment efficiency are not the same.
Net Profit Margin vs Net Present Value
The workbook maps net present value directly to this article, but NPV belongs to investment appraisal rather than accounting margin analysis.
Net profit margin asks:
What percentage of revenue became net profit during a period?
NPV asks:
What is the present value of expected future investment cash flows after discounting them at a required return?
A business can operate at a healthy net profit margin while an acquisition of that business produces negative NPV because the purchase price was too high.
Likewise, a temporarily low-margin investment could create positive NPV if future cash flows justify the capital committed.
Net Profit Margin and NFT Profit
NFT profit is a specialized transaction-level concept in the workbook.
An NFT transaction may involve purchase price, sale proceeds, marketplace fees, network fees, royalties, and other costs.
That calculation is not interchangeable with company-wide net profit margin.
A business’s net profit margin compares its final reported earnings with total revenue for a period. The NFT Profit page retains the transaction-specific calculation rather than expanding this broader profitability page into an asset-trading guide.
Net Profit Margin and Cash Flow Forecasting
Historical margins describe past performance.
Cash flow forecasting addresses expected future cash receipts and payments.
A company can therefore have a strong historical margin but still face future cash pressure because of upcoming tax payments, inventory purchases, debt maturities, capital expenditures, or slower collections.
Profitability analysis should answer whether the business creates earnings.
Cash forecasting should answer when money is likely to enter and leave the business.
How to Increase Net Profit Margin
A business can potentially increase net profit margin by raising economically sustainable prices, reducing unnecessary costs, improving product mix, increasing operating efficiency, negotiating better purchasing terms, controlling financing costs, or generating more revenue without a proportional increase in expenses.
However, every improvement should be evaluated for second-order effects.
Cutting customer support may reduce cost today but increase cancellations later.
Reducing inventory too aggressively may cause lost sales.
Raising prices may improve per-unit profitability but reduce volume.
The objective is therefore not simply to maximize the percentage in the current period. It is to improve sustainable profitability without damaging the underlying business.
Example: Improving Net Profit Margin Through Operating Leverage
Suppose a company has:
Revenue = $1,000,000
Variable and other revenue-linked expenses = $600,000
Relatively fixed expenses = $300,000
Net profit:
$1,000,000 − $600,000 − $300,000 = $100,000
Net margin:
$100,000 ÷ $1,000,000 = 10%
Now suppose revenue rises to $1.2 million while variable expenses rise proportionally to $720,000 and fixed expenses remain $300,000.
Net profit becomes:
$1,200,000 − $720,000 − $300,000 = $180,000
New margin:
$180,000 ÷ $1,200,000 = 15%
Revenue increased by 20%, but net profit increased by 80%.
The simplified example shows how a business with stable fixed expenses can experience expanding margins when additional sales generate enough contribution.
Actual companies may have more complex cost behavior, but the principle helps explain why scale can sometimes improve profitability.
Example: Rising Revenue but Falling Net Profit Margin
Suppose:
Year 1 revenue = $2,000,000
Year 1 net profit = $240,000
Year 1 Net Profit Margin = 12%
Year 2 revenue increases to $2,500,000, but net profit reaches only $225,000:
Year 2 Net Profit Margin = 9%
Revenue increased by $500,000.
Net profit decreased by $15,000.
The margin therefore compressed by three percentage points.
Possible causes include lower selling prices, unfavorable product mix, higher wages, higher input costs, additional marketing, expansion spending, increased interest expense, or taxes.
The ratio identifies the deterioration. Additional analysis identifies the cause.
Percentage Points vs Percentage Change
When comparing net profit margins, distinguish percentage points from percentage change.
If net profit margin rises from 8% to 10%, the increase is:
10% − 8% = 2 Percentage Points
The relative percentage increase in the margin is:
(10% − 8%) ÷ 8% × 100 = 25%
Saying the margin increased by 2% when it moved from 8% to 10% can therefore be ambiguous.
For financial analysis, “two percentage points” is usually clearer when comparing the two margin levels directly.
Basis Points and Net Profit Margin
Smaller margin changes are sometimes expressed in basis points.
One percentage point equals 100 basis points.
If net profit margin increases from 7.2% to 7.8%:
7.8% − 7.2% = 0.6 Percentage Points
or:
0.6 × 100 = 60 Basis Points
This terminology is useful when discussing modest changes in profitability.
How to Analyze Net Profit Margin Over Time
Trend analysis often provides more insight than a single margin.
Suppose a company reports:
Year 1: 5%
Year 2: 6%
Year 3: 8%
Year 4: 10%
The business is converting progressively more revenue into bottom-line earnings.
An analyst should determine whether the improvement reflects stronger gross margins, operating efficiency, financing changes, lower taxes, unusual gains, or some combination.
Now consider:
Year 1: 15%
Year 2: 13%
Year 3: 10%
Year 4: 7%
The downward trend deserves investigation even though the company remains profitable.
Margin direction is informative, but understanding why it changed is essential.
Comparing Net Profit Margins Between Companies
Net profit margin is particularly useful for comparing companies of different sizes because the result is normalized by revenue.
However, comparability still has limits.
Businesses in different industries may have fundamentally different cost structures.
Companies can use different financing strategies.
Tax environments can differ.
One business may own significant property while another leases it.
Another may be investing heavily for growth while a mature competitor is optimizing short-term earnings.
Accounting policies and unusual items can also affect the bottom line.
For meaningful comparisons, choose reasonably similar businesses and examine more than one period.
Adjusted Net Margin
Companies sometimes present an adjusted or non-GAAP net margin that excludes specified expenses or gains from reported net income.
Conceptually, such a measure may take the form:
Adjusted Net Margin = Adjusted Net Income ÷ Revenue × 100
An adjusted figure can provide additional analytical context, but it is not automatically equivalent to GAAP net profit margin.
Analysts should identify which expenses have been removed, whether similar adjustments recur frequently, and whether the methodology is consistent over time.
A company excluding a genuinely unusual one-time item presents a different analytical case from one repeatedly excluding ordinary expenses required to operate the business.
Reported and adjusted margins should therefore be labeled clearly.
Common Net Profit Margin Mistakes
A common mistake is dividing revenue by net profit rather than net profit by revenue.
Another is confusing net profit margin with gross margin or operating margin.
Users may also compare a GAAP net margin with a company’s adjusted non-GAAP margin without recognizing the difference in the numerator.
A fourth mistake is assuming a strong margin means strong cash flow. Accounting profit and cash receipts can diverge.
Another problem is judging a margin without industry context. A 5% margin can be attractive in one business model and weak in another.
Finally, analysts sometimes focus on one unusually strong year without checking whether an asset sale, tax benefit, or other nonrecurring item boosted net profit.
Limitations of Net Profit Margin
Net profit margin is useful because it summarizes bottom-line profitability in one percentage, but it does not tell the complete financial story.
It does not measure cash flow.
It does not show the amount of capital required to generate revenue.
It does not measure liquidity.
It can be affected by debt financing and tax structure.
It can be influenced by unusual gains and losses.
It does not show whether profit is growing in absolute dollars.
It can also obscure differences in asset intensity and business scale.
For these reasons, net profit margin works best alongside cash-flow measures, return ratios, leverage, asset efficiency, and detailed income-statement analysis.
Why Net Profit Margin Matters
Net profit margin turns the bottom line into a percentage that can be compared across revenue levels.
Its core formula is:
Net Profit Margin = Net Profit ÷ Revenue × 100
That formula answers one of the most useful questions in profitability analysis:
How much bottom-line profit does the business generate from each dollar of revenue?
A rising margin may indicate improved pricing, better cost control, operating leverage, lower financing costs, favorable taxes, or other improvements.
A declining margin can reveal cost pressure, pricing weakness, increased financing expense, unfavorable product mix, or other deterioration.
The ratio is most useful when its movement is traced back through the income statement rather than judged in isolation.
Frequently Asked Questions
What is net profit margin in simple terms?
Net profit margin is the percentage of revenue that remains as net profit after the expenses included in the company’s bottom-line earnings have been recognized.
What is the net profit margin formula?
The formula is:
Net Profit Margin = Net Profit ÷ Revenue × 100
If net profit is $100,000 and revenue is $1 million, the margin is 10%.
What does a 20% net profit margin mean?
A 20% net profit margin means the company earns approximately $0.20 of net profit for every $1.00 of revenue.
If revenue is $500,000, a 20% margin corresponds to $100,000 of net profit.
Is a higher net profit margin better?
A higher margin generally means more bottom-line profit is retained from each sales dollar, but the source and sustainability of the margin matter. Temporary gains or underinvestment can make a margin look stronger without improving long-term economics.
What is a good net profit margin?
There is no universal good percentage. Appropriate net profit margins vary by industry, business model, competitive environment, financing, taxes, scale, and maturity.
Can net profit margin be negative?
Yes. If the company reports a net loss, net profit margin becomes negative.
Negative Net Profit ÷ Positive Revenue = Negative Net Profit Margin
What is the difference between net profit and net profit margin?
Net profit is a dollar amount. Net profit margin expresses that profit as a percentage of revenue.
For example, $100,000 of net profit on $1 million of revenue equals a 10% net profit margin.
What is the difference between gross margin and net profit margin?
Gross margin reflects gross profit after cost of goods sold. Net profit margin reflects final net profit after the broader expense structure, including operating expenses and applicable financing and tax effects.
Why can revenue increase while net profit margin decreases?
Revenue can grow while costs grow even faster. Higher input costs, payroll, marketing, interest, taxes, discounting, or lower-margin sales can therefore reduce the percentage of revenue reaching the bottom line.
Is net profit margin the same as cash flow margin?
No. Net profit margin is based on accounting net profit. Cash-flow measures use actual cash activity and can differ because of receivables, inventory, payables, depreciation, capital spending, and other timing effects.
How can a business improve net profit margin?
Potential methods include sustainable pricing improvements, better cost control, more profitable product mix, improved operational efficiency, lower financing costs, and revenue growth that outpaces expense growth.
Should I compare net profit margins across different industries?
Cross-industry comparisons can be misleading because business models and cost structures vary substantially. Comparing companies within similar industries and examining each company’s historical trend usually provides better context.




