


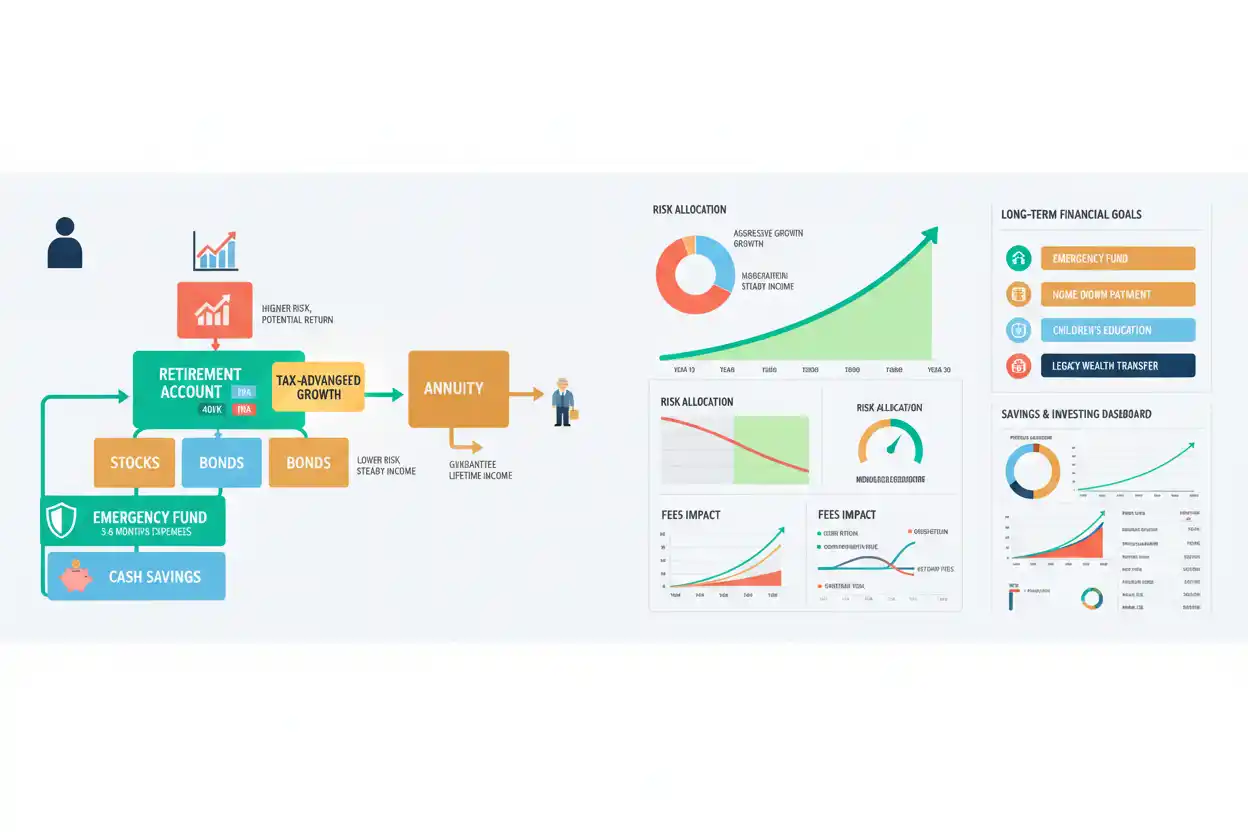
Savings and investing are two different ways of allocating money toward future needs.
Saving generally emphasizes liquidity, stability, and near-term access.
Investing accepts varying degrees of risk in pursuit of growth, income, or both.
The core question is not whether saving or investing is universally better.
It is:
When will the money be needed, how much loss can be tolerated, and what return is required to reach the goal?
The Savings & Investing framework connects cash planning, compounding, return measurement, portfolio risk, retirement accounts, bonds, annuities, and long-term financial goals.
SEC Investor.gov emphasizes time horizon, risk tolerance, asset allocation, diversification, compound growth, and investment costs as core investing concepts.
Start With the Goal
Before calculating return, define:
amount needed, time available, existing savings, future contributions, and acceptable risk.
A basic goal formula is:
Savings Gap = Future Goal − Existing Resources Available for the Goal
Suppose:
Goal = $100,000
Current savings = $25,000
Ignoring future growth:
Savings Gap = $100,000 − $25,000
$75,000
The next question is how long you have to close that gap.
Emergency Savings Comes Before Long-Term Risk
An emergency fund has a different purpose from a long-term investment portfolio.
Emergency cash exists to absorb unexpected:
income interruptions, repairs, urgent travel, insurance deductibles, or other short-notice expenses.
Money that may be needed immediately should not automatically be exposed to the same volatility as capital intended for a goal decades away.
Simple Savings Growth
If money earns a simple rate without compounding:
Future Value = Principal × (1 + rt)
Where:
r = annual rate
t = years
For $10,000 at 5% simple interest for three years:
FV = $10,000 × (1 + 0.05 × 3)
FV = $11,500
Most multi-period investment-growth calculations instead use compounding.
Compound Growth
The central compound interest formula is:
Future Value = Present Value × (1 + r)ⁿ
Suppose:
Starting investment = $10,000
Annual return = 7%
Time = 20 years
FV = $10,000 × (1.07)²⁰
FV ≈ $38,696.84
The investor earned growth on:
the original principal and previous accumulated gains.
Investor.gov describes compound interest as earning returns on prior accumulated interest or growth and provides a compound-interest calculator using starting capital, contributions, time, rate, and compounding frequency.
Contributions Matter as Much as Starting Capital
Many long-term portfolios grow through recurring contributions.
For equal end-of-period contributions:
Future Value of Contributions = C × [((1 + r)ⁿ − 1) ÷ r]
Suppose:
Annual contribution = $6,000
Annual return = 7%
Time = 25 years
FV ≈ $379,494
under an end-of-year contribution assumption.
The exact result differs when contributions occur monthly rather than annually.
The investment growth page owns the more detailed combination of compounding and contributions.
Future Value
The future value calculation answers:
What Could Today’s Money Become Later?
It is one of the most important concepts in financial planning because the future purchasing power of a goal rarely equals today’s nominal price.
Future-value models should therefore often be paired with inflation analysis.
Nominal vs Real Growth
Suppose:
Investment return = 7%
Inflation = 3%
A simple approximation says:
Real Return ≈ 7% − 3%
≈ 4%
A more precise relationship is:
Real Return = [(1 + Nominal Return) ÷ (1 + Inflation)] − 1
Real Return = (1.07 ÷ 1.03) − 1
≈ 3.88%
The real return measures improvement in purchasing power.
Measuring Investment Return
The simplest holding-period calculation is:
Holding Period Return = (Ending Value − Beginning Value + Income) ÷ Beginning Value
Suppose:
Beginning investment = $10,000
Ending value = $10,700
Dividends = $300
Return = ($10,700 − $10,000 + $300) ÷ $10,000
10%
The holding period return page owns this specific calculation.
Annualized Return
Returns covering several years need to be converted to a comparable annual basis.
The annualized return formula for a simple beginning-to-ending value comparison is:
Annualized Return = (Ending Value ÷ Beginning Value)^(1/n) − 1
Suppose:
$10,000 becomes $15,000 over five years.
Annualized Return = (15,000 ÷ 10,000)^(1/5) − 1
≈ 8.45%
This differs from simply dividing the 50% total gain by five.
CAGR
The specialist compound annual growth rate page applies the same geometric logic when analyzing growth over multiple years.
CAGR smooths a beginning-to-ending result into one equivalent annual rate.
It does not imply the investment actually earned exactly that return every year.
Average Return Can Be Misleading
The average return can describe the arithmetic mean of periodic returns.
Suppose:
Year 1 = +50%
Year 2 = −50%
Arithmetic average:
(50% − 50%) ÷ 2 = 0%
But $100 becomes:
$150
then:
$75
The investor lost 25%.
This is why geometric and annualized return measures matter.
Asset Allocation
Asset allocation determines how a portfolio is divided among categories such as:
stocks, bonds, and cash.
Investor.gov explains that asset allocation should reflect the investor’s time horizon and risk tolerance.
A longer time horizon can allow an investor to accept different volatility than someone who needs the money next year.
Diversification
Diversification spreads capital across different investments rather than concentrating everything in one position.
Investor.gov describes diversification as spreading money among investments so losses in one area may potentially be offset by results elsewhere.
Diversification does not guarantee a profit or eliminate market losses.
It primarily addresses concentration risk.
Alpha and Beta
The alpha page measures performance relative to a benchmark or risk-adjusted expectation under the relevant framework.
The beta page measures sensitivity to benchmark market movement.
These metrics belong to investment analysis rather than basic savings growth.
Bonds
The bonds hub connects:
price, coupon, yield, and maturity.
A bond can generate predictable contractual cash flows, but its market value can still change.
The bond yield and current yield pages separate different yield concepts.
Duration and Convexity
The duration page measures important aspects of bond interest-rate sensitivity.
Convexity refines that analysis by addressing curvature in the price-yield relationship.
These concepts become especially relevant when interest rates move materially.
Dividend Yield
For an income-paying stock:
Dividend Yield = Annual Dividend per Share ÷ Share Price × 100
The dividend yield page owns the calculation.
A high dividend yield should not be interpreted as guaranteed total return.
Share price can fall.
Earnings Yield
The earnings yield expresses earnings relative to market price.
It provides a different valuation lens from dividend yield because accounting earnings and cash distributions are not the same.
Annuities
Annuities exchange capital for an accumulation or payout structure defined by the specific contract.
The broader mathematics includes:
present value, future value, payment timing, and payout assumptions.
An annuity due differs from an ordinary annuity because payments occur at the beginning rather than the end of each period.
Annuity Payouts
Annuity payouts depend on the product and payout structure.
A simple financial-math annuity payment can be modeled from:
principal, interest rate, and number of payments.
Real insurance annuity products can include additional guarantees, expenses, mortality assumptions, and contract conditions.
401(k) Growth
A workplace 401(k) growth calculation combines:
employee contributions, employer contributions where applicable, time, return, and investment fees.
A plan match can materially increase the amount invested without requiring the same amount of additional employee contribution.
IRA Saving
An IRA provides another retirement-account structure.
Contribution limits and tax rules change over time, so current IRS guidance should control annual planning.
The underlying growth mathematics is still compounding.
Investment Fees
Fees reduce the return that remains invested.
The expense ratio expresses annual fund operating expenses as a percentage of fund assets.
Investor.gov warns that investment fees can have a substantial long-term effect because amounts paid in fees are no longer available to compound for the investor.
Expense-Ratio Example
Suppose:
Gross return = 7%
Annual investment expenses = 1%
A highly simplified net-return assumption becomes:
≈ 6%
Over long periods, a one-percentage-point difference compounds significantly.
The expense ratios page owns the long-term impact analysis.
Dollar-Cost Averaging
Dollar-cost averaging means investing a consistent dollar amount periodically rather than attempting to select one perfect entry point.
When price is lower, the same contribution buys more units.
When price is higher, it buys fewer.
The strategy does not guarantee profit, but it can create a disciplined contribution process.
Lump-Sum Investing
Lump-sum investing places available capital into investments at one time.
The lump sum vs SIP comparison should consider:
time in the market, volatility, contribution timing, and investor behavior.
Maximum Drawdown
The maximum drawdown measures the largest peak-to-trough decline over a specified period.
A portfolio that produces attractive average returns but experiences a 50% drawdown can feel very different from one with a smoother path.
Return should therefore never be analyzed without risk.
FIRE
The FIRE framework combines:
savings rate, investment growth, spending needs, and withdrawal assumptions
to model financial independence.
Its output is extremely sensitive to future returns, inflation, taxes, and spending.
College Cost Planning
College cost planning applies the same future-value and contribution principles to an education goal.
The shorter the remaining time horizon, the less room there is to recover from large investment losses.
Savings vs Investing Decision
A practical hierarchy is:
money needed soon → emphasize liquidity and capital stability.
money intended for distant goals → evaluate appropriate investment risk and diversification.
The dividing line is not fixed.
It depends on the investor’s actual obligations, risk tolerance, and time horizon.
Frequently Asked Questions
What is the difference between saving and investing?
Saving emphasizes liquidity and stability; investing generally accepts market or product risk in pursuit of return.
What is the compound-growth formula?
FV = PV × (1 + r)ⁿ
Why is time important?
More time allows more compounding periods and can provide more opportunity to recover from market fluctuations.
What is annualized return?
It converts multi-year growth into an equivalent annual compounded rate.
Why isn’t average return enough?
Arithmetic averages can hide compounding losses and volatility.
What is asset allocation?
It is how a portfolio is divided among broad asset categories such as stocks, bonds, and cash.
What is diversification?
It is spreading investments across multiple holdings or asset categories to reduce concentration risk.
Do investment fees matter?
Yes. Fees reduce the amount available to remain invested and compound.
What is real return?
It is investment return after adjusting for inflation.
Should emergency savings be invested aggressively?
Money needed on short notice usually has a different risk requirement from long-term investment capital.
Are high returns guaranteed?
No. Investment returns involve uncertainty and risk.
What should I calculate first?
Start with the goal amount, time horizon, existing savings, contribution capacity, and acceptable risk.
Final Takeaway
Savings and investing work best as a connected system.
First:
Protect Near-Term Liquidity
Then:
Define the Goal and Time Horizon
Next:
Use Compounding and Contributions to Estimate Required Growth
Finally:
Control Risk, Diversification, Inflation, and Fees
A $10,000 investment compounding at an illustrative 7% for 20 years becomes approximately:
$38,696.84
But the return assumption is never the entire story.
The portfolio must also fit the investor’s time horizon, risk capacity, tax structure, fees, diversification needs, and actual purpose for the money.




