


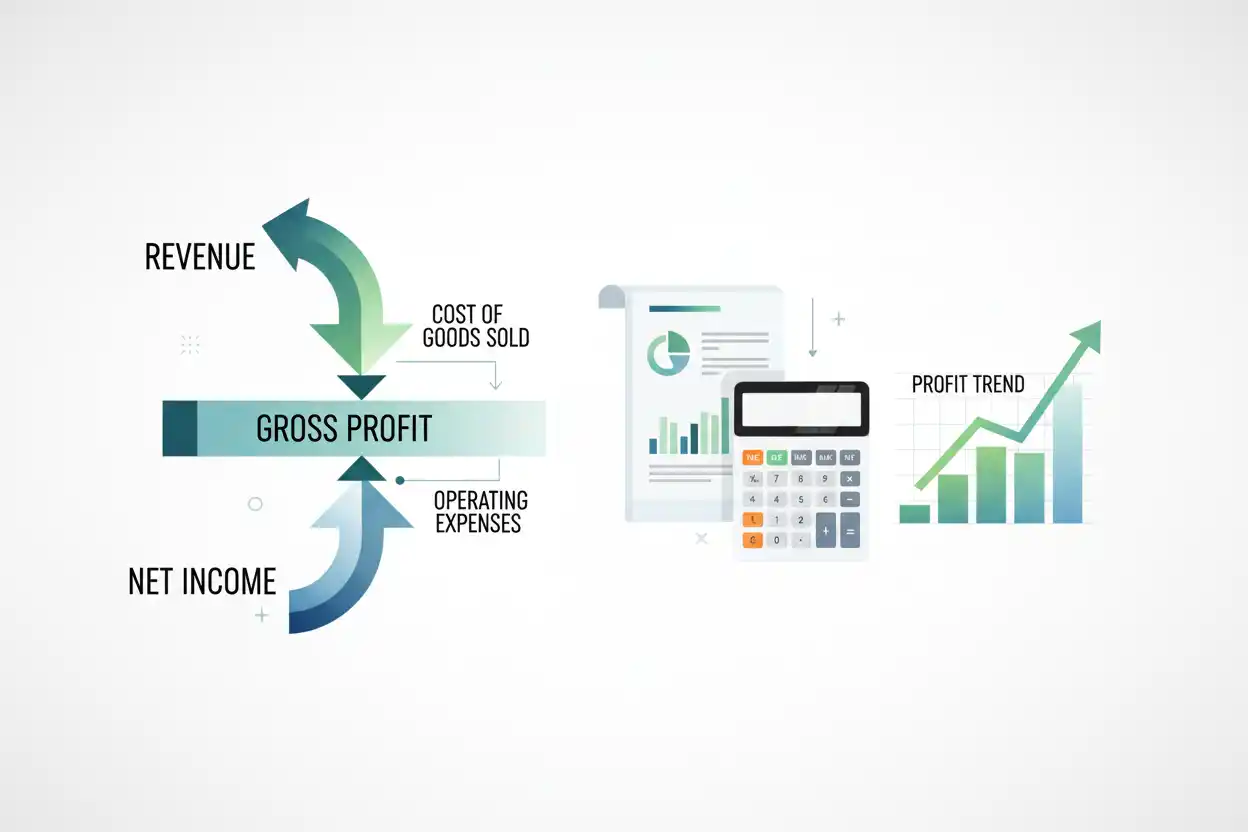
An income statement shows a company’s revenue, expenses, gains, losses, and resulting profit or loss over a specific period. It explains whether the business generated more economic income than the expenses recognized in producing that result.
A typical income statement begins with revenue, subtracts cost of goods sold where applicable, arrives at gross profit, subtracts operating expenses, accounts for other income and expenses, and ultimately reports net income.
Unlike a balance sheet, which describes financial position at a point in time, an income statement covers activity during a period, such as a month, quarter, or year.
What Is an Income Statement?
An income statement is a financial statement that summarizes financial performance over a reporting period.
It answers a fundamental question:
Did the business earn a profit or incur a loss during the period, and what produced that result?
A simplified structure looks like this:
Revenue − Expenses = Profit
For businesses that sell products, the statement commonly provides more detail:
Revenue − Cost of Goods Sold = Gross Profit
Then:
Gross Profit − Operating Expenses = Operating Income
After relevant non-operating items and taxes:
Pretax Income − Income Tax Expense = Net Income
Actual income statements can contain additional subtotals and classifications depending on the business and accounting framework.
Income Statement Formula
There is no single formula that captures every possible income statement format, but the broad relationship is:
Net Income = Total Revenue + Other Income − Total Expenses − Other Losses
A common operating structure is:
Gross Profit = Revenue − Cost of Goods Sold
Operating Income = Gross Profit − Operating Expenses
Then, in a simplified example:
Net Income = Operating Income + Non-Operating Income − Non-Operating Expenses − Taxes
The exact line items depend on the entity.
A bank, software company, manufacturer, retailer, and professional-services business can all have substantially different income statement structures.
Income Statement Example
Suppose a company reports the following annual results:
| Income Statement Item | Amount |
|---|---|
| Revenue | $1,000,000 |
| Cost of goods sold | $600,000 |
| Gross profit | $400,000 |
| Operating expenses | $250,000 |
| Operating income | $150,000 |
| Interest expense | $20,000 |
| Income before tax | $130,000 |
| Income tax expense | $30,000 |
| Net income | $100,000 |
First calculate gross profit:
Gross Profit = $1,000,000 − $600,000 = $400,000
Then operating income:
Operating Income = $400,000 − $250,000 = $150,000
Subtract interest:
Income Before Tax = $150,000 − $20,000 = $130,000
Finally:
Net Income = $130,000 − $30,000 = $100,000
The company earned $100,000 of net income during the period.
Revenue
Revenue generally appears near the top of the income statement.
It represents income generated from the company’s ordinary activities before the expenses required to produce that income are deducted.
Suppose a retailer sells 20,000 units at an average recognized selling price of $50:
Revenue = 20,000 × $50 = $1,000,000
Revenue is not the same as profit.
If the company incurs $900,000 of expenses to generate that $1 million of revenue, only $100,000 remains as profit in this simplified example.
Revenue also does not automatically equal cash collected. Under accrual accounting, sales can be recognized before customers pay.
Cost of Goods Sold
For businesses selling products, COGS represents the recorded cost associated with the goods sold during the period.
If revenue is $1 million and COGS is $600,000:
Gross Profit = $1,000,000 − $600,000 = $400,000
COGS connects closely with inventory because product costs generally remain in inventory until the related goods are sold under the applicable accounting treatment.
That relationship is why inventory errors can affect both the balance sheet and the income statement.
Gross Profit
Gross profit is the amount remaining after COGS is deducted from revenue.
Gross Profit = Revenue − Cost of Goods Sold
Suppose:
Revenue = $750,000
COGS = $450,000
Then:
Gross Profit = $750,000 − $450,000 = $300,000
Gross profit shows how much remains before operating expenses, financing costs, taxes, and other applicable items are considered.
The corresponding percentage measure is gross margin.
Operating Expenses
Operating expenses are costs associated with running the business that are not included in COGS under the applicable accounting classification.
Examples can include selling, administrative, office, marketing, professional, technology, and other operating costs.
Suppose gross profit is $300,000 and operating expenses are:
- Salaries and administration: $110,000
- Marketing: $35,000
- Office and facilities: $25,000
- Depreciation and other operating costs: $30,000
Total operating expenses:
$110,000 + $35,000 + $25,000 + $30,000 = $200,000
Operating income becomes:
Operating Income = $300,000 − $200,000 = $100,000
Operating Income
Operating income measures profit from operations before specified non-operating items are considered.
A simplified formula is:
Operating Income = Gross Profit − Operating Expenses
For a company without separately presented COGS, the presentation may differ.
Suppose revenue is $900,000, COGS is $500,000, and operating expenses are $250,000:
Gross Profit = $900,000 − $500,000 = $400,000
Operating Income = $400,000 − $250,000 = $150,000
Operating income helps separate operating performance from financing, taxes, and certain other non-operating effects.
Net Income
Net income is the final profit remaining after the applicable recognized expenses, losses, taxes, and other relevant items are incorporated.
Suppose operating income is $150,000, interest expense is $20,000, and taxes are $30,000:
Net Income = $150,000 − $20,000 − $30,000 = $100,000
A positive result is net income.
A negative result is generally a net loss.
The income statement supplies the components behind that result, while the net income metric focuses specifically on the bottom-line figure.
Income Statement vs. Balance Sheet
The income statement and balance sheet answer different questions.
The income statement measures performance over time.
The balance sheet measures financial position at a specific date.
For example, an income statement might cover:
January 1 through December 31
A balance sheet might report balances:
As of December 31
The statements are connected.
If a company earns profit and retains it, that accumulated effect can eventually influence equity on the balance sheet. Likewise, balance-sheet accounts such as inventory, receivables, payables, and fixed assets can affect future income-statement amounts.
Income Statement vs. Cash Flow Statement
An income statement does not measure cash movement directly.
The cash flow statement explains cash inflows and outflows from operating, investing, and financing activities.
Suppose a company sells $100,000 of goods on credit on the final day of the year.
Revenue can affect the income statement even though the related customer cash has not yet been collected.
Similarly, depreciation expense can reduce accounting profit without causing a matching current-period cash outflow.
This is why profitable businesses can still encounter liquidity problems.
Income Statement and Gross Burn
Gross burn focuses on cash spending, while the income statement focuses on recognized accounting performance.
The two can diverge substantially.
Suppose an early-stage company reports $250,000 of monthly operating expenses, including $20,000 of noncash depreciation.
Its cash spending may differ from the $250,000 accounting expense total because:
- depreciation is noncash when recorded;
- supplier payments may occur before or after expense recognition;
- prepaid expenses can shift timing;
- inventory purchases may consume cash before becoming COGS; and
- financing and capital expenditures are handled separately from ordinary income-statement expenses.
Gross burn therefore should not be calculated by simply copying total expenses from the income statement.
Income Statement and Inventory
Inventory links the balance sheet with the income statement.
Suppose a retailer starts with $100,000 of inventory, purchases another $500,000, and finishes with $120,000.
Under a simplified periodic calculation:
COGS = Beginning Inventory + Purchases − Ending Inventory
COGS = $100,000 + $500,000 − $120,000 = $480,000
That $480,000 affects the income statement as COGS.
The $120,000 ending inventory remains an asset rather than becoming current-period expense.
This timing is one reason inventory accounting can materially affect gross profit.
Inventory Carrying Cost and the Income Statement
Holding stock creates economic costs beyond the inventory’s purchase price.
Inventory carrying cost can involve storage, insurance, financing, obsolescence, shrinkage, handling, and other costs of keeping inventory.
Some of these costs may appear in different income-statement classifications depending on their nature and the accounting policy applied.
The management concept of carrying cost should therefore not automatically be treated as one universal income-statement line.
Its value is in understanding the full economic cost of holding inventory.
Economic Order Quantity and Profitability
Economic order quantity helps determine an order size intended to balance ordering and inventory holding costs under specific assumptions.
Those operating decisions can eventually influence expenses and profitability.
For example, ordering far more inventory than required could increase storage and carrying costs. Ordering excessively small quantities can increase ordering and receiving costs.
EOQ itself is not an income statement calculation. It is an operational model whose consequences can feed into financial results.
Forecast Variance and the Income Statement
Companies often forecast income statement lines before the reporting period.
A forecast variance then compares actual results with those expectations.
Suppose management forecast:
- Revenue: $1,000,000
- COGS: $600,000
- Operating expenses: $250,000
Actual results are:
- Revenue: $950,000
- COGS: $590,000
- Operating expenses: $270,000
Revenue variance:
$950,000 − $1,000,000 = −$50,000
COGS variance:
$590,000 − $600,000 = −$10,000
Operating-expense variance:
$270,000 − $250,000 = +$20,000
Looking at the complete income statement reveals that lower COGS did not automatically compensate for weaker revenue and higher operating expenses.
Multi-Step Income Statement Example
Consider a larger example.
A business reports:
| Item | Amount |
|---|---|
| Revenue | $2,500,000 |
| Cost of goods sold | $1,400,000 |
| Selling expenses | $250,000 |
| Administrative expenses | $300,000 |
| Depreciation included in operating expenses | $50,000 |
| Interest expense | $60,000 |
| Other income | $20,000 |
| Income tax expense | $120,000 |
Gross profit:
$2,500,000 − $1,400,000 = $1,100,000
Total specified operating expenses:
$250,000 + $300,000 + $50,000 = $600,000
Operating income:
$1,100,000 − $600,000 = $500,000
Income before tax:
$500,000 + $20,000 − $60,000 = $460,000
Net income:
$460,000 − $120,000 = $340,000
The statement therefore moves from $2.5 million of revenue to $340,000 of final net income through a sequence of economically distinct deductions and additions.
Single-Step vs. Multi-Step Income Statements
Income statements can be organized in different formats.
A single-step presentation generally groups revenues and gains together, groups expenses and losses together, and calculates the difference.
A multi-step income statement provides intermediate subtotals such as gross profit and operating income.
The multi-step approach can provide more analytical detail because it separates product economics, operating costs, and non-operating items.
The appropriate presentation depends on the entity and applicable reporting requirements.
Income Statement for a Service Business
A service company may not have conventional inventory or COGS in the same form as a retailer.
Suppose a consulting company reports:
Service Revenue = $600,000
Operating expenses:
Employee Compensation = $300,000
Rent = $50,000
Technology = $30,000
Marketing = $40,000
Other Operating Expenses = $60,000
Total expenses:
$300,000 + $50,000 + $30,000 + $40,000 + $60,000 = $480,000
Simplified operating profit:
$600,000 − $480,000 = $120,000
The absence of a traditional merchandise COGS line does not make the income statement less useful. The structure simply reflects a different business model.
Income Statement for a Retailer
A retailer commonly has a clearer revenue-to-COGS-to-gross-profit structure.
Suppose:
Revenue = $1,200,000
COGS = $720,000
Then:
Gross Profit = $480,000
If operating expenses are $350,000:
Operating Income = $480,000 − $350,000 = $130,000
This makes inventory purchasing, pricing, markdowns, product mix, and cost control particularly important to income-statement performance.
Income Statement Analysis
Reading an income statement involves more than checking whether net income is positive.
Several relationships deserve attention.
Revenue Trend
Is revenue growing, stable, or declining?
Revenue growth can be positive, but only if the economics of generating that growth remain sustainable.
Gross Profit Trend
If revenue rises but gross profit grows more slowly, COGS may be increasing faster than sales.
Operating Expense Trend
Rapid expense growth can reduce operating income even when gross profit improves.
Operating Income Trend
Operating income helps show whether the core operating structure is becoming more or less profitable.
Net Income Trend
Net income incorporates additional factors such as financing costs, taxes, and non-operating items.
Analyzing multiple levels prevents one headline number from hiding important changes elsewhere.
Common-Size Income Statement
A common-size income statement expresses each line as a percentage of revenue.
Suppose:
Revenue = $1,000,000
COGS = $600,000
Operating Expenses = $250,000
Net Income = $100,000
Then:
COGS % = $600,000 ÷ $1,000,000 × 100 = 60%
Operating Expense % = $250,000 ÷ $1,000,000 × 100 = 25%
Net Income % = $100,000 ÷ $1,000,000 × 100 = 10%
Expressing figures as percentages makes it easier to compare periods of different sizes.
Income Statement Trend Example
Suppose a company reports:
| Item | Year 1 | Year 2 |
|---|---|---|
| Revenue | $1,000,000 | $1,200,000 |
| COGS | $600,000 | $780,000 |
| Gross profit | $400,000 | $420,000 |
| Operating expenses | $250,000 | $285,000 |
| Operating income | $150,000 | $135,000 |
Revenue increased 20%.
Yet operating income declined from $150,000 to $135,000.
The reason becomes visible in the intermediate lines: COGS increased faster than revenue, reducing gross-margin economics despite higher sales.
This is why evaluating revenue alone can be misleading.
Accrual Accounting and the Income Statement
Under accrual accounting, revenue and expenses are generally recognized according to accrual principles rather than simply when cash changes hands.
Suppose a company completes $25,000 of services in December and collects the customer payment in January.
The timing of revenue recognition and cash collection can differ.
Likewise, an expense can be recognized before the related supplier invoice is paid.
This is a major reason the income statement and cash flow statement can tell different but complementary stories.
Income Statement Under Cash Accounting
Cash accounting uses a different recognition basis for qualifying businesses or reporting situations.
Under a cash basis, income and expenses are generally tied more closely to cash receipts and cash payments.
The income statement format can still summarize revenue and expenses, but the timing of recognition can differ from accrual-based reporting.
When comparing companies or periods, the accounting basis should therefore be understood before drawing conclusions.
Income Statement and Double-Entry Bookkeeping
Income-statement figures originate from underlying accounting records.
Double-entry bookkeeping requires total debits to equal total credits as transactions are recorded.
Revenue accounts generally have credit balances, while expense accounts generally have debit balances.
At the reporting level, those account balances are organized into the income statement to show the company’s financial performance for the period.
A balanced bookkeeping system is necessary, but equal debits and credits alone do not guarantee that the income statement is correctly classified or free of timing errors.
Common Income Statement Mistakes
One mistake is assuming revenue means cash received.
Another is treating all cash spending as an immediate income-statement expense.
Capital expenditures, inventory purchases, debt principal repayments, and other cash movements can receive different accounting treatment.
Businesses can also misinterpret higher revenue as automatically better performance while ignoring falling gross margins or rapidly increasing operating expenses.
Another common error is comparing income statements covering different periods without adjusting for the difference.
Finally, net income should not be treated as a substitute for cash flow. A business can report profit while experiencing serious cash pressure.
Frequently Asked Questions
What is an income statement in simple terms?
An income statement shows the revenue and expenses recognized during a period and the resulting profit or loss.
What is the basic income statement formula?
At the broadest level:
Profit = Revenue − Expenses
A more detailed structure can include:
Revenue − COGS = Gross Profit
Gross Profit − Operating Expenses = Operating Income
followed by other income, expenses, and taxes to arrive at net income.
What are the main parts of an income statement?
Common components include revenue, cost of goods sold, gross profit, operating expenses, operating income, non-operating items, taxes, and net income.
The exact structure varies by business.
Is an income statement the same as a profit and loss statement?
The terms are commonly used for statements that summarize revenue, expenses, and resulting profit or loss over a period.
Naming conventions can differ by organization and jurisdiction.
Is an income statement the same as a balance sheet?
No.
An income statement reports financial performance over a period.
A balance sheet reports assets, liabilities, and equity at a specific point in time.
Is an income statement the same as a cash flow statement?
No.
The income statement measures recognized revenue and expenses.
The cash flow statement tracks actual cash inflows and outflows.
Does depreciation appear on the income statement?
Depreciation can affect the income statement as an expense, although its exact classification depends on how the related asset is used.
Manufacturing depreciation, for example, may flow through inventory and COGS rather than always appearing as a separate line.
Does inventory appear on the income statement?
Ending inventory itself is generally a balance-sheet asset.
However, inventory costs associated with goods sold move into cost of goods sold and therefore affect the income statement.
What does a negative net income mean?
A negative final result generally means the company incurred a net loss for the period.
The income statement should be examined to determine whether the loss arose from weak revenue, low gross profit, high operating expenses, financing costs, unusual losses, or other factors.
Can revenue rise while profit falls?
Yes.
If COGS, operating expenses, interest, or other costs grow faster than revenue, profit can decline despite higher sales.
Why is the income statement useful?
It shows where revenue was generated, how costs reduced that revenue, and how the business arrived at profit or loss. Comparing its individual lines across periods can reveal changes that the final net-income number alone would miss.




