


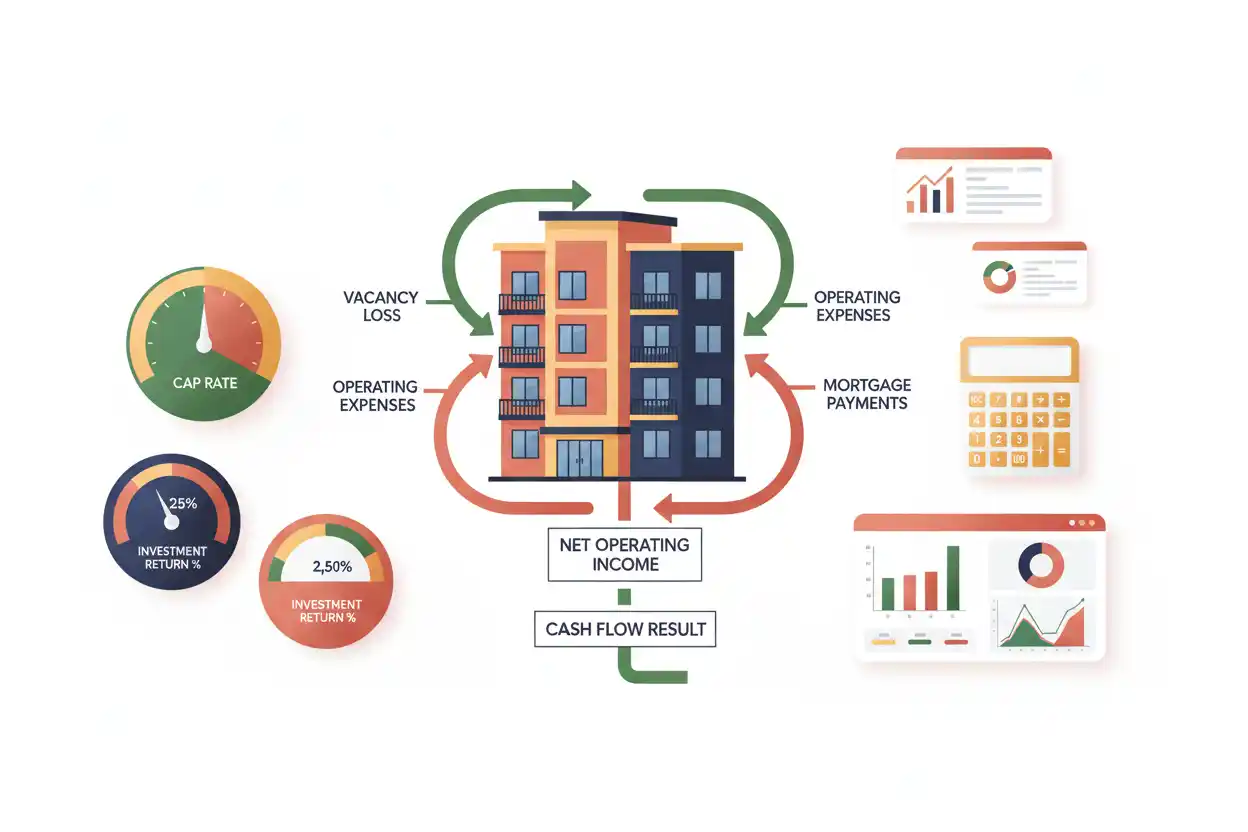
Rental property returns measure how much economic benefit an investment property generates relative to its cost or the investor’s cash committed. No single percentage captures the entire result, so rental investors commonly examine several related measures: net operating income, cap rate, annual cash flow, cash-on-cash return, equity growth, and total investment return.
For example, suppose a $300,000 rental property generates $22,500 of annual net operating income.
Its capitalization rate based on the $300,000 purchase price is:
Cap Rate = $22,500 ÷ $300,000 × 100
Cap Rate = 7.5%
If the investor finances the property, however, mortgage payments affect the cash actually left in the investor’s pocket. The property’s cap rate can remain 7.5% while its cash-on-cash return is substantially higher or lower depending on the financing terms and amount of cash invested.
That distinction is fundamental to understanding rental property returns.
Within business finance, rental property analysis combines operating economics, asset returns, financing, cash flow, and long-term investment valuation. The strongest analysis therefore looks beyond monthly rent and calculates what remains after realistic vacancy, operating expenses, capital needs, and financing obligations.
What Are Rental Property Returns?
Rental property returns describe the income, cash generation, and value changes produced by an income-generating property relative to the capital required to own it.
Several measurements can be useful:
Net operating income, or NOI, measures property income after operating expenses but before financing and certain investor-specific items.
Cap rate relates NOI to property value or acquisition price.
Cash flow measures the cash remaining after applicable property expenses and financing payments.
Cash-on-cash return compares annual pre-tax cash flow with the investor’s actual cash invested.
Total return can incorporate cash flow, mortgage principal reduction, property appreciation, and eventual sale proceeds.
A property can perform well according to one measure and poorly according to another.
For example, a property can have an attractive cap rate but weak cash flow if expensive financing consumes most of its NOI.
Likewise, a low-current-yield property can produce a strong long-term return if rents grow substantially or the property appreciates, although neither outcome should be assumed in advance.
Rental Property Return Formula
There is no single universal rental property return formula because different measures answer different questions.
A broad investment-return formula is:
Rental Property Return = Investment Gain ÷ Cash Invested × 100
However, “investment gain” must be defined.
For ongoing operating performance, investors often begin with:
Net Operating Income = Effective Gross Income − Operating Expenses
Then calculate cap rate:
Cap Rate = Net Operating Income ÷ Property Value × 100
For a financed investment, annual cash flow can be modeled as:
Annual Pre-Tax Cash Flow = NOI − Annual Debt Service − Other Cash Items Not Included in NOI
Then:
Cash-on-Cash Return = Annual Pre-Tax Cash Flow ÷ Total Cash Invested × 100
Long-term investment analysis can add appreciation, principal reduction, selling costs, taxes, and other changes in value.
The correct formula therefore depends on the question being asked.
The Main Rental Property Return Measures
Rental property returns become much easier to understand when the major metrics are kept separate.
Net Operating Income
NOI = Effective Gross Income − Operating Expenses
NOI measures the property’s operating income before financing costs and investor-specific income taxes.
Cap Rate
Cap Rate = NOI ÷ Property Value × 100
Cap rate measures unlevered income yield relative to property value.
Pre-Tax Cash Flow
Pre-Tax Cash Flow = NOI − Debt Service − Other Relevant Cash Outflows
This measures cash remaining after financing under the specified assumptions.
Cash-on-Cash Return
Cash-on-Cash Return = Annual Pre-Tax Cash Flow ÷ Cash Invested × 100
This measures annual cash yield on the investor’s actual equity cash invested.
Total Return
A broader holding-period return can conceptually include:
Total Economic Gain = Cash Flow + Principal Reduction + Net Appreciation − Transaction Costs ± Other Investment Effects
The denominator and time period need to be stated whenever total return is reported.
What Is Net Operating Income?
Net operating income is the starting point for many rental property return calculations.
A practical formula is:
NOI = Effective Gross Income − Property Operating Expenses
Effective gross income may include collected or expected rent plus other property-generated income after accounting for vacancy and credit loss assumptions.
Operating expenses can include items such as property taxes, insurance, management, routine repairs, maintenance, certain utilities paid by the owner, landscaping, and other costs required to operate the property.
Financing costs are generally kept outside NOI when the goal is to evaluate the economics of the property independently of how one particular investor finances it.
This separation makes it possible to compare the same building under different financing structures.
Gross Rental Income vs Effective Gross Income
Potential gross rental income assumes the property is rented at the stated rent without interruption.
If monthly rent is $3,000:
Potential Annual Rent = $3,000 × 12
Potential Annual Rent = $36,000
However, a property may experience vacancy or nonpayment.
If the model assumes 5% vacancy and credit loss:
Vacancy Allowance = $36,000 × 5%
Vacancy Allowance = $1,800
Expected rent after vacancy:
$36,000 − $1,800 = $34,200
Suppose the property also generates $600 from parking or another recurring property source.
Effective gross income becomes:
Effective Gross Income = $34,200 + $600
Effective Gross Income = $34,800
This $34,800 provides a more realistic starting point for NOI than assuming every possible rent dollar will always be collected.
Rental Property Operating Expenses
Operating expenses should reflect the actual cost of keeping the rental property operating.
Depending on the property and lease structure, these can include property taxes, insurance, routine repairs, maintenance, management fees, owner-paid utilities, landscaping, cleaning, association expenses, administrative costs, and an allowance or reserve for recurring replacement needs.
Not every property has every expense.
The important principle is consistency.
A property should not appear unusually profitable simply because ordinary expenses have been omitted from the analysis.
For example, an owner who self-manages a property may pay no external management fee today. However, an investor comparing properties as investments may still want to consider what professional management would cost.
Otherwise, part of the apparent investment return is actually compensation for the owner’s unpaid labor.
Complete Rental Property Return Example
Consider a rental property purchased for $300,000.
The investor makes a 25% down payment and finances the remaining 75%.
Assume:
Purchase price = $300,000
Down payment = $75,000
Closing and acquisition costs = $8,000
Initial improvements = $12,000
Loan amount = $225,000
Mortgage rate = 6%
Amortization = 30 years
Monthly rent = $3,000
The investor’s initial cash commitment is:
Initial Cash Invested = $75,000 + $8,000 + $12,000
Initial Cash Invested = $95,000
Now calculate the property’s operating economics.
Potential annual rent:
$3,000 × 12 = $36,000
Assume 5% vacancy and credit loss:
$36,000 × 5% = $1,800
Add $600 of other property income:
Effective Gross Income = $36,000 − $1,800 + $600
Effective Gross Income = $34,800
Assume annual operating expenses of:
Property taxes = $4,000
Insurance = $1,600
Routine maintenance and repairs = $1,800
Management = $2,784
Association, utilities, and miscellaneous property costs = $1,200
Replacement reserve = $1,200
Total modeled operating expenses:
Operating Expenses = $12,584
NOI becomes:
NOI = $34,800 − $12,584
NOI = $22,216
Now we can calculate several rental property returns from the same property.
Cap Rate Example
Using the $300,000 purchase price:
Cap Rate = $22,216 ÷ $300,000 × 100
Cap Rate ≈ 7.41%
The property’s cap rate is approximately 7.4% based on the purchase price and stated NOI assumptions.
Notice that the mortgage does not appear in this calculation.
Whether the investor purchases with cash, puts 25% down, or uses another financing structure, the physical property’s NOI is still $22,216 under the same operating assumptions.
The cap rate is intended to measure the property’s unlevered operating-income relationship with value.
What Is a Cap Rate?
The capitalization rate, usually called the cap rate, measures annual NOI relative to the property’s value.
Cap Rate = NOI ÷ Property Value × 100
If NOI is $30,000 and property value is $500,000:
Cap Rate = $30,000 ÷ $500,000 × 100
Cap Rate = 6%
This can be interpreted as a 6% unlevered operating-income yield on the stated property value.
It is not the investor’s final total return.
Cap rate does not automatically incorporate financing leverage, mortgage principal reduction, future appreciation, income taxes, or the complete economics of selling the property.
Purchase Price vs Current Value in a Cap Rate
The denominator must be clearly labeled.
An investor analyzing a new purchase might calculate:
Going-In Cap Rate = Current NOI ÷ Purchase Price
An owner evaluating today’s investment alternatives might instead calculate:
Current Cap Rate = Current NOI ÷ Current Property Value
Suppose a property was purchased for $200,000 years ago but is now worth $400,000 and generates $24,000 of current NOI.
Cap rate on original purchase price:
$24,000 ÷ $200,000 = 12%
Cap rate on current property value:
$24,000 ÷ $400,000 = 6%
Both calculations are mathematically valid.
They answer different questions.
A statement that a property has a “12% cap rate” without identifying the denominator can therefore be misleading.
Property Value From NOI and Cap Rate
The capitalization relationship can also be rearranged:
Property Value = NOI ÷ Cap Rate
Suppose stabilized NOI is $35,000 and the appropriate capitalization rate is 7%.
Property Value = $35,000 ÷ 0.07
Property Value = $500,000
This demonstrates why small changes in NOI or cap rates can have large effects on estimated income-based value.
If the same NOI were capitalized at 6%:
Value = $35,000 ÷ 0.06
Value ≈ $583,333
At 8%:
Value = $35,000 ÷ 0.08
Value = $437,500
The property produces the same $35,000 NOI in all three cases.
The assumed capitalization rate changes the indicated value substantially.
Why Cap Rates Change
Cap rates are influenced by expected returns, financing conditions, property risk, location, tenant quality, lease structure, property condition, expected growth, and broader market conditions.
A lower-risk property with stable income may trade at a lower cap rate than a property with substantial vacancy or operational uncertainty.
However, a lower cap rate should not automatically be described as better.
Because value and cap rate move inversely for a given NOI, a lower cap rate also means an investor is paying more for each dollar of current NOI.
The relevant question is whether the price appropriately reflects the property’s risk and future economics.
Cap Rate Is Not Mortgage Interest Rate
Cap rate and mortgage interest rate are entirely different concepts.
The cap rate measures property NOI relative to property value.
A mortgage rate determines the interest charged on borrowed money.
A property might have:
Cap rate = 7.5%
Mortgage rate = 6.0%
Another might have:
Cap rate = 5.0%
Mortgage rate = 7.0%
The difference between those figures can influence leveraged cash flow, but subtracting mortgage rate directly from cap rate is not a complete rental-property-return calculation.
Loan amortization, down payment, debt-service amount, expenses, and cash invested also matter.
The site’s mortgages and home loans cluster covers the financing mechanics separately.
Calculating Mortgage Cash Flow
Return to the worked example.
Loan amount = $225,000
Interest rate = 6%
Term = 30 years
The monthly principal-and-interest payment is approximately $1,349.
Annual principal-and-interest debt service is approximately:
Annual Debt Service ≈ $16,188
NOI is $22,216.
Simplified annual pre-tax cash flow after debt service is:
Pre-Tax Cash Flow = $22,216 − $16,188
Pre-Tax Cash Flow ≈ $6,028
The property therefore produces approximately $502 per month of pre-tax cash flow under these assumptions:
$6,028 ÷ 12 ≈ $502 per month
That figure is much smaller than the $3,000 monthly rent because rent is not profit.
Vacancy, operating expenses, and financing consume most of the gross rental income.
Cash-on-Cash Return Formula
Cash-on-cash return measures annual cash flow relative to the investor’s cash invested.
Cash-on-Cash Return = Annual Pre-Tax Cash Flow ÷ Total Cash Invested × 100
In our example:
Annual pre-tax cash flow ≈ $6,028
Cash invested = $95,000
Therefore:
Cash-on-Cash Return = $6,028 ÷ $95,000 × 100
Cash-on-Cash Return ≈ 6.35%
The property has approximately:
7.41% cap rate
and:
6.35% cash-on-cash return
under the stated assumptions.
The percentages differ because their numerators and denominators differ.
Cap Rate vs Cash-on-Cash Return
Cap rate evaluates property-level operating income without financing:
Cap Rate = NOI ÷ Property Value
Cash-on-cash return evaluates the investor’s financed cash yield:
Cash-on-Cash Return = Pre-Tax Cash Flow ÷ Cash Invested
Suppose two investors buy the same rental property.
Investor A pays entirely in cash.
Investor B uses a mortgage.
The property’s NOI and market value are identical for both investors, so the cap rate is identical.
Their cash-on-cash returns can be very different because Investor B has both less initial cash invested and annual debt service.
Leverage changes the equity return, not the property’s underlying NOI.
What Is a Good Cap Rate?
There is no universally good cap rate.
A cap rate has to be interpreted relative to property type, location, tenant quality, expected growth, condition, lease structure, financing environment, liquidity, and risk.
An 8% cap rate is not automatically better than a 5% cap rate.
The 8% property may have:
greater vacancy risk;
deferred maintenance;
weaker tenants;
shorter leases;
lower expected rent growth;
a difficult location; or
greater operational complexity.
Likewise, the lower-cap property may simply be overpriced.
Cap rate is a valuation and income metric, not a complete quality score.
What Is a Good Cash-on-Cash Return?
There is no universal cash-on-cash return target either.
An acceptable return depends on the investor’s alternatives, financing, risk tolerance, property type, future capital needs, expected rent growth, market liquidity, and long-term strategy.
A property producing a high cash-on-cash return through aggressive debt can carry substantially more downside risk than one producing a similar return with conservative financing.
The return should therefore be evaluated with the leverage and assumptions that created it.
Rental Cash Flow Formula
A practical annual cash-flow formula is:
Rental Cash Flow = Rental Income + Other Property Income − Vacancy Loss − Operating Expenses − Debt Service − Other Relevant Cash Costs
For a simpler monthly estimate:
Monthly Cash Flow = Monthly Cash Collected − Monthly Property Cash Outflows
However, monthly calculations can be misleading if large costs occur annually.
Property taxes, insurance, major repairs, leasing costs, and capital replacements do not necessarily arrive evenly each month.
A strong model converts irregular annual expenses into realistic reserves or forecasts rather than assuming that one quiet month represents normal profitability.
Positive Rental Property Cash Flow
Positive cash flow means the property generates more cash than it consumes under the specified calculation.
Suppose:
NOI = $30,000
Annual debt service = $20,000
Other relevant cash items = $2,000
Then:
Annual Cash Flow = $30,000 − $20,000 − $2,000
Annual Cash Flow = $8,000
The property generates approximately:
$8,000 ÷ 12 ≈ $667 per month
before any investor-specific taxes not included in the model.
Positive cash flow can provide a cushion against unexpected repairs, vacancies, and market changes.
The amount of the cushion matters.
A property producing only $50 of modeled monthly cash flow can become negative after one modest expense surprise.
Negative Rental Property Cash Flow
Negative cash flow occurs when property cash outflows exceed the cash inflows available to the investor.
Suppose:
NOI = $18,000
Debt service = $21,000
Then:
Cash Flow = −$3,000
The investor must contribute approximately:
$3,000 ÷ 12 = $250 per month
under the simplified model.
Negative cash flow does not automatically mean the investment will produce a negative total return.
Property appreciation or principal reduction could potentially offset some or all of the cash deficit over time.
However, those outcomes involve additional assumptions and do not eliminate the immediate requirement to fund the shortfall.
Rental Income Is Not Profit
A common rental-property mistake is treating monthly rent as profit.
Suppose rent is $3,000 per month.
Annual rent:
$36,000
That is gross income, not profit.
If vacancy, taxes, insurance, management, repairs, maintenance, association costs, and other operating expenses total $14,000:
NOI = $36,000 − $14,000
NOI = $22,000
If annual debt service is $17,000:
Pre-Tax Cash Flow = $5,000
The property collects $36,000 of rent but produces only $5,000 of pre-tax cash flow after those modeled expenses and financing.
The site’s broader profit framework follows the same principle: revenue alone does not establish profitability.
Vacancy and Rental Property Returns
Vacancy directly reduces rental income.
Suppose potential annual rent is $48,000.
At 2% vacancy:
Vacancy Loss = $960
At 8%:
Vacancy Loss = $3,840
The difference is:
$2,880 per year
If most operating expenses remain unchanged, much of that difference flows directly into lower NOI.
A return analysis that assumes 100% occupancy indefinitely is therefore particularly fragile unless the property economics genuinely support that assumption.
Vacancy should reflect realistic long-term experience rather than the property’s best recent month.
Credit Loss and Uncollected Rent
Occupancy does not guarantee collection.
A tenant can physically occupy a unit while rent remains unpaid.
Therefore, sophisticated underwriting can distinguish physical vacancy from credit loss or noncollection.
For a small rental property, these risks may be combined into one vacancy-and-credit-loss assumption.
The principle is the same: expected rent should be adjusted to reflect money that may not actually be collected.
For a larger rental business carrying significant tenant balances, receivables turnover can provide a separate view of billed amounts that remain outstanding, though it is not a substitute for property-level return analysis.
Repairs vs Capital Improvements
Routine repairs and major improvements should not be treated as though they are economically identical.
Replacing a broken component with a normal repair can be a recurring operating cost.
A major renovation that substantially improves the property can require a large capital outlay and potentially affect future rents, value, or useful life.
For investment-return analysis, both matter because both require cash.
However, they may enter NOI, cash-flow models, financial statements, and tax calculations differently.
A return model should therefore maintain a separate line for significant capital expenditures instead of hiding every large project inside ordinary monthly maintenance.
Capital Expenditure Reserves
A property can appear highly profitable in a year with no major replacements.
Yet roofs, HVAC systems, appliances, parking surfaces, plumbing, exterior work, and other property components eventually require capital.
Suppose a property generates $7,000 of annual pre-tax cash flow before any reserve.
If the investor realistically expects an average $3,000 annual long-term replacement burden:
Economic Cash Flow After Reserve ≈ $4,000
Ignoring capital needs can make a mature property look far more profitable than it is over a complete holding period.
The exact reserve should reflect the property’s condition and expected replacement schedule rather than one universal percentage.
Property Management Costs
Self-management can increase apparent cash return because the investor does not pay a third-party management company.
However, management still requires time and effort.
Suppose:
Cash flow before management = $10,000
Professional management would cost $3,000.
Owner-managed reported cash flow might remain $10,000.
Professionally managed cash flow would be:
$10,000 − $3,000 = $7,000
An investor comparing the property with passive alternatives may reasonably model a market management cost even when planning to self-manage.
That creates a more comparable view of the property’s economics independent of owner labor.
Property Taxes and Insurance
Property taxes and insurance can materially affect rental property returns because they can change even when the mortgage payment remains fixed.
Suppose annual property taxes increase from $3,000 to $4,500.
If rents and other costs do not change:
NOI Decline = $1,500
For a property previously generating $20,000 of NOI:
New NOI = $18,500
At a constant property value of $300,000, cap rate falls from:
$20,000 ÷ $300,000 = 6.67%
to:
$18,500 ÷ $300,000 ≈ 6.17%
Operating expense growth therefore deserves as much attention as rent growth.
HOA and Owner-Paid Utilities
Condominium fees, homeowners association dues, shared-property charges, water, trash, electricity, or other owner-paid utilities can materially affect cash flow.
A low-maintenance unit with a $600 monthly association fee may have very different economics from one with a $100 fee despite identical rent.
Always calculate the property-specific numbers.
A return model built only from purchase price and monthly rent can miss thousands of dollars in annual operating expense.
Gross Rental Yield
Gross rental yield is a simplified screening metric:
Gross Rental Yield = Annual Gross Rent ÷ Property Price × 100
Suppose:
Annual rent = $30,000
Property price = $300,000
Then:
Gross Rental Yield = 10%
This does not mean the property generates a 10% investment return.
Gross yield ignores vacancy, operating costs, financing, capital expenditure, and other expenses.
It is useful for quick screening but much less informative than NOI and cap rate.
Gross Yield vs Cap Rate
Suppose:
Annual gross rent = $30,000
Property price = $300,000
Gross yield:
10%
Now assume vacancy and operating expenses reduce NOI to $18,000.
Cap rate becomes:
$18,000 ÷ $300,000 = 6%
The gross yield is 10%.
The cap rate is 6%.
That four-percentage-point difference reflects the property income that is lost to vacancy and operating costs before reaching NOI.
Financing and Rental Property Returns
Financing can magnify both gains and losses.
Suppose a $300,000 property is purchased entirely with cash and generates $21,000 of annual NOI.
Unlevered operating yield:
$21,000 ÷ $300,000 = 7%
Now suppose an investor uses a large mortgage and invests only $80,000 of cash.
If annual cash flow after debt service is $8,000:
Cash-on-Cash Return = $8,000 ÷ $80,000
Cash-on-Cash Return = 10%
Leverage increased the cash return on invested equity in this example.
But if rental income falls or financing costs rise, debt service remains an obligation.
Leverage therefore magnifies sensitivity as well as return potential.
Down Payment and Cash-on-Cash Return
A down payment affects both the investor’s initial cash outlay and future debt service.
A larger down payment usually means:
more cash invested;
a smaller loan;
lower required debt service; and
less financial leverage.
A smaller down payment can increase leverage and preserve cash upfront, but the larger mortgage can reduce ongoing cash flow.
Therefore, the down payment that produces the highest percentage cash-on-cash return is not automatically the financing choice with the best risk-adjusted economics.
Closing Costs Affect the Real Investment
Investors sometimes calculate cash-on-cash return using only the down payment.
That can overstate the return.
Suppose:
Down payment = $60,000
Acquisition and mortgage closing costs = $8,000
Initial repairs = $12,000
Actual initial cash invested is:
$60,000 + $8,000 + $12,000 = $80,000
If annual cash flow equals $6,400:
Using only the down payment:
$6,400 ÷ $60,000 = 10.67%
Using full initial cash:
$6,400 ÷ $80,000 = 8%
The second calculation better reflects the investor’s total initial cash commitment.
Mortgage Interest and Rental Returns
Mortgage interest affects leveraged rental returns through debt service and potentially through tax treatment, depending on jurisdiction and circumstances.
An important distinction is that a mortgage payment includes both interest and principal on an amortizing loan.
Interest is a financing cost.
Principal repayment reduces the outstanding loan balance and increases the owner’s equity in the property.
For current cash flow, however, both components leave the investor’s bank account.
Therefore, the full debt-service payment matters when calculating cash available to the investor.
How Mortgage Payments Affect Cash Flow
Understanding how mortgage payments work helps prevent another common return mistake.
Suppose an annual mortgage payment totals $18,000.
Of that amount:
Interest = $13,000
Principal = $5,000
Current annual cash flow is reduced by the full $18,000.
Yet the $5,000 principal component also reduces debt and therefore increases property equity, assuming the property’s value does not fall by an offsetting amount.
This creates an important distinction:
Cash flow measures spendable cash.
Principal paydown contributes to equity growth.
The same dollar should not be counted twice in a return model.
Mortgage Escrow and Property Cash Flow
A mortgage escrow account can bundle property taxes or insurance into the monthly payment.
This can make a mortgage payment appear larger than principal and interest alone.
When calculating rental returns, avoid double counting.
If property taxes are already included as an operating expense and also appear inside an escrowed mortgage-payment figure, subtracting both would count the same tax expense twice.
Separate the economic components before calculating NOI and cash flow.
Mortgage Insurance
Where applicable, mortgage insurance is another financing-related cash cost that can reduce the investor’s cash-on-cash return.
It should not normally be hidden inside NOI if the objective is an unlevered property comparison because the cost exists due to the financing structure rather than the property’s operations.
For cash-flow analysis, however, it is still a real investor cash outflow and should not be ignored.
Levered vs Unlevered Rental Property Returns
An unlevered analysis assumes the property is evaluated without debt.
Cap rate is one common unlevered measure.
A levered analysis incorporates borrowing and evaluates returns to the investor’s equity.
Cash-on-cash return is one example.
Long-term levered analysis can also include mortgage principal reduction and sale proceeds after repaying the remaining loan.
The distinction matters because two investors can earn different equity returns from the same property simply because they finance it differently.
Principal Paydown and Equity Growth
An amortizing mortgage gradually reduces the loan principal.
Suppose a rental property is worth $300,000 and initially has a $225,000 mortgage.
Initial owner equity before transaction costs is:
$300,000 − $225,000 = $75,000
If the loan balance later falls to $215,000 while property value remains unchanged:
Equity = $300,000 − $215,000
Equity = $85,000
The investor has gained $10,000 of equity through principal reduction.
That equity is economically valuable, but it is not the same as $10,000 of current spendable rental cash.
Appreciation and Rental Property Returns
Property appreciation can become a major component of long-term total return.
Suppose a $300,000 property rises to $330,000.
Nominal appreciation is:
$330,000 − $300,000 = $30,000
or:
10% of the original property price
However, appreciation should not be treated as guaranteed.
A property can remain flat or decline in value.
Furthermore, an investor does not normally realize the full increase simply by observing a higher estimated market value.
Selling costs, taxes, loan payoff, and transaction timing affect the final realized result.
Cash Flow vs Appreciation
A property can have:
strong cash flow and weak appreciation;
weak cash flow and strong appreciation;
both;
or neither.
These are different return drivers.
Cash-flow-focused investors may prioritize immediate income.
Other investors may accept lower current cash yield if they expect durable income growth or long-term property appreciation.
The latter strategy depends more heavily on uncertain future outcomes.
A sound analysis should separate current observable cash economics from appreciation assumptions.
Total Rental Property Return
A simplified holding-period model can combine several sources of investor gain:
Total Gain = Net Cash Flow Received + Principal Reduction + Net Sale Gain
Then:
Total Return = Total Gain ÷ Total Cash Invested × 100
However, a serious multi-year calculation should account for the timing of each cash flow.
Receiving $20,000 next month is economically different from receiving the same $20,000 ten years from now.
That is why long-term property analysis often moves from simple total-return percentages toward discounted measures such as net present value and IRR.
Rental Property ROI
The site’s general ROI framework can be applied to property investment when the numerator and denominator are clearly defined.
For example:
Initial cash investment = $100,000
Total investment gain over holding period = $40,000
ROI = $40,000 ÷ $100,000 × 100
ROI = 40%
But this 40% figure means little without knowing the time period.
A 40% return over one year is dramatically different from 40% over ten years.
ROI also does not inherently account for when intermediate rental cash flows were received.
Rental Property IRR
IRR becomes useful for multi-year property investments because it incorporates the timing of multiple cash inflows and outflows.
A property investment can involve:
initial down payment and closing costs;
annual rental cash flows;
renovation expenditures;
additional capital contributions;
and net sale proceeds at the end.
IRR is the discount rate that makes the NPV of the modeled cash-flow sequence equal zero.
Unlike simple cap rate, it can incorporate the entire holding period.
However, IRR is only as reliable as the cash-flow assumptions used in the model.
Rental Property NPV
NPV can evaluate whether the property’s expected future cash flows create value above a required return.
Conceptually:
Property NPV = Present Value of Future Property Cash Flows − Initial Cash Investment
If the discounted future cash flows are worth $150,000 today and initial cash investment is $120,000:
NPV = $30,000
A positive NPV indicates value above the selected discount-rate requirement under the modeled assumptions.
This is a different question from cap rate.
Cap rate focuses primarily on current or stabilized NOI relative to property value.
NPV evaluates an entire discounted future cash-flow stream.
Rental Property Payback Period
The payback period measures how long cumulative cash flow takes to recover the initial cash invested.
Suppose:
Cash invested = $100,000
Annual cash flow = $10,000
A simple equal-cash-flow estimate gives:
Payback Period = $100,000 ÷ $10,000
Payback Period = 10 Years
However, simple payback ignores property value, principal reduction, cash flows after recovery, and the time value of money.
A property can therefore have a long payback period while still creating attractive long-term value, or a short payback while having limited value afterward.
Profitability Index for Rental Property
The workbook maps profitability index directly to this page.
Profitability index is:
PI = Present Value of Future Cash Inflows ÷ Initial Investment
It can help compare a property investment with other capital projects when capital is constrained.
Suppose:
PV of modeled future property inflows = $130,000
Initial investment = $100,000
PI = 1.30
This does not mean the property’s cap rate or cash-on-cash return is 30%.
PI is a discounted capital-budgeting ratio and should remain separate from the property-specific yield measures.
Rental Property Cash Flow Forecasting
A proper cash flow forecast should model more than one static year.
Future periods can incorporate:
lease expirations;
rent increases;
vacancy changes;
tax increases;
insurance increases;
maintenance;
capital replacements;
financing payments;
and eventual sale proceeds.
A property with positive Year 1 cash flow can become unattractive if expenses increase faster than rent.
Conversely, modest initial cash flow can improve if rents grow while certain expenses and debt payments remain stable.
Scenario modeling reveals these sensitivities.
Rent Growth Example
Suppose current rent is $3,000 per month and increases 3%.
New monthly rent:
$3,000 × 1.03 = $3,090
Annual increase:
($3,090 − $3,000) × 12
Annual Rent Increase = $1,080
If operating costs remain unchanged, most of that $1,080 can increase NOI.
However, rent growth should not be modeled without considering vacancy, tenant turnover, competitive supply, and local market conditions.
A forecast is an assumption, not an entitlement.
Expense Growth Example
Suppose current operating expenses are $12,000 and rise 6%.
New Operating Expenses = $12,000 × 1.06
New Operating Expenses = $12,720
Expense increase:
$720
If rent increases by only $500 during the same period:
NOI Change = $500 − $720
NOI Change = −$220
Revenue increased, but NOI declined.
Rental property returns depend on the spread between income growth and expense growth, not rent growth alone.
Break-Even Occupancy
A useful property-risk question is how much occupancy is required to cover the property’s relevant expenses.
A simplified concept is:
Break-Even Occupancy = Required Property Revenue ÷ Potential Gross Revenue × 100
The precise numerator depends on whether the analysis is examining operating break-even, cash break-even after debt service, or another threshold.
A highly leveraged property may require much greater occupancy to remain cash-flow positive than an identical property owned without debt.
The financing structure therefore changes cash-flow risk even though it does not change the building’s physical occupancy.
Rental Property Returns and Return on Assets
The workbook maps return on assets directly to this page.
ROA measures accounting earnings relative to an asset base.
Cap rate measures property NOI relative to property value.
They can look superficially similar because both place an earnings figure over an asset-related denominator, but they are not interchangeable.
ROA uses its defined company accounting numerator.
Cap rate uses property NOI.
Property investors should not label cap rate as ROA simply because both are percentages involving assets.
Rental Property Returns and Return on Equity
Return on equity provides useful conceptual context for leveraged property investments.
Debt reduces the amount of investor equity required.
If investment performance remains strong enough to exceed financing costs, leverage can increase the return earned on equity.
If property income or value falls, the same leverage can magnify equity losses.
Cash-on-cash return is one property-specific equity cash-yield measure, while ROE belongs to broader financial-statement analysis.
Rental Property Returns and Return on Capital Employed
The workbook maps return on capital employed as another neighboring Business Finance measure.
ROCE evaluates operating returns relative to capital employed at the business level.
Rental-property cap rate evaluates NOI relative to a property’s value.
An investor managing a large property company might analyze both, but a single-building cap-rate calculation should not be relabeled as ROCE.
The numerator and capital definitions differ.
Rental Property Returns and ROIC
Return on invested capital also addresses capital efficiency from a broader corporate perspective.
A property investor may colloquially say “return on invested capital” when referring to cash-on-cash return, but formal ROIC has its own numerator and invested-capital framework.
Clear labels prevent these ratios from being confused.
For property analysis, state whether the percentage is:
cap rate;
cash-on-cash return;
simple ROI;
IRR;
or another defined return measure.
Rental Property Returns and Operating Cash Flow
Operating cash flow applies at a broader financial-statement level.
Property cash flow is narrower.
A real estate company may own fifty rental buildings.
One building can generate $20,000 of positive annual property cash flow while the company as a whole reports very different operating cash flow because of corporate overhead, other properties, working-capital movements, and other operations.
Property-level and entity-level cash flow should therefore remain separate.
Rental Property Returns and Free Cash Flow
Free cash flow can also differ from rental property cash flow.
A property may produce positive annual income before the owner invests heavily in major capital improvements.
For example:
Property cash flow before major capital expenditure = $20,000
Roof replacement = $30,000
Cash after that investment:
$20,000 − $30,000 = −$10,000
One unusual year does not necessarily make the property economically unattractive, but it demonstrates why long-term capital needs matter.
Working Capital in a Rental Business
A property owner may also require working capital for short-term operating needs.
Security-deposit handling, unpaid tenant balances, prepaid expenses, current liabilities, contractor bills, and operating reserves can create balance-sheet considerations beyond the property’s cap rate.
For a single-property investment, these amounts may be modest.
For a large property-management or rental company, working-capital discipline can become operationally significant.
Quick Ratio and Rental Businesses
The workbook maps quick ratio directly to this article.
Quick ratio does not measure rental property investment return.
It measures short-term liquidity.
A property company could own valuable buildings and report attractive cap rates while still facing poor short-term liquidity because real estate cannot be converted to cash instantly to pay current obligations.
Likewise, a company can have abundant cash and a strong quick ratio while owning poorly performing rental properties.
Asset return and short-term liquidity are different dimensions.
Property Value and Business Valuation
Rental property valuation can overlap conceptually with business valuation, particularly when a property forms part of a broader operating business.
However, a building’s income-based value and the value of an entire company are not identical.
A real estate company can have:
multiple properties;
corporate debt;
cash;
management operations;
development projects;
contracts;
tax liabilities;
and other assets or obligations.
Cap rate provides a property-level valuation relationship rather than a complete corporate valuation method.
Rental Property Return With No Mortgage
Suppose:
Purchase price = $250,000
NOI = $20,000
No debt
Cap rate:
$20,000 ÷ $250,000 = 8%
If the investor also paid $10,000 of closing and setup costs, total initial cash committed is $260,000.
A simple first-year cash yield on total initial cash becomes:
$20,000 ÷ $260,000 ≈ 7.69%
This demonstrates that even an all-cash investor needs to define the denominator carefully.
Cap rate based on property purchase price and actual cash yield based on total cash committed are related but not necessarily identical.
Rental Property Return With Debt
Now suppose the same $250,000 property is financed.
Down payment = $62,500
Closing/setup costs = $10,000
Total initial cash = $72,500
If NOI remains $20,000 and annual debt service is $14,000:
Annual Cash Flow = $20,000 − $14,000
Annual Cash Flow = $6,000
Cash-on-cash return:
$6,000 ÷ $72,500 × 100
Cash-on-Cash Return ≈ 8.28%
Financing increases the equity cash yield slightly in this example.
But the investor also accepts additional debt risk.
When Leverage Hurts Rental Returns
Suppose the same property has $20,000 of NOI but financing costs require $21,000 of annual debt service.
Cash Flow = $20,000 − $21,000
Cash Flow = −$1,000
The property still has positive NOI and the same unlevered cap rate.
Yet the financing structure produces negative cash flow for the investor.
This is one of the clearest examples of why cap rate should never be used as though it were the investor’s actual financed return.
Rental Property Return and Refinancing
A later cash-out refinance can change the investor’s equity and cash-flow profile dramatically.
Extracting equity can return cash to the investor, but a larger loan can increase future debt service.
A property that previously generated strong monthly cash flow can become much thinner after refinancing.
Return calculations before and after refinancing should therefore identify:
cash extracted;
new loan amount;
new payment;
transaction costs;
and the effect on future cash flow.
Return on Original Cash vs Current Equity
Long-term owners often compare current cash flow with their original investment.
Suppose:
Original cash invested = $75,000
Current annual cash flow = $12,000
Return on original cash:
$12,000 ÷ $75,000 = 16%
Now suppose property appreciation and principal paydown have increased current equity to $250,000.
Current cash yield on equity:
$12,000 ÷ $250,000 = 4.8%
Both percentages are mathematically meaningful.
The first shows performance relative to historical cash invested.
The second asks what current cash yield the investor is earning on the equity now tied up in the property.
That distinction can influence hold-versus-sell analysis.
Selling Costs and Realized Returns
Estimated property appreciation should not be confused with net sale proceeds.
Suppose:
Sale price = $400,000
Selling and transaction costs = $28,000
Remaining mortgage = $220,000
Net cash before taxes and other adjustments:
$400,000 − $28,000 − $220,000
Net Sale Cash = $152,000
The investor does not receive the entire $400,000 sale price.
A complete realized return should therefore use expected net proceeds rather than gross property value.
Taxes and Rental Property Returns
Taxable rental income and investment cash flow are not the same calculation.
For U.S. federal tax purposes, rental-property rules can involve rental income, deductible expenses, depreciation, passive-activity limitations, basis, improvements, and other provisions.
A depreciation deduction, for example, can reduce taxable rental income without representing a matching current-period cash payment.
Conversely, principal repayment reduces cash but is not simply an operating rental expense in the same way as routine property maintenance.
Therefore:
NOI
cash flow
taxable income
and:
after-tax investment return
should be treated as separate calculations.
Tax treatment depends on the investor’s circumstances and current law.
Depreciation vs Cash Flow
Suppose a rental generates:
Pre-tax cash flow = $8,000
and the applicable tax calculation includes depreciation.
Depreciation can reduce taxable income even though it does not directly remove additional cash from the investor during that year.
This is one reason taxable rental profit can differ from actual cash received.
However, depreciation also interacts with basis and future disposition rules.
It should not be treated as free money or added automatically to a property’s economic return without considering the complete tax framework.
Rental Property Returns Under Different Scenarios
A good investment model should test more than one forecast.
Base Case
Rent = $3,000/month
Vacancy = 5%
NOI = $22,216
Cash flow ≈ $6,028
Downside Case
Rent falls or remains flat.
Vacancy rises.
Insurance and maintenance increase.
NOI might fall to $17,000.
If debt service remains about $16,188:
Cash Flow ≈ $812
The property remains slightly cash-flow positive but has almost no cushion.
Severe Downside
If NOI falls to $14,000:
Cash Flow ≈ $14,000 − $16,188
Cash Flow ≈ −$2,188
The investor must contribute cash.
Scenario analysis makes financing risk visible before the investment is made.
Stress Testing Vacancy
Suppose potential rental income is $36,000.
At 5% vacancy:
Collected Rent Before Other Income ≈ $34,200
At 10%:
$32,400
At 20%:
$28,800
Moving from 5% to 20% vacancy reduces expected rent by:
$34,200 − $28,800 = $5,400
For a property producing only $6,000 of normal annual cash flow, that change can eliminate almost the entire return before any additional expenses are considered.
Stress Testing Repairs
Suppose modeled annual repairs are $1,800.
A major year produces $7,000 of repair costs instead.
Unexpected increase:
$7,000 − $1,800 = $5,200
If normal annual cash flow is approximately $6,000, most of the year’s cash return disappears.
This is why a rental property should be evaluated for both expected return and financial resilience.
Stress Testing Interest Rates
Interest rates matter when acquiring or refinancing property.
If the property NOI remains unchanged but a higher interest rate raises annual debt service significantly, cash-on-cash return can decline.
The property’s cap rate remains based on NOI and property value.
The investor’s financing return changes.
This distinction becomes especially important when comparing properties acquired in different interest-rate environments.
Rental Property Returns and Reserves
A property can produce positive modeled cash flow and still be financially fragile if the investor has no reserves.
Unexpected vacancy, insurance deductibles, legal costs, major repairs, or temporary loss of income can require immediate cash.
The return model should therefore be considered alongside the investor’s ability to absorb adverse periods.
A 10% projected return with no financial cushion can be riskier than a lower modeled return backed by conservative financing and adequate reserves.
Common Rental Property Return Mistakes
One common mistake is treating gross rent as profit.
Another is calculating cap rate after mortgage payments even though cap rate is intended to evaluate property NOI before financing.
Investors may also calculate cash-on-cash return using only the down payment while ignoring closing costs and immediate improvements.
Vacancy can be omitted.
Management costs may be ignored because the current owner self-manages.
Capital expenditures can be treated as though roofs, HVAC systems, and other major components never need replacement.
Appreciation may be assumed rather than modeled as an uncertain scenario.
Mortgage principal reduction can be counted as both cash flow and equity gain.
Another frequent error is comparing a cap rate on original purchase price with another property’s cap rate on current market value.
Consistent definitions are essential.
Limitations of Cap Rate
Cap rate is useful because it provides a compact relationship between property NOI and value, but it has important limitations.
It generally reflects one stabilized operating-income level.
It does not automatically model rent growth.
It does not incorporate financing.
It does not show the timing of future capital expenditures.
It does not measure tax consequences.
It can change significantly based on how NOI is normalized.
It also does not directly account for the entire holding period or selling proceeds.
For properties with changing occupancy or significant future cash-flow changes, discounted cash-flow analysis can provide a more complete picture.
Limitations of Cash-on-Cash Return
Cash-on-cash return focuses on annual cash yield on invested equity.
That makes it intuitive, but incomplete.
It does not automatically include appreciation.
It does not fully capture mortgage principal reduction.
It normally focuses on one period.
It can be increased mechanically through greater leverage even while investment risk rises.
It does not account for cash-flow timing across a multi-year holding period.
It also depends heavily on what the analyst includes in “cash invested.”
Use it as one return metric, not the entire investment thesis.
How to Analyze Rental Property Returns Properly
Start with realistic rent rather than the highest advertised rent you can find.
Estimate vacancy and credit loss.
Add recurring property income.
Then subtract realistic operating expenses to determine NOI.
Calculate:
NOI = Effective Gross Income − Operating Expenses
Next calculate cap rate:
Cap Rate = NOI ÷ Property Value × 100
If financing will be used, calculate the complete debt-service requirement and other financing cash costs.
Then calculate:
Cash Flow = NOI − Debt Service − Other Relevant Cash Costs
Determine the full initial cash investment, including the down payment, acquisition costs, and immediate capital required to place the property in service.
Then:
Cash-on-Cash Return = Annual Cash Flow ÷ Initial Cash Invested × 100
For a multi-year investment, forecast rent, vacancy, operating expenses, capital expenditures, loan balances, and net sale proceeds.
Finally, evaluate NPV, IRR, downside cases, financing risk, and reserves.
This sequence produces a much stronger rental property return analysis than starting and ending with a rent-to-price percentage.
Why Rental Property Returns Matter
Rental property can create economic value through several channels:
ongoing cash flow;
mortgage principal reduction;
rent growth;
and property appreciation.
Those sources should not be mixed into one vague percentage.
The property’s operating economics begin with:
NOI = Effective Gross Income − Operating Expenses
Cap rate then measures:
Cap Rate = NOI ÷ Property Value × 100
For a financed investment:
Cash-on-Cash Return = Annual Pre-Tax Cash Flow ÷ Cash Invested × 100
Long-term analysis can then incorporate appreciation, principal reduction, sale proceeds, and the timing of cash flows.
The most useful rental property returns are therefore not the highest-looking percentages. They are the returns calculated from consistent definitions, realistic expenses, defensible assumptions, and cash flows the investor could plausibly experience.
Frequently Asked Questions
How do you calculate rental property returns?
Several calculations can be used. Cap rate is NOI divided by property value. Cash-on-cash return is annual pre-tax cash flow divided by the investor’s total cash invested. A complete long-term return can also incorporate principal reduction, appreciation, and net sale proceeds.
What is the cap rate formula for a rental property?
Cap Rate = Net Operating Income ÷ Property Value × 100
If NOI is $24,000 and property value is $400,000, the cap rate is 6%.
What is NOI on a rental property?
Net operating income is the property’s effective gross income minus operating expenses. It generally evaluates property operations before financing costs and investor-specific income taxes.
Does mortgage payment count in cap rate?
Mortgage debt service is generally kept outside the cap-rate NOI calculation because cap rate is intended to evaluate the property’s income relative to value independently of the investor’s financing structure.
What is cash-on-cash return?
Cash-on-cash return measures annual pre-tax cash flow relative to the amount of cash the investor actually committed.
Cash-on-Cash Return = Annual Pre-Tax Cash Flow ÷ Cash Invested × 100
What is the difference between cap rate and cash-on-cash return?
Cap rate measures NOI relative to property value before financing. Cash-on-cash return measures cash flow after financing relative to the investor’s cash invested.
Is rental income the same as rental profit?
No. Rental income is the money generated by the property. Profit or cash flow requires subtracting relevant vacancy, operating expenses, financing costs, and other applicable items.
Should vacancy be included when calculating rental returns?
Yes. A realistic return model should consider expected vacancy and noncollection because potential rent is not always equal to rent actually received.
Do repairs reduce rental property returns?
Yes. Routine repairs and maintenance reduce property income or cash flow. Major capital improvements also require cash, although they may be treated differently from ordinary operating expenses in NOI, accounting, and tax calculations.
Does mortgage principal paydown count as return?
Principal reduction increases the owner’s equity by reducing debt, so it can contribute to broader investment return. However, it is not current spendable cash flow and should not be counted twice.
Is appreciation included in cap rate?
No. Cap rate uses NOI and property value. Future property appreciation is a separate potential component of total return.
What is a good rental property return?
There is no universal good percentage. Appropriate rental property returns depend on property risk, financing, location, operating stability, required capital, expected growth, liquidity, investment alternatives, and the investor’s objectives.




