


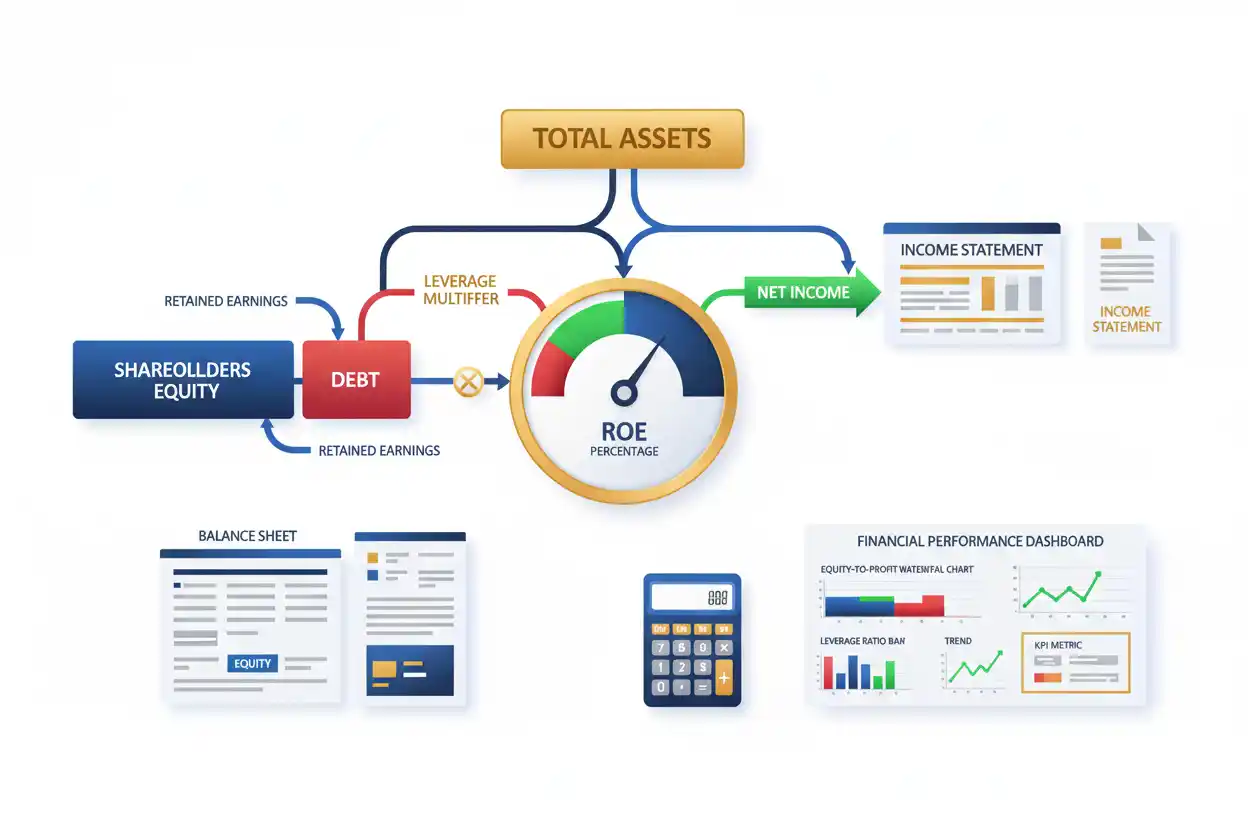
Return on equity measures how much profit a company generates relative to shareholders’ equity. Commonly abbreviated ROE, it helps show how effectively a business uses the capital attributable to its owners to produce earnings.
A common formula is:
Return on Equity = Net Income ÷ Average Shareholders’ Equity × 100
Suppose a company generates $800,000 of annual net income and has average shareholders’ equity of $4 million.
ROE = $800,000 ÷ $4,000,000 × 100
ROE = 20%
A 20% return on equity means the company’s net income equals 20% of its average equity base for the period under that definition.
ROE is a useful profitability and capital-efficiency measure, but a high percentage does not automatically mean a business is superior. Debt, share repurchases, losses accumulated in prior years, acquisitions, accounting adjustments, and a very small equity denominator can all materially affect the result.
Within business finance, return on equity is therefore most useful when evaluated alongside return on assets, leverage, margins, asset turnover, cash flow, and returns on broader invested capital.
What Is Return on Equity?
Return on equity measures earnings relative to shareholders’ equity.
Conceptually:
ROE = Profit Available to Equity ÷ Equity Capital
A common company-level calculation uses:
ROE = Net Income ÷ Average Shareholders’ Equity × 100
For calculations focused specifically on common shareholders, analysts may instead use net income available to common shareholders and average common equity.
The exact numerator and denominator should match.
For example, if preferred dividends are deducted from earnings to arrive at income available to common shareholders, the denominator should generally represent the corresponding common-equity base rather than total equity that includes unrelated preferred capital.
ROE ultimately asks:
How much accounting earnings did the company generate relative to the equity capital supporting the business?
Return on Equity Formula
The standard educational formula is:
Return on Equity = Net Income ÷ Average Shareholders’ Equity × 100
Average shareholders’ equity is:
Average Shareholders’ Equity = (Beginning Equity + Ending Equity) ÷ 2
Combining the formulas:
ROE = Net Income ÷ [(Beginning Equity + Ending Equity) ÷ 2] × 100
Using average equity provides a better period match because net income accumulates throughout the year while a year-end equity balance represents only one date.
How to Calculate Return on Equity
Suppose a company reports:
Beginning shareholders’ equity = $3,600,000
Ending shareholders’ equity = $4,400,000
Annual net income = $800,000
First calculate average equity:
Average Equity = ($3,600,000 + $4,400,000) ÷ 2
Average Equity = $4,000,000
Then calculate ROE:
ROE = $800,000 ÷ $4,000,000 × 100
ROE = 20%
The company generates net income equal to 20% of its average shareholders’ equity.
Why Use Average Shareholders’ Equity?
Net income is earned over an accounting period.
Ending equity is measured at one specific date.
Suppose:
Beginning equity = $2 million
Ending equity = $6 million
Net income = $600,000
Using ending equity:
ROE = $600,000 ÷ $6,000,000
ROE = 10%
Using average equity:
Average Equity = ($2M + $6M) ÷ 2
Average Equity = $4M
Therefore:
ROE = $600,000 ÷ $4,000,000
ROE = 15%
That five-percentage-point difference is substantial.
If equity changed materially because of new share issuance, repurchases, dividends, acquisitions, or other transactions, an average denominator becomes particularly important.
More Frequent Average Equity
Beginning and ending balances are still only two observations.
If equity changes substantially during the year, analysts may use quarterly or monthly averages.
For example:
Average Equity = Sum of Quarterly Equity Balances ÷ Number of Observations
A financial company might calculate trailing ROE using several quarterly equity balances rather than only the first and last day of the year.
Whatever method is used, consistency matters when comparing companies or periods.
Return on Equity Example
Suppose a company reports:
Revenue = $12 million
Net income = $1.2 million
Beginning equity = $5 million
Ending equity = $7 million
Average equity:
($5M + $7M) ÷ 2 = $6M
ROE:
$1.2M ÷ $6M × 100
ROE = 20%
The business generates $0.20 of annual net income for every $1.00 of average equity.
Its absolute net profit is $1.2 million.
ROE places that profit in the context of the shareholder capital supporting the company.
What Does a 20% ROE Mean?
A 20% ROE means annual net income equals 20% of average shareholders’ equity under the selected formula.
If average equity equals $10 million:
Net Income at 20% ROE = $2 million
If average equity equals $100 million:
Net Income = $20 million
The percentage standardizes profitability relative to equity, making comparisons easier than simply looking at net income dollars.
However, two companies reporting 20% ROE can have dramatically different debt levels, asset requirements, cash generation, and business risk.
What Does a 10% ROE Mean?
Suppose:
Net income = $500,000
Average shareholders’ equity = $5 million
Then:
ROE = $500,000 ÷ $5,000,000 × 100
ROE = 10%
The company produces ten cents of accounting net income for every dollar of average equity.
Whether 10% represents attractive performance depends on the industry, risk, leverage, growth prospects, accounting structure, and available alternatives.
What Is a Good Return on Equity?
There is no universal good return on equity.
A useful ROE comparison generally considers:
the company’s historical performance;
direct competitors;
financial leverage;
business risk;
capital requirements;
profitability;
growth;
and the sustainability of earnings.
Different industries can support very different equity structures.
Banks, manufacturers, utilities, technology companies, retailers, and service businesses should not be ranked solely by one universal ROE threshold.
Is a Higher ROE Better?
All else equal, a higher ROE means the business generates more earnings per dollar of equity.
Suppose two companies each have $5 million of average equity.
Company A earns $500,000:
ROE = 10%
Company B earns $1 million:
ROE = 20%
Company B generates twice the profit from the same amount of equity.
However, all else may not be equal.
Company B could be using substantially more debt.
Its equity denominator might have been reduced through share repurchases.
Its earnings could include unusual gains.
Its industry might also be much riskier.
Therefore, higher ROE deserves explanation rather than automatic praise.
Can Return on Equity Be Negative?
Yes.
If net income is negative while shareholders’ equity remains positive, ROE becomes negative.
Suppose:
Net loss = −$400,000
Average shareholders’ equity = $5 million
Then:
ROE = −$400,000 ÷ $5,000,000 × 100
ROE = −8%
The company generated a loss equal to 8% of its average equity base.
Negative ROE can result from weak operations, recession, restructuring, startup losses, impairments, litigation, or other factors.
The ratio identifies the result, not the cause.
Why Negative Equity Makes ROE Difficult
ROE becomes much harder to interpret when shareholders’ equity itself is negative.
Suppose:
Net loss = −$1 million
Average equity = −$5 million
Mathematically:
ROE = −$1M ÷ −$5M
ROE = +20%
A positive 20% result obviously does not indicate healthy profitability.
Both the numerator and denominator are negative.
Likewise, positive net income divided by negative equity produces negative ROE even though the company earned a profit.
When average equity is negative, conventional ROE loses much of its intuitive meaning.
ROE Near Zero Equity
A very small positive equity denominator can also create extreme ROE.
Suppose:
Net income = $200,000
Average equity = $100,000
Then:
ROE = 200%
The business did not necessarily produce extraordinary operating economics.
The denominator is simply very small.
When equity approaches zero, modest changes in earnings or equity can make ROE extremely volatile.
In these cases, return on assets and broader capital-return measures often provide better context.
Return on Equity vs Return on Assets
The workbook maps Return on Assets directly to this page.
ROA commonly uses:
ROA = Net Income ÷ Average Total Assets × 100
ROE uses:
ROE = Net Income ÷ Average Shareholders’ Equity × 100
Suppose:
Net income = $800,000
Average total assets = $10 million
Average equity = $4 million
ROA:
$800,000 ÷ $10 million = 8%
ROE:
$800,000 ÷ $4 million = 20%
The company generates 8% net income relative to assets but 20% relative to shareholder equity.
The difference exists because part of the asset base is financed through liabilities rather than equity.
ROE and the Equity Multiplier
The equity multiplier helps quantify the relationship between assets and equity.
A common formula is:
Equity Multiplier = Average Total Assets ÷ Average Shareholders’ Equity
Using the previous example:
Average assets = $10 million
Average equity = $4 million
Equity Multiplier = $10M ÷ $4M
Equity Multiplier = 2.5
The relationship between ROA and ROE can then be expressed as:
ROE = ROA × Equity Multiplier
Therefore:
ROE = 8% × 2.5
ROE = 20%
This shows directly how leverage can magnify shareholder returns relative to returns generated by the asset base.
Return on Equity and Financial Leverage
Financial leverage is one of the most important ROE drivers.
Consider two companies with identical assets and operating economics.
Company A finances most assets with shareholder equity.
Company B uses substantially more debt.
If the return generated by the borrowed capital exceeds its financing cost, leverage can increase earnings available relative to the smaller equity base.
ROE can therefore rise.
But leverage also magnifies downside risk.
If operating earnings fall while interest and debt obligations remain, the effect on shareholders can become much more severe.
High ROE created primarily by aggressive leverage should therefore be distinguished from high ROE created by strong operating economics.
ROE and Debt-to-Equity Ratio
The debt-to-equity ratio provides financing context.
Suppose:
Company A ROE = 18%
Debt-to-equity = 0.3
Company B ROE = 22%
Debt-to-equity = 3.0
The four-percentage-point ROE difference should not be evaluated without considering the much greater leverage in Company B.
The second company may be generating more return for shareholders, but it may also expose them to substantially more financial risk.
ROE and Interest Coverage
Interest coverage helps evaluate whether the debt supporting leverage is manageable from an earnings perspective.
Suppose additional debt increases ROE but pushes interest coverage down from 8 times to 1.5 times.
The equity-return percentage improved.
Debt-service capacity weakened dramatically.
That tradeoff can make the higher ROE less attractive than it initially appears.
Return and risk should be analyzed together.
Return on Equity vs Return on Capital Employed
The workbook maps return on capital employed directly to this page.
A common ROCE formula is:
ROCE = EBIT ÷ Average Capital Employed × 100
ROE uses:
ROE = Net Income ÷ Average Shareholders’ Equity × 100
ROCE therefore evaluates operating earnings across a broader capital base.
ROE focuses specifically on earnings relative to shareholder equity.
A company can have strong ROCE and even stronger ROE when leverage is favorable.
It can also have reasonable ROCE but weak ROE if financing costs consume substantial earnings.
Return on Equity vs Return on Invested Capital
The workbook also maps return on invested capital directly.
ROIC commonly evaluates after-tax operating returns on capital invested in the operating business.
ROE focuses on earnings attributable to shareholders relative to shareholders’ equity.
That distinction matters because ROE is directly affected by financing choices.
ROIC is generally structured to focus more on the economics of the operating business independent of how much is financed by equity versus certain forms of debt.
Therefore:
ROE ≠ ROIC
A highly leveraged company can report very high ROE without having exceptionally strong ROIC.
Return on Equity vs ROI
The workbook maps ROI as another neighboring intent.
ROI is a broad measure of return on a specific investment.
A simplified formula may be:
ROI = Gain ÷ Investment Cost × 100
ROE is a company-level accounting ratio:
ROE = Net Income ÷ Average Shareholders’ Equity × 100
If an investor buys shares for $10,000 and later earns a $2,000 gain, a simplified ROI might be 20%.
That does not mean the underlying company’s ROE is 20%.
Market investment return and company accounting return are different concepts.
Return on Equity vs Rental Property Returns
The workbook maps rental property returns directly to this page.
A property investor might calculate cash-on-cash return by dividing annual property cash flow by actual cash invested.
That percentage resembles an equity return conceptually but is not corporate ROE.
ROE uses company accounting earnings and shareholders’ equity.
Rental cash-on-cash return uses property cash flow and investor cash invested.
The numerator, denominator, timing, and accounting framework differ.
The DuPont Formula for ROE
One of the most useful ways to understand return on equity is through the three-part DuPont relationship:
ROE = Net Profit Margin × Asset Turnover × Equity Multiplier
Where:
Net Profit Margin = Net Income ÷ Revenue
Asset Turnover = Revenue ÷ Average Total Assets
Equity Multiplier = Average Total Assets ÷ Average Shareholders’ Equity
Multiplying the three:
(Net Income ÷ Revenue) × (Revenue ÷ Assets) × (Assets ÷ Equity)
Revenue and assets cancel:
ROE = Net Income ÷ Equity
The decomposition shows three major drivers of ROE:
profitability,
asset efficiency,
and:
financial leverage.
DuPont ROE Example
Suppose:
Revenue = $10 million
Net income = $800,000
Average assets = $5 million
Average equity = $2 million
$800,000 ÷ $10,000,000 = 8%
Asset turnover is:
$10,000,000 ÷ $5,000,000 = 2.0
Equity multiplier:
$5,000,000 ÷ $2,000,000 = 2.5
Therefore:
ROE = 8% × 2.0 × 2.5
ROE = 40%
Direct calculation confirms it:
ROE = $800,000 ÷ $2,000,000
ROE = 40%
The DuPont formula explains where that high ROE comes from instead of presenting 40% as an isolated number.
Improving ROE Through Profit Margin
Suppose asset turnover and leverage remain unchanged.
If net profit margin increases from 5% to 8%, ROE rises.
For example:
Profit margin = 5%
Asset turnover = 1.5
Equity multiplier = 2
ROE = 5% × 1.5 × 2
ROE = 15%
If margin rises to 8%:
ROE = 8% × 1.5 × 2
ROE = 24%
The company improved shareholder returns through stronger profitability rather than greater leverage.
Possible drivers include better pricing, lower costs, stronger product mix, or improved operating efficiency.
Improving ROE Through Asset Turnover
A company can also improve ROE by generating more sales from the same asset base.
Suppose:
Net margin = 10%
Asset turnover = 1.0
Equity multiplier = 2
ROE = 20%
If asset turnover improves to 1.5 while the other factors remain unchanged:
ROE = 10% × 1.5 × 2
ROE = 30%
The company generated greater revenue from each asset dollar.
Asset-efficiency improvements can come from better utilization, faster inventory movement, stronger receivable management, or reducing unproductive assets.
Improving ROE Through Leverage
Now suppose:
Net margin = 10%
Asset turnover = 1.0
At equity multiplier 2:
ROE = 20%
At equity multiplier 3:
ROE = 30%
ROE improved even though profit margin and asset productivity did not change.
The improvement came entirely from financing structure.
That makes the higher ROE fundamentally different from an increase created by better operations.
ROE and Receivables Turnover
Receivables turnover can influence ROE indirectly through asset efficiency.
Suppose a company can generate the same revenue and profit while reducing average receivables by $2 million.
Total assets decline.
Asset turnover can increase.
If equity and financing are adjusted accordingly, ROE can also improve.
Faster customer collection can therefore strengthen both cash flow and the efficiency of capital employed.
ROE and Inventory Turnover
Inventory turnover has a similar relationship.
A retailer that requires $5 million of inventory to support a particular sales volume ties up more assets than one requiring $2 million.
If both earn the same net income, the more efficient inventory model can support higher asset turnover and potentially stronger ROE.
Again, the goal is not simply minimizing inventory.
The company still needs enough stock to serve customers and protect revenue.
ROE and Working Capital
Working capital can materially affect the capital required to run a business.
Large receivables and inventory balances can increase the amount of funding required.
Improving working-capital efficiency can release cash and potentially reduce the equity or debt needed to support operations.
However, overly aggressive working-capital reduction can create stock shortages, supplier problems, or customer dissatisfaction.
Efficient capital use is not the same as cutting every current asset to the minimum.
ROE and Operating Margin
Operating margin affects the profitability that eventually flows toward net income.
Suppose operating margin improves because revenue grows faster than operating expenses.
If financing costs and taxes remain broadly stable, stronger operating economics can increase net income and therefore ROE.
However, a business can have an excellent operating margin and weak ROE if it requires a huge equity base to support operations.
Margins and capital efficiency answer different questions.
ROE and Operating Profit
Operating profit sits above interest and taxes in the earnings structure.
Strong operating profit can support strong ROE, but financing matters.
Suppose two companies generate identical operating profit.
Company A has minimal debt.
Company B pays substantial interest.
Company B can end with much lower net income and therefore lower ROE despite identical operating results.
ROE therefore incorporates the effects that occur between operating earnings and the earnings ultimately available to shareholders.
ROE and Profit
The broader profit concept forms the numerator side of return analysis.
Higher net profit increases ROE if equity remains unchanged.
Suppose:
Average equity = $10 million
At $1 million net income:
ROE = 10%
At $1.5 million:
ROE = 15%
The company improved ROE by increasing earnings 50% without changing equity.
This type of improvement is usually more informative than a mechanically higher ratio created only by shrinking the denominator.
ROE and Share Repurchases
Share repurchases can affect ROE because they reduce shareholders’ equity.
Suppose:
Net income = $1 million
Average equity = $10 million
ROE = 10%
Now assume a substantial share repurchase reduces average equity to $8 million while net income remains $1 million.
ROE = $1M ÷ $8M
ROE = 12.5%
The company’s earnings did not increase.
The denominator declined.
This does not mean the repurchase was necessarily good or bad. It means the higher ROE should not automatically be interpreted as improved operating performance.
ROE and Dividends
Dividends reduce retained earnings and therefore can reduce shareholders’ equity over time.
If net income remains stable while the equity base declines, ROE can increase.
Suppose a mature business distributes a large share of earnings rather than reinvesting them.
Its ROE may remain high because relatively little accumulated equity stays inside the business.
Another company retaining most earnings may report lower ROE temporarily while investing for growth.
Dividend policy therefore affects the denominator as well as shareholder cash distributions.
Retained Earnings and ROE
Retained earnings accumulate profits that remain inside the company rather than being distributed.
Suppose a company earns $1 million every year but retains all earnings.
Equity can grow over time.
If the company cannot reinvest those retained profits at attractive returns, ROE may gradually fall because the denominator grows faster than earnings.
Sustaining high ROE while reinvesting substantial capital can therefore be more economically demanding than sustaining high ROE while distributing most profits.
New Equity Issuance and ROE
Issuing new shares increases shareholders’ equity.
If the new capital has not yet begun producing proportionate earnings, ROE can decline.
Suppose:
Net income = $2 million
Average equity before issuance = $10 million
ROE = 20%
After a large equity raise, average equity increases to $15 million while earnings remain $2 million:
ROE ≈ 13.33%
That decline does not automatically mean the business deteriorated.
The new capital may be waiting to fund acquisitions or expansion that could generate future earnings.
ROE and Business Growth
Rapid growth can increase or decrease return on equity.
If a company can reinvest earnings at high incremental returns, net income may grow at least as fast as equity.
ROE can remain strong.
If growth requires large amounts of new equity for relatively modest additional earnings, ROE can fall.
Therefore, the quality of growth depends partly on how much new capital is required to produce additional profit.
Revenue growth alone does not answer that question.
Sustainable Growth and ROE
ROE is sometimes linked conceptually with a company’s ability to grow through retained earnings.
If a company earns a high ROE and retains a meaningful share of earnings, it may be able to expand equity and earnings without relying entirely on external capital.
However, actual growth depends on many factors, including market demand, reinvestment opportunities, leverage, margins, competitive conditions, and capital requirements.
A historical ROE should not simply be projected indefinitely.
ROE and Business Valuation
Business valuation often considers whether a company can maintain attractive returns on shareholder capital.
A company that repeatedly reinvests earnings at strong returns can create very different long-term economics from one whose ROE collapses whenever equity grows.
However, high ROE alone does not determine value.
Growth expectations, cash flow, business risk, competitive durability, leverage, and the price paid for the investment all matter.
An excellent company can still be an unattractive investment at an excessively high valuation.
ROE and Cash Flow
ROE uses accounting earnings.
Accounting earnings are not necessarily identical to cash generation.
Suppose a company reports:
Net income = $1 million
Average equity = $5 million
ROE = 20%
If accounts receivable and inventory rise dramatically, operating cash flow could be much weaker than net income.
A high ROE supported by poor cash conversion deserves additional scrutiny.
ROE and Free Cash Flow
Free cash flow adds another important perspective.
A capital-intensive company can report attractive ROE while requiring substantial annual spending on factories, equipment, or infrastructure.
If most operating cash must continually be reinvested, the cash available for debt reduction, acquisitions, dividends, or other uses can be much smaller than accounting net income suggests.
ROE therefore should not substitute for cash-flow analysis.
ROE and Book Value
Shareholders’ equity is an accounting book-value measure.
It is not the same as the company’s stock-market value.
Suppose a company has:
Market capitalization = $10 billion
Book equity = $2 billion
Net income = $400 million
ROE is based on the $2 billion accounting equity base:
ROE = 20%
It is not:
$400M ÷ $10B = 4%
The second percentage relates earnings to market value and represents a different valuation concept.
ROE should not use market capitalization in the denominator unless the metric is intentionally being redefined and labeled differently.
ROE and Intangible Assets
The accounting treatment of intangible assets can affect shareholders’ equity and therefore ROE.
A company that develops valuable brands, software, data, or intellectual property internally may not record all of that economic value as assets in the same way as another company that acquired comparable assets.
The two businesses can therefore have very different book equity even if their economic resources are similar.
This complicates cross-company ROE comparisons, particularly across very different business models.
ROE and Goodwill
Acquisitions can create goodwill on the balance sheet and may also increase equity depending on financing.
Some companies publish alternative metrics such as return on tangible common equity that remove goodwill and certain intangible assets from the denominator.
These adjusted ratios can provide useful supplementary information.
However:
ROE ≠ Return on Tangible Common Equity
They use different equity definitions.
Adjusted figures should be labeled clearly and reconciled before comparison.
Return on Average Common Equity
A common variation focuses specifically on common shareholders:
Return on Average Common Equity = Net Income Available to Common Shareholders ÷ Average Common Equity × 100
Suppose:
Net income = $1 million
Preferred dividends = $100,000
Net income available to common = $900,000
Average common equity = $5 million
Then:
Return on Average Common Equity = $900,000 ÷ $5,000,000
= 18%
This differs from total-shareholders-equity ROE when preferred equity or preferred dividends are material.
Adjusted ROE
Companies sometimes present adjusted operating ROE or another non-GAAP variation.
Conceptually:
Adjusted ROE = Adjusted Earnings ÷ Adjusted Average Equity × 100
The adjustments can remove specified unusual items, accumulated other comprehensive income, goodwill, intangible assets, foreign-currency effects, or other balances.
Adjusted ROE can be useful when the methodology is transparent and consistent.
It should not be compared directly with conventional ROE without understanding those adjustments.
ROE and Accumulated Other Comprehensive Income
Some financial companies present equity-return measures that exclude accumulated other comprehensive income, commonly abbreviated AOCI.
Market movements in certain securities or other accounting items can cause AOCI to change significantly.
Removing it can change the denominator and therefore the return percentage.
Again, the important point is not that one definition is universally correct.
It is that the definition must be known before two ROE figures are compared.
ROE for Banks
ROE is widely used for banks because financial institutions operate with significant leverage and large asset bases.
A bank can report a relatively modest return on assets but a much higher ROE because assets are funded largely by liabilities, including customer deposits, with a smaller equity base.
For example:
ROA = 1.2%
Equity multiplier = 10
Conceptually:
ROE ≈ 1.2% × 10
ROE ≈ 12%
This illustrates why leverage is central to interpreting bank ROE.
It also illustrates why bank ROE should not be compared casually with ROE from an industrial or software company.
ROE Trend Analysis
Suppose ROE changes:
Year 1 = 12%
Year 2 = 15%
Year 3 = 18%
Year 4 = 22%
The trend appears favorable.
But the next step is determining why.
Did net margin improve?
Did asset turnover rise?
Did the company add leverage?
Did share repurchases reduce equity?
A rising ROE generated through stronger margins and asset efficiency has different implications from a rising ROE driven entirely by a shrinking equity denominator.
Declining ROE Example
Suppose:
Year 1:
Net income = $1 million
Average equity = $5 million
ROE = 20%
Year 2:
Net income = $1.2 million
Average equity = $8 million
ROE = 15%
Profit increased by 20%.
ROE declined.
Equity increased by 60%, perhaps because the company retained earnings or issued new shares.
The lower ROE could indicate weaker capital efficiency—or simply that recently added capital has not yet reached mature earnings.
Rising ROE From Better Profitability
Suppose average equity remains $5 million.
Year 1 net income:
$500,000
ROE:
10%
Year 2 net income:
$800,000
ROE:
16%
Here the entire increase comes from stronger earnings.
That is a more direct improvement in economic performance than an increase produced solely by reducing book equity.
Rising ROE From a Smaller Denominator
Now suppose:
Net income remains $800,000.
Average equity falls from $5 million to $4 million.
Original:
ROE = 16%
New:
ROE = $800,000 ÷ $4,000,000
ROE = 20%
The ratio improved by four percentage points even though earnings did not increase.
This is why denominator analysis matters.
ROE and Shareholder Dilution
When a company issues shares, each existing investor can own a smaller percentage of the business unless they participate proportionally.
At the company level, equity rises.
If the new capital does not immediately generate additional earnings, ROE can decline.
However, dilution and ROE are separate concepts.
A share issuance could lower current ROE while creating substantial long-term value if the funds are invested at attractive returns.
ROE and Losses
Repeated losses reduce retained earnings and can shrink equity.
This can create strange ROE behavior.
A company may report:
Year 1 loss → negative ROE.
After several years of losses, equity becomes extremely small.
A modest later profit can then produce an enormous positive ROE.
The apparent turnaround percentage may look spectacular even though the balance sheet remains financially weak.
Historical equity changes should therefore be reviewed whenever ROE becomes unusually large.
ROE and Capital Structure
A company can finance assets using:
equity;
short-term liabilities;
long-term debt;
and other obligations.
ROE focuses on the portion funded by shareholder capital.
Consequently, capital-structure decisions can materially affect the denominator.
This sensitivity makes ROE powerful but also easier to misinterpret than a measure based on the full asset or invested-capital base.
Comparing ROE Between Companies
Before comparing two ROE figures, check:
whether both use net income;
whether preferred dividends are deducted;
whether equity is total or common equity;
whether averages or period-end balances are used;
whether the result is annualized;
whether AOCI is included;
whether goodwill is excluded;
whether the measure is reported or adjusted;
and whether leverage levels are comparable.
Two percentages labeled “ROE” may not be calculated identically.
ROE and Accounting Write-Downs
An asset impairment can reduce earnings immediately.
It can also reduce assets and equity.
During the impairment year, ROE can fall sharply because net income is reduced.
In later years, the equity denominator may remain smaller.
If earnings recover, ROE can rise mechanically.
A post-write-down improvement should therefore be interpreted carefully.
ROE and Inflation
Book equity reflects accounting values rather than current replacement values for every asset.
In businesses holding older assets purchased many years ago, book equity can be materially different from the current economic value of the enterprise.
Inflation and historical-cost accounting can therefore make ROE comparisons across companies of different age or acquisition history less straightforward.
Annualizing Quarterly ROE
Quarterly ROE calculations are often annualized.
Suppose quarterly net income is $100,000 and average equity is $4 million.
Quarterly return:
$100,000 ÷ $4,000,000 = 2.5%
A simple annualized presentation might multiply by four:
10% Annualized ROE
However, this assumes the quarter is representative of the year.
Seasonal businesses can make mechanical annualization misleading.
Always identify whether an ROE figure is annual, trailing twelve months, or annualized from a shorter period.
ROE and Equity of Zero
If average shareholders’ equity equals zero:
ROE = Net Income ÷ 0
The ratio is mathematically undefined.
It should not be reported as zero.
A zero or near-zero equity denominator is a strong sign that another performance measure is required.
Common Return on Equity Mistakes
One common mistake is using ending equity even though equity changed substantially during the year.
Another is comparing ROE across businesses with dramatically different leverage without considering financing risk.
Analysts can also treat high ROE as proof of strong operations when the ratio rose because share repurchases reduced equity.
Another mistake is comparing conventional ROE with return on tangible common equity or adjusted ROE without checking definitions.
Users also confuse ROE with ROI.
A fifth mistake is assuming negative or near-zero equity produces meaningful conventional ROE.
Finally, strong ROE should not be treated as proof of strong cash flow or attractive valuation.
Limitations of Return on Equity
ROE is one of the most useful shareholder-capital efficiency ratios, but it has significant limitations.
It is highly sensitive to leverage.
Share repurchases can reduce the denominator.
Large dividends can reduce retained equity.
New equity issuance can depress the ratio temporarily.
Negative or near-zero equity can make the result meaningless.
Accounting write-downs, goodwill, intangible assets, and AOCI can affect comparability.
ROE also uses accounting earnings rather than cash flow.
Different companies may calculate reported or adjusted ROE differently.
For these reasons, ROE should be evaluated alongside ROA, ROCE, ROIC, leverage, margins, cash flow, and valuation.
How to Analyze Return on Equity Properly
Start with the exact numerator.
For a conventional total-equity calculation:
Numerator = Net Income
Then calculate representative average equity:
Average Equity = (Beginning Equity + Ending Equity) ÷ 2
Use more frequent observations when equity changes significantly during the year.
Calculate:
ROE = Net Income ÷ Average Equity × 100
Next, compare the result with prior periods and genuinely comparable businesses.
Then use the DuPont framework:
ROE = Net Profit Margin × Asset Turnover × Equity Multiplier
Determine whether ROE comes primarily from:
profitability;
asset efficiency;
or leverage.
Review share repurchases, dividends, new equity issuance, acquisitions, and write-downs.
Compare ROE with ROA, ROCE, and ROIC.
Finally, examine operating and free cash flow to determine whether accounting profits are turning into cash.
This approach explains not only what the ROE percentage is, but what created it and whether the result appears sustainable.
Why Return on Equity Matters
Return on equity measures the relationship between shareholder capital and the earnings generated from it.
Its central formula is:
ROE = Net Income ÷ Average Shareholders’ Equity × 100
The ratio becomes much more informative when decomposed:
ROE = Net Profit Margin × Asset Turnover × Equity Multiplier
That equation shows why the same ROE can arise from very different business models.
One company may produce high ROE through exceptional margins.
Another may turn assets rapidly.
A third may rely heavily on debt.
The percentage alone cannot tell you which.
The strongest ROE analysis therefore asks:
How much return is being generated for shareholders, what operating and financing factors create that return, how much risk supports it, and can the company sustain attractive returns as its equity base changes?
Frequently Asked Questions
What is return on equity in simple terms?
Return on equity measures how much accounting profit a company generates relative to shareholders’ equity.
What is the ROE formula?
A common formula is:
ROE = Net Income ÷ Average Shareholders’ Equity × 100
How do you calculate average shareholders’ equity?
A common calculation is:
Average Equity = (Beginning Equity + Ending Equity) ÷ 2
More frequent averages can be useful when equity changes substantially during the period.
What does a 20% ROE mean?
It means annual net income equals approximately 20% of average shareholders’ equity under the selected calculation.
What is a good return on equity?
There is no universal good ROE. The ratio should be compared with the company’s history, similar businesses, leverage, risk, capital requirements, and the sustainability of earnings.
Is higher ROE always better?
No. Higher ROE can reflect stronger profitability or asset efficiency, but it can also result from greater debt, share repurchases, a smaller equity base, or accounting changes.
Can ROE be negative?
Yes. If net income is negative and average shareholders’ equity is positive, ROE will be negative.
What happens if shareholders’ equity is negative?
Conventional ROE becomes difficult to interpret. A negative denominator can create counterintuitive positive or negative percentages that do not represent normal shareholder-return economics.
What is the difference between ROE and ROA?
ROE compares net income with shareholders’ equity. ROA compares net income with total assets. ROE is more sensitive to financial leverage.
What is the difference between ROE and ROIC?
ROE measures earnings relative to shareholder equity. ROIC generally measures after-tax operating earnings relative to capital invested in the operating business.
How does debt affect return on equity?
Debt can increase ROE by allowing a company to support more assets with less equity when borrowed capital generates adequate returns. It also increases financial risk and can magnify shareholder losses when earnings weaken.
What is the DuPont formula for ROE?
A common three-part DuPont formula is:
ROE = Net Profit Margin × Asset Turnover × Equity Multiplier
It separates ROE into profitability, asset-efficiency, and leverage components.




