


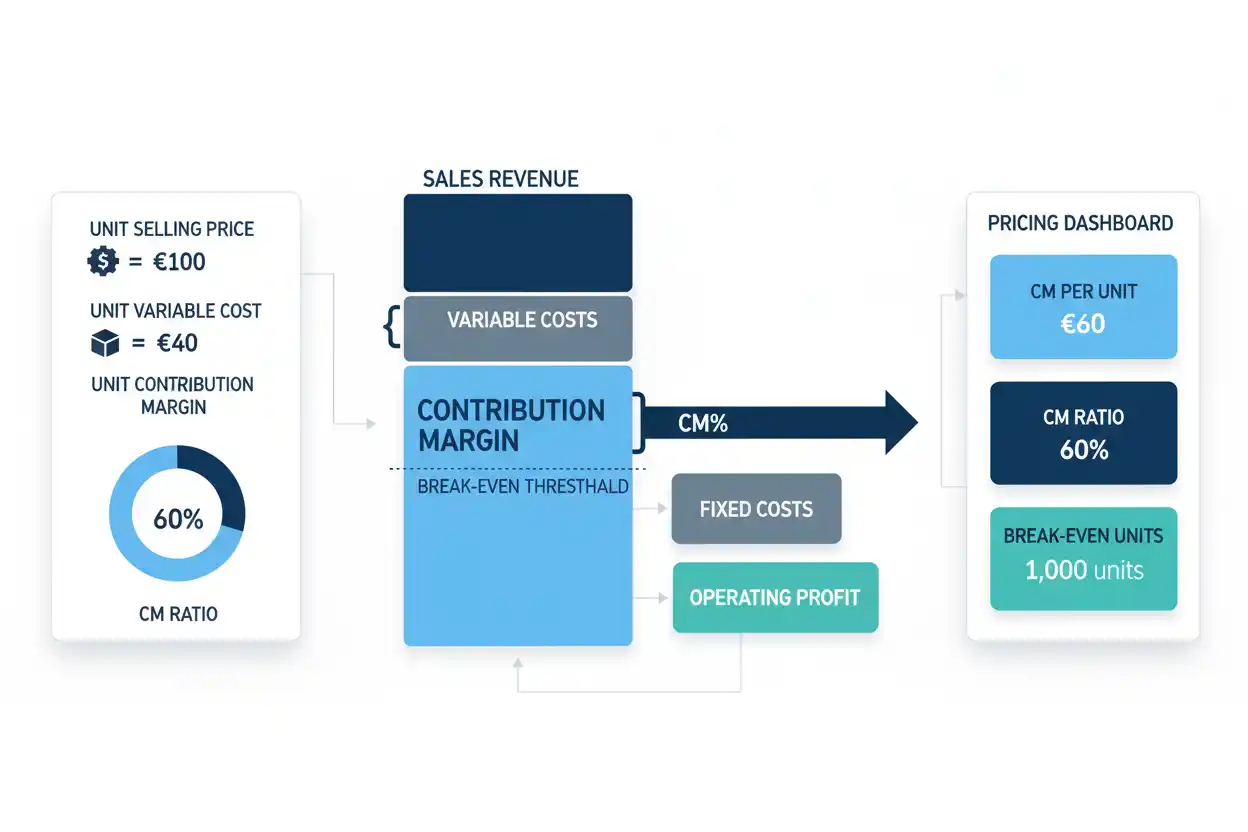
Contribution margin is the amount of sales revenue left after the variable costs associated with those sales are deducted. That remaining amount contributes toward fixed costs first and toward operating profit after fixed costs have been covered.
For an individual product or service:
Contribution Margin per Unit = Selling Price per Unit − Variable Cost per Unit
If a product sells for $100 and variable costs are $65:
Contribution Margin per Unit = $100 − $65 = $35
Each unit contributes $35 toward the company’s fixed-cost base and, once fixed costs have been covered, operating profit.
Contribution margin can also be measured across total sales or expressed as a percentage of revenue. These related calculations make it useful for pricing, product decisions, break-even analysis, profitability planning, and broader business finance.
What Is Contribution Margin?
Contribution margin separates costs according to how they behave when sales volume changes.
Revenue comes into the business. Variable costs associated with generating those sales are deducted. The amount that remains is the contribution margin.
Conceptually:
Sales Revenue − Variable Costs = Contribution Margin
The contribution then has two jobs.
First, it covers fixed costs.
After the required fixed costs have been covered, additional contribution can increase operating profit.
This is why contribution margin is central to cost-volume-profit analysis. It connects selling price, variable costs, fixed costs, sales volume, break-even level, and profit in one framework.
Formula
For total sales:
Contribution Margin = Sales Revenue − Total Variable Costs
Suppose a company generates $500,000 of sales and incurs $320,000 of variable costs.
Contribution Margin = $500,000 − $320,000
Contribution Margin = $180,000
The company’s total contribution margin is $180,000.
If its fixed costs are $140,000:
Operating Profit = $180,000 − $140,000
Operating Profit = $40,000
This simplified relationship demonstrates why contribution margin cannot be interpreted as profit itself.
The contribution still needs to cover fixed costs before an operating profit remains.
Per Unit Formula
When a business sells identifiable units, the per-unit version is often the most useful.
Contribution Margin per Unit = Selling Price per Unit − Variable Cost per Unit
Suppose a product sells for $75 and costs $45 in variable expenses to produce, sell, and fulfill.
Contribution Margin per Unit = $75 − $45
Contribution Margin per Unit = $30
For every unit sold, $30 contributes toward fixed costs and then profit.
If the company sells 5,000 units:
Total Contribution Margin = 5,000 × $30
Total Contribution Margin = $150,000
This unit economics perspective makes the metric particularly useful when evaluating prices, discounts, production levels, or product mix.
Ratio Formula
The contribution margin ratio expresses contribution margin as a percentage of sales revenue.
Contribution Margin Ratio = Contribution Margin ÷ Sales Revenue × 100
Alternatively, on a per-unit basis:
Contribution Margin Ratio = Contribution Margin per Unit ÷ Selling Price per Unit × 100
Using the previous $75 product with $30 contribution:
Contribution Margin Ratio = $30 ÷ $75 × 100
Contribution Margin Ratio = 40%
This means approximately 40 cents of each sales dollar remains after variable costs to cover fixed costs and profit.
The U.S. Small Business Administration uses this relationship in its current break-even guidance, defining contribution margin in connection with selling price and variable cost.
Example
Consider a company that sells 10,000 units at $50 each.
Total revenue is:
Revenue = 10,000 × $50
Revenue = $500,000
Variable cost is $32 per unit:
Total Variable Costs = 10,000 × $32
Total Variable Costs = $320,000
Contribution margin becomes:
Contribution Margin = $500,000 − $320,000
Contribution Margin = $180,000
Per unit:
Contribution Margin per Unit = $50 − $32 = $18
Contribution margin ratio:
Contribution Margin Ratio = $180,000 ÷ $500,000 × 100
Contribution Margin Ratio = 36%
If fixed costs equal $135,000:
Operating Profit = $180,000 − $135,000
Operating Profit = $45,000
The example shows the complete relationship among sales, variable costs, contribution, fixed costs, and operating profit.
What Are Variable Costs?
Variable costs change with the level of production, sales, or another activity driver under the assumptions being analyzed.
Depending on the business, they can include materials, packaging, per-unit manufacturing labor, transaction charges, sales commissions, shipping, fulfillment, usage-based infrastructure, and other costs linked to additional sales.
Suppose a company sells an item for $80 and incurs:
Materials: $30
Packaging: $5
Payment fee: $2
Sales commission: $8
Variable cost per unit is:
Variable Cost = $30 + $5 + $2 + $8
Variable Cost = $45
Contribution margin becomes:
Contribution Margin = $80 − $45
Contribution Margin = $35
Correctly identifying cost behavior is essential. If a variable cost is omitted, contribution margin will be overstated.
What Are Fixed Costs?
Fixed costs do not change directly with each additional unit sold within a particular operating range and time period.
Examples can include facility rent, certain salaries, insurance, software subscriptions, and other costs that remain relatively stable as volume changes.
Fixed costs are not deducted when calculating contribution margin.
They are paid from contribution margin.
Suppose total contribution is $200,000 while fixed costs are $160,000.
Operating Profit = $200,000 − $160,000
Operating Profit = $40,000
If contribution is only $130,000:
Operating Profit = $130,000 − $160,000
Operating Loss = −$30,000
The company still produces positive contribution on its sales, but not enough to cover the fixed-cost structure.
Contribution Margin and Break-Even Point
Contribution margin is the denominator in the standard break-even point calculation.
Break-Even Units = Fixed Costs ÷ Contribution Margin per Unit
Suppose fixed costs are $120,000 and contribution margin per unit is $30.
Break-Even Units = $120,000 ÷ $30
Break-Even Units = 4,000 units
The company needs 4,000 unit sales before total contribution equals fixed costs under the model.
If contribution margin increases, break-even units fall.
If contribution margin declines, the business must sell more units to reach break-even.
This direct relationship is why contribution margin matters so much in pricing and cost decisions.
Contribution Margin and Break-Even Revenue
The contribution margin ratio can be used to calculate break-even revenue.
Break-Even Revenue = Fixed Costs ÷ Contribution Margin Ratio
Suppose fixed costs are $180,000 and the contribution margin ratio is 30%.
Break-Even Revenue = $180,000 ÷ 0.30
Break-Even Revenue = $600,000
The company needs approximately $600,000 of revenue under those assumptions for contribution to cover fixed costs.
The broader break-even analysis page examines how this threshold changes under different price, cost, and sales scenarios.
Contribution Margin vs Gross Margin
Contribution margin and gross margin can look similar because both subtract costs from revenue.
They are not necessarily the same.
Gross profit generally starts with revenue minus cost of goods sold.
Gross Profit = Revenue − Cost of Goods Sold
Gross margin expresses gross profit as a percentage of revenue.
Contribution margin instead subtracts variable costs, regardless of where those costs appear in financial-statement presentation.
Some costs included in cost of goods sold can be fixed or semi-fixed. Some variable selling costs can appear below gross profit.
As a result, contribution margin and gross margin can differ even for the same business.
The IRS distinguishes gross receipts, cost of goods sold, and gross profit in business reporting, while contribution margin is a managerial cost-behavior measure rather than simply another name for reported gross profit.
Contribution Margin vs Gross Profit
Gross profit is an accounting subtotal based on revenue and cost of goods sold.
Contribution margin is primarily a management-analysis concept based on variable versus fixed cost behavior.
Suppose a factory has $100,000 of fixed production overhead included in cost of goods sold.
That fixed overhead can reduce reported gross profit.
However, it would not normally be treated as a variable cost in a contribution-margin model simply because it appears within COGS.
The two metrics therefore serve different purposes.
Gross profit helps describe reported profitability.
Contribution margin helps management understand how individual sales contribute toward the fixed-cost base and profit.
Contribution Margin Is Not Always a GAAP Measure
Businesses sometimes report company-specific versions of “contribution margin” externally.
Definitions can differ.
SEC staff explicitly warns that a contribution margin calculated from GAAP revenue less selected expenses can be a non-GAAP financial measure and should not be mislabeled as a GAAP line item such as net revenue or gross profit.
Recent SEC-filed company materials also demonstrate that issuers may define contribution margin differently for their own businesses and identify those measures as non-GAAP.
For internal decision-making, the practical lesson is simple: define exactly which costs are included before comparing contribution margin figures.
Contribution Margin vs Net Profit
Net profit includes a much broader set of costs than contribution margin.
Contribution margin subtracts variable costs from revenue.
Net profit can reflect fixed operating costs, interest, taxes, depreciation, and other recognized expenses depending on the financial statements.
A product can have a strong positive contribution margin while the overall company remains unprofitable.
For example:
Revenue: $1,000,000
Variable costs: $600,000
Contribution Margin = $400,000
If fixed and other expenses total $500,000:
Net Result = $400,000 − $500,000 = −$100,000
Positive contribution does not guarantee positive net profit.
Contribution Margin vs Operating Margin
Operating margin measures operating income relative to revenue.
Contribution margin is calculated before fixed operating costs are deducted under the cost-volume-profit framework.
Suppose contribution margin ratio is 45%, but fixed operating costs reduce operating income to 12% of revenue.
Both numbers can be correct.
The contribution margin describes incremental economics before fixed costs.
Operating margin describes overall operating profitability after those fixed operating expenses.
Contribution Margin vs Markup
Contribution margin and markup are frequently confused because both involve selling price and cost.
Markup expresses profit or price increment relative to cost under the chosen definition.
Contribution margin ratio expresses contribution relative to sales price.
Suppose a product costs $60 in variable cost and sells for $100.
Contribution margin:
Contribution Margin = $100 − $60 = $40
Contribution margin ratio:
Contribution Margin Ratio = $40 ÷ $100 = 40%
Markup on the $60 cost:
Markup = $40 ÷ $60 × 100
Markup ≈ 66.7%
The same $40 difference produces a 40% contribution margin ratio and approximately 66.7% markup because the denominator changes.
The margin vs markup guide covers this denominator difference in more depth.
Contribution Margin and Cost-Plus Pricing
Cost-plus pricing starts with cost and adds a specified markup or margin according to the pricing method.
Contribution margin asks what remains after relevant variable costs once the selling price has been established.
Suppose variable cost is $40 and the company chooses a selling price of $65.
Contribution Margin = $65 − $40 = $25
That $25 must be assessed against fixed costs, expected demand, capacity, competition, and required profit.
A price can be above cost while still producing inadequate contribution to support the business.
Contribution Margin and Price Changes
A price increase can improve contribution margin significantly when variable cost remains unchanged.
Suppose selling price is $100 and variable cost is $70.
Contribution Margin = $30
Increase price by 10% to $110:
New Contribution Margin = $110 − $70 = $40
The price rose 10%, but contribution increased from $30 to $40—an increase of approximately 33.3%.
This illustrates why relatively modest pricing changes can materially alter unit economics.
However, demand may respond to the higher price.
Contribution margin analysis measures the financial consequence per unit; it does not predict how many customers will continue buying.
Contribution Margin and Discounts
Discounts can reduce contribution more sharply than the discount percentage suggests.
Suppose a product sells for $100 with variable costs of $70.
Original Contribution Margin = $30
Apply a 10% discount:
Discounted Selling Price = $90
New Contribution Margin = $90 − $70 = $20
Price declined 10%, but contribution declined by one-third.
The business must sell more units to generate the same total contribution.
Original contribution from 100 units:
100 × $30 = $3,000
Required discounted units for the same $3,000:
Required Units = $3,000 ÷ $20 = 150 units
The company must sell 50% more units to produce the original total contribution under this simplified example.
Contribution Margin and Target Profit
Contribution margin can be used to determine how many units are required to reach a target operating profit.
Required Units = (Fixed Costs + Target Profit) ÷ Contribution Margin per Unit
Suppose fixed costs are $200,000, desired operating profit is $100,000, and contribution margin is $25 per unit.
Required Units = ($200,000 + $100,000) ÷ $25
Required Units = 12,000 units
The company needs approximately 12,000 sales under the model to cover fixed costs and generate the $100,000 target profit.
This extends contribution analysis beyond the simple break-even point.
Contribution Margin for Multiple Products
Businesses selling several products can have different contribution margins for each item.
Suppose:
Product A contribution = $20 per unit
Product B contribution = $50 per unit
Selling one unit of B contributes 2.5 times as much toward fixed costs as one unit of A.
However, the higher-contribution product may sell in lower volumes.
Management therefore needs to consider sales mix.
If Product A represents 70% of expected unit sales and Product B 30%:
Weighted Average Contribution = ($20 × 70%) + ($50 × 30%)
Weighted Average Contribution = $14 + $15
Weighted Average Contribution = $29 per composite unit
Changing the sales mix can move the company’s overall contribution even when total unit volume remains unchanged.
Contribution Margin and Product Mix
A business can increase revenue while weakening total contribution if sales shift toward lower-contribution products.
Consider two products.
Product A generates $10 of contribution on a $40 sale.
Product B generates $40 of contribution on an $80 sale.
If customers increasingly choose Product A, revenue can grow while the contribution available to cover fixed costs grows more slowly.
This is why managers should examine contribution by product, channel, customer type, or another economically meaningful segment when reliable cost data exist.
The highest-revenue product is not automatically the product creating the greatest economic contribution.
Contribution Margin and Customer Acquisition Cost
For businesses that spend heavily to acquire customers, customer acquisition cost should be interpreted alongside contribution economics.
Suppose acquiring a customer costs $200.
If that customer’s initial purchase produces only $20 of contribution, the business does not recover acquisition spending from the first transaction.
If customer retention produces repeated future contribution, the economics can still work.
That is where customer lifetime value becomes relevant.
CAC, customer lifetime value, and contribution margin answer different questions, but together they reveal whether customer growth is economically sustainable.
Contribution Margin and Cash Flow
Contribution margin is not a cash-flow measure.
Revenue may be recognized before customer cash is received.
Variable expenses can also be paid at different times from when they are recognized.
Consequently, a company can produce a positive contribution margin while still experiencing cash pressure.
Cash flow forecasting adds the timing dimension that contribution margin lacks.
For businesses with inventories and credit sales, the cash conversion cycle can further explain why positive unit economics do not immediately create available cash.
Contribution Margin and Cash Runway
For a cash-consuming business, stronger contribution economics can help extend cash runway when additional sales generate more cash contribution than they consume in incremental costs.
Suppose a startup burns $150,000 per month.
If customer growth generates an additional $80,000 of monthly contribution without an equivalent increase in fixed expenses, net burn may decline substantially.
The effect depends on collection timing and other cash movements, so contribution should not simply be substituted for net cash flow.
Still, the relationship helps explain how operating improvements can reduce reliance on external financing.
Contribution Margin and Operating Leverage
Operating leverage describes how a company’s fixed-versus-variable cost structure can amplify changes in operating profit.
Businesses with high fixed costs but strong contribution per additional sale may experience rapid profit improvement after passing break-even.
Suppose contribution margin is $50 per unit and fixed costs have already been fully covered.
An additional 1,000 units can contribute:
Additional Contribution = 1,000 × $50
Additional Contribution = $50,000
If no additional fixed costs are triggered and other assumptions remain constant, much of that contribution can increase operating profit.
This relationship can also work in reverse when sales decline.
Contribution Margin and Capacity
A high contribution margin does not guarantee a company should sell unlimited volume.
Capacity can constrain the decision.
Suppose Product A contributes $40 per unit but consumes two machine hours.
Product B contributes $30 but requires only one machine hour.
Contribution per constrained machine hour is:
Product A = $40 ÷ 2 = $20 per machine hour
Product B = $30 ÷ 1 = $30 per machine hour
If machine time is the bottleneck, Product B creates more contribution per constrained resource despite having a lower contribution per unit.
This is why management decisions sometimes need contribution per limiting factor rather than contribution per product.
Negative Contribution Margin
A product has negative contribution margin when its variable costs exceed its selling price.
Suppose selling price is $50 and variable cost is $58.
Contribution Margin = $50 − $58
Contribution Margin = −$8
Each additional sale loses $8 before fixed costs are even considered.
That does not automatically mean the product should be discontinued. Loss leaders, introductory offers, strategic bundles, capacity utilization, or complementary sales can affect the decision.
However, negative contribution requires a clear economic justification.
Increasing volume by itself makes the direct negative contribution larger.
Can Contribution Margin Be 100%?
A contribution margin ratio of 100% would imply zero variable cost under the chosen definition.
Contribution Margin Ratio = (Revenue − $0 Variable Cost) ÷ Revenue = 100%
Some digital products or services can have very low incremental costs, but treating variable costs as literally zero requires care.
Payment fees, support, hosting usage, commissions, fulfillment, or other incremental costs may still exist.
A very high contribution margin does not mean the company has no fixed costs.
Can Contribution Margin Exceed 100%?
Under a conventional model with positive sales and nonnegative variable costs, contribution margin ratio ordinarily does not exceed 100%.
A result above 100% suggests unusual credits, negative variable costs, inconsistent classifications, or an error in the inputs.
The data and definition should be reviewed before interpreting such a result.
Is a Higher Contribution Margin Better?
Higher contribution generally gives a company more revenue available to cover fixed costs and profit.
However, a higher percentage alone does not make a product or business superior.
A high-margin product may sell very few units.
A lower-margin product may produce far more total contribution because of much greater volume.
For example:
Product A: $70 contribution × 1,000 units = $70,000
Product B: $20 contribution × 10,000 units = $200,000
Product B produces far more total contribution despite its lower per-unit contribution.
Both percentage and volume matter.
What Is a Good Contribution Margin?
There is no universal good contribution margin.
Variable-cost structures differ dramatically among industries.
A software business can have very different contribution economics from a supermarket, manufacturer, construction contractor, or delivery service.
The useful comparison is often against the company’s historical performance, realistic product alternatives, required fixed costs, break-even level, and genuinely comparable businesses.
Even then, definitions must be consistent.
The SEC notes that company-specific contribution-margin measures can be non-GAAP and may differ in what costs they exclude, which limits casual cross-company comparisons.
How to Improve Contribution Margin
Contribution margin improves mathematically when selling price increases or variable cost falls.
A business might reduce material waste, renegotiate supplier pricing, improve fulfillment efficiency, change commissions, reduce transaction costs, redesign packaging, or improve purchasing.
Pricing changes can also increase contribution if demand remains economically viable.
Product mix matters as well. Shifting sales toward products that generate more contribution can improve total economics.
The best strategy depends on customer behavior and operating constraints.
Cutting variable cost so aggressively that quality declines can damage future revenue, while raising prices without considering demand can reduce total contribution.
Contribution Margin Trend Analysis
Tracking contribution margin over time helps reveal changes in unit economics.
Suppose the contribution margin ratio changes:
Year 1: 42%
Year 2: 39%
Year 3: 34%
The decline deserves investigation.
Perhaps input costs increased faster than prices.
Maybe discounts became more common.
Sales may have shifted toward lower-margin products.
Commissions, shipping, or other variable expenses may have increased.
Conversely, an improving ratio can reflect stronger pricing or better variable-cost efficiency.
The trend identifies movement; operational analysis explains the cause.
Contribution Margin and Current Ratio
Contribution margin and the current ratio describe entirely different aspects of a business.
Contribution margin evaluates the economics of sales.
Current ratio evaluates current assets relative to current liabilities.
A company can have excellent contribution economics but weak short-term liquidity because customers pay slowly or because debt obligations are large.
Another business can have substantial current assets while producing weak contribution on each sale.
Profitability and liquidity should therefore be analyzed separately before being connected.
Common Contribution Margin Mistakes
The most common mistake is confusing contribution margin with gross margin.
Another is failing to include all relevant variable costs.
Businesses may calculate contribution only from production cost while ignoring sales commissions, transaction fees, fulfillment, or other costs that vary directly with sales.
A further mistake is assuming high contribution percentage automatically produces high total profit.
Fixed costs still matter.
Product volume matters.
Capacity matters.
Customer acquisition and retention can matter.
Finally, comparing contribution margins between companies without confirming how each company defines the measure can be misleading.
How to Calculate Contribution Margin Properly
Start by defining the unit, product, customer, channel, or period being analyzed.
Identify the relevant sales revenue.
Then identify costs that actually vary with the chosen activity under the model.
Subtract those variable costs from revenue.
For unit analysis:
Contribution Margin per Unit = Selling Price − Variable Cost per Unit
For total analysis:
Contribution Margin = Total Revenue − Total Variable Costs
For percentage analysis:
Contribution Margin Ratio = Contribution Margin ÷ Revenue × 100
Then compare the result with fixed costs, required volume, pricing alternatives, and business objectives.
The calculation should support a decision rather than exist as an isolated percentage.
Frequently Asked Questions
What is contribution margin?
Contribution margin is sales revenue remaining after variable costs are deducted. It contributes toward fixed costs first and profit after fixed costs have been covered.
What is the contribution margin formula?
Contribution Margin = Sales Revenue − Variable Costs
What is contribution margin per unit?
Contribution Margin per Unit = Selling Price per Unit − Variable Cost per Unit
It measures how much each additional unit contributes toward fixed costs and profit.
What is the contribution margin ratio?
Contribution Margin Ratio = Contribution Margin ÷ Revenue × 100
It expresses contribution as a percentage of sales.
What does a 40% contribution margin mean?
It means approximately 40% of sales revenue remains after the variable costs included in the calculation.
Is contribution margin the same as gross margin?
No. Gross margin is based on gross profit and cost of goods sold. Contribution margin is based on variable-cost behavior. The two can differ materially.
Is contribution margin the same as profit?
No. Fixed costs and potentially other expenses still need to be deducted before the company reaches its final profit measure.
Why is contribution margin used in break-even analysis?
Each unit’s contribution is what covers fixed costs. Therefore, dividing fixed costs by contribution margin per unit gives the unit break-even point.
Can contribution margin be negative?
Yes. It becomes negative when variable cost exceeds selling price under the calculation.
Is a higher contribution margin always better?
Not automatically. Total contribution depends on both contribution per sale and sales volume, while broader profitability also depends on fixed costs and other financial factors.
How can a business increase contribution margin?
It can increase selling price, reduce relevant variable costs, improve sales mix, or combine these approaches while considering demand, quality, and operating constraints.
Is contribution margin a GAAP measure?
Contribution margin is commonly used for managerial analysis, but company-specific external presentations may qualify as non-GAAP financial measures depending on how they are calculated and presented. Definitions should be disclosed and compared carefully.
Final Perspective
Contribution margin shows what remains from a sale after its variable costs:
Contribution Margin = Revenue − Variable Costs
On a per-unit basis:
Contribution Margin per Unit = Selling Price − Variable Cost per Unit
As a percentage:
Contribution Margin Ratio = Contribution Margin ÷ Revenue × 100
These formulas explain why contribution margin is so useful.
It connects individual sales with fixed-cost coverage, break-even volume, pricing decisions, product mix, target profit, and operating leverage.
But the number must be interpreted carefully.
Contribution margin is not gross profit, net profit, or cash flow. Its usefulness depends on correctly identifying variable costs and keeping definitions consistent.
The practical question is therefore not merely:
“What is our margin?”
It is:
“How much does each sale genuinely contribute toward the costs that remain—and is that contribution sufficient to support the business model at realistic sales volume?”




