


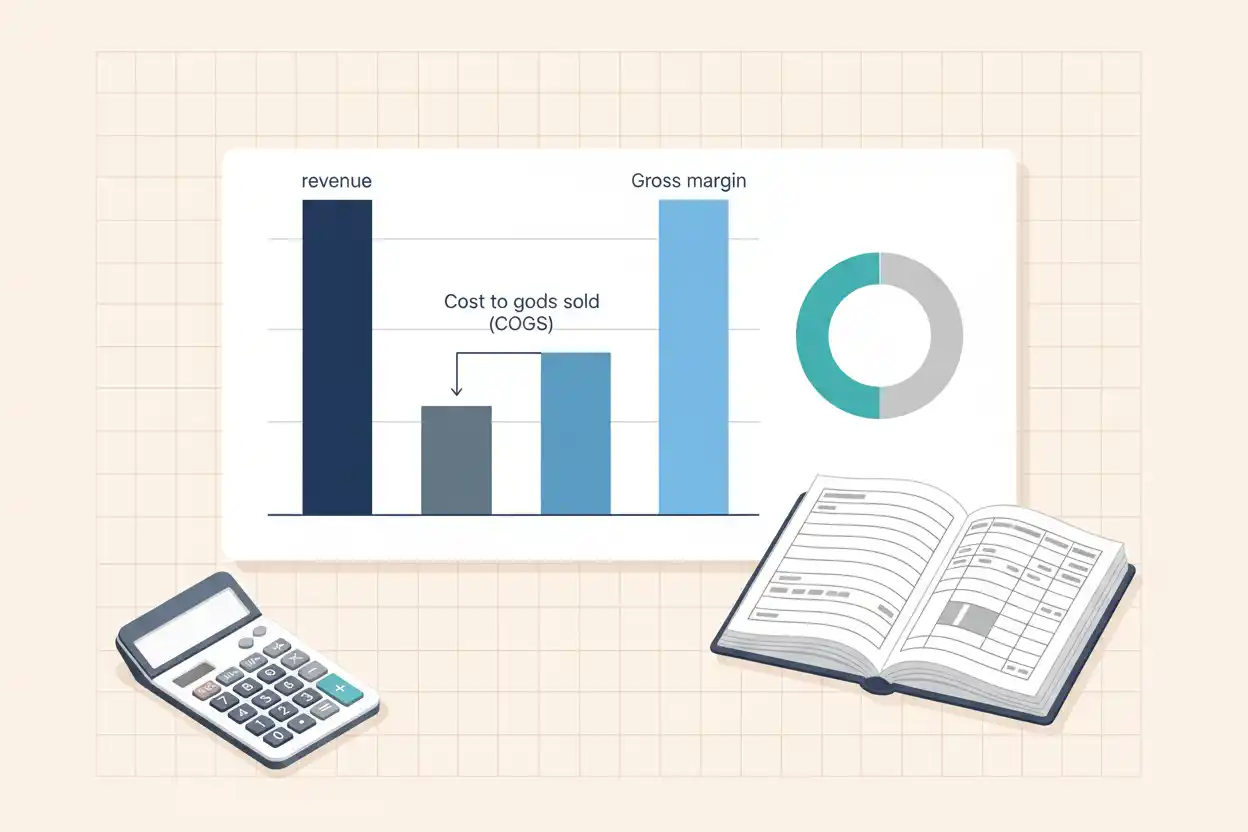
Gross margin measures how much of a company’s revenue remains after subtracting the direct costs associated with producing or supplying what it sells. It expresses that remaining amount as a percentage of revenue, making it useful for evaluating pricing, production economics, product mix, and changes in direct costs over time.
A company with a 40% gross margin keeps $0.40 from each $1.00 of revenue after accounting for its cost of goods sold or comparable direct cost of revenue. That remaining amount still has to cover operating expenses, financing costs, taxes, and other obligations before becoming net profit.
Gross margin belongs to a broader set of business finance measures used to understand how revenue moves through a company’s cost structure. It is closely connected to gross profit, but the two measurements answer different questions: gross profit is normally expressed as a dollar amount, while gross margin converts that result into a percentage of revenue.
What Is Gross Margin?
Gross margin is the percentage of revenue left after subtracting cost of goods sold, often abbreviated COGS, or another equivalent direct cost-of-revenue figure.
The measurement focuses on the economics of delivering the product or service before many broader business expenses enter the calculation. For that reason, it can help show whether pricing and direct production or fulfillment costs are creating enough economic room to support the rest of the organization.
For example, suppose a business generates $500,000 in revenue and incurs $300,000 in cost of goods sold. Gross profit is $200,000. Dividing that gross profit by $500,000 of revenue gives a gross margin of 40%.
That does not mean the business earns a 40% final profit. Expenses such as administration, marketing, rent, interest, and taxes may still need to be deducted.
This distinction becomes especially important when comparing gross margin with operating margin or net profit margin, both of which measure profitability further down the income statement.
Gross Margin Formula
The standard gross margin formula is:
Gross Margin = (Revenue − Cost of Goods Sold) ÷ Revenue × 100
Because revenue minus cost of goods sold equals gross profit, the formula can also be written as:
Gross Margin = Gross Profit ÷ Revenue × 100
The result is normally expressed as a percentage.
If revenue is $100,000 and cost of goods sold is $65,000:
Gross Margin = ($100,000 − $65,000) ÷ $100,000 × 100
Gross Margin = 35%
The company therefore retains 35 cents of gross profit for every dollar of revenue before operating and other expenses.
How to Calculate Gross Margin Step by Step
The calculation begins with revenue for the period being analyzed. Revenue and cost of goods sold should refer to the same accounting period so that the percentage represents a meaningful relationship between sales and their associated direct costs.
Suppose a retailer reports:
Revenue = $800,000
Cost of goods sold = $520,000
First calculate gross profit:
Gross Profit = Revenue − Cost of Goods Sold
Gross Profit = $800,000 − $520,000 = $280,000
Then divide gross profit by revenue:
Gross Margin = $280,000 ÷ $800,000 × 100
Gross Margin = 35%
The company’s gross margin is therefore 35%.
While this calculation is straightforward, interpretation requires understanding what has been classified as cost of sales. A business with substantial fixed costs outside COGS can report a healthy gross margin and still generate weak operating results.
Likewise, changes in variable costs such as materials, product acquisition, direct processing, or certain fulfillment expenses can materially change gross margin even when sales volume remains strong.
What Does a 40% Gross Margin Mean?
A 40% gross margin means that 40% of revenue remains after the direct costs included in cost of goods sold have been deducted.
For every $100 in revenue:
Gross Profit = $40
Cost of Goods Sold = $60
The $40 is not necessarily profit available to the owner or shareholders. It must still absorb any expenses that fall below gross profit on the income statement.
If operating expenses equal $30 for every $100 of revenue, for example, the company’s operating profitability will be substantially lower than its 40% gross margin. That distinction is why gross margin should not be treated as a substitute for total profit or bottom-line profitability.
Gross Margin vs Gross Profit
Gross margin and gross profit come from the same underlying relationship but express the result differently.
Gross profit is:
Gross Profit = Revenue − Cost of Goods Sold
Gross margin is:
Gross Margin = Gross Profit ÷ Revenue × 100
Suppose two companies each earn $200,000 of gross profit.
Company A has revenue of $500,000:
$200,000 ÷ $500,000 = 40% gross margin
Company B has revenue of $1,000,000:
$200,000 ÷ $1,000,000 = 20% gross margin
The businesses have identical gross profit dollars but very different gross margins.
This is the central distinction between the two metrics. Gross profit owns the dollar-profit calculation; gross margin owns the percentage relationship between gross profit and revenue.
That percentage format often makes margin more useful when comparing periods, products, business units, or companies of different sizes.
Gross Margin vs Contribution Margin
Gross margin should also be kept separate from contribution margin.
Gross margin generally starts with revenue and subtracts cost of goods sold or cost of revenue. Contribution margin instead focuses on revenue remaining after variable costs.
Contribution Margin = Revenue − Variable Costs
Depending on the company’s accounting structure, cost of goods sold and variable costs are not necessarily identical.
Contribution margin is therefore particularly useful for pricing decisions, incremental sales analysis, and break-even analysis, while gross margin is generally more closely tied to financial statement analysis and the profitability of delivering goods or services.
Gross Margin vs Markup
Margin and markup are frequently confused because both use sales price and cost, but they use different denominators.
Gross margin asks what percentage of revenue remains after cost.
Markup asks how much the selling price exceeds cost.
If an item costs $60 and sells for $100:
Gross Margin = ($100 − $60) ÷ $100 = 40%
But:
Markup = ($100 − $60) ÷ $60 = 66.67%
The same transaction therefore has a 40% margin and approximately 66.67% markup.
Understanding margin vs markup matters when setting prices because applying a 40% markup does not produce a 40% gross margin.
Gross Margin vs Operating Margin
Gross margin evaluates profitability after direct product or service costs.
Operating margin goes further by incorporating operating expenses.
Operating Margin = Operating Profit ÷ Revenue × 100
If a company has:
Revenue = $1,000,000
Gross profit = $400,000
Operating profit = $120,000
Then:
Gross Margin = 40%
Operating Margin = 12%
The 28-percentage-point difference reflects operating expenses recognized between gross profit and operating profit.
Gross margin therefore tells you more about product-level or service-delivery economics, while operating margin gives a broader view of the economics of running the business.
Gross Margin vs Net Profit Margin
Net profit margin moves even further down the income statement.
Gross margin excludes many operating expenses, financing costs, taxes, and other items. Net profit margin reflects the percentage of revenue that ultimately remains as net profit after the applicable expenses have been recognized.
A company can therefore have a strong gross margin and a weak or even negative net profit margin.
For example:
Revenue = $2,000,000
Gross profit = $900,000
Net profit = $100,000
The gross margin is:
$900,000 ÷ $2,000,000 × 100 = 45%
The net profit margin is:
$100,000 ÷ $2,000,000 × 100 = 5%
The numbers answer different questions. Gross margin evaluates the economics between revenue and direct cost of sales; net margin evaluates final profitability relative to revenue.
What Is a Good Gross Margin?
There is no universally good gross margin percentage.
A reasonable level depends heavily on industry economics, product mix, business model, pricing power, accounting classification, distribution structure, competitive intensity, and the costs required to deliver the product or service.
A 25% margin could be attractive for one type of business and inadequate for another. A software-oriented company may operate with a fundamentally different cost structure from a retailer, manufacturer, restaurant, distributor, or construction company.
For that reason, gross margin usually becomes more informative when compared against:
the same company’s historical results, direct competitors using similar accounting classifications, management targets, specific products or segments, and changes in input costs or selling prices.
Trend analysis is often more useful than judging the percentage in isolation.
How Gross Margin Changes
Gross margin can increase because selling prices rise faster than direct costs, input costs fall, discounts decrease, manufacturing or fulfillment becomes more efficient, product mix shifts toward higher-margin products, or purchasing terms improve.
It can decline for the opposite reasons.
Suppose a product sells for $100 and costs $60 to supply. Its gross margin is 40%.
If the direct cost increases to $70 while the selling price stays at $100:
Gross Margin = ($100 − $70) ÷ $100 = 30%
The margin has fallen by 10 percentage points.
If instead the company raises its selling price to $115 while direct cost remains $70:
Gross Margin = ($115 − $70) ÷ $115 ≈ 39.13%
The pricing increase restores much of the lost margin.
This is one reason gross margin analysis can inform cost-plus pricing and target pricing, although pricing decisions also need to account for demand, competition, customer value, and broader business objectives.
Gross Margin and Pricing Decisions
Businesses can work backward from a desired gross margin to estimate a target selling price.
If cost is known and the desired gross margin is known:
Selling Price = Cost ÷ (1 − Target Gross Margin)
Suppose a product costs $45 and the company wants a 40% gross margin:
Selling Price = $45 ÷ (1 − 0.40)
Selling Price = $75
Selling the product for $75 produces:
($75 − $45) ÷ $75 = 40% gross margin
This calculation should not be confused with simply adding 40% to cost. Adding 40% to $45 gives a price of $63, which represents a 40% markup but only about a 28.57% gross margin.
Gross Margin and Break-Even Analysis
A healthy gross margin does not automatically mean the business has reached break-even.
Gross margin shows how much revenue remains after COGS, while break-even analysis determines whether available contribution is sufficient to cover the broader cost structure.
The break-even point therefore depends not just on sales but also on the relationship between selling price, variable costs, and fixed costs.
A business can sell high-margin products but still fail to break even when overhead is excessive or sales volume is insufficient. Conversely, a lower-margin business can be profitable when it has strong volume and an efficient operating structure.
Gross Margin and Unit Economics
Gross margin can also provide useful context for unit economics.
If a company sells a subscription for $100 and incurs $25 of direct service-delivery cost, the gross margin before broader acquisition or operating expenses is 75%.
However, strong gross margin alone does not prove that the customer relationship is economically attractive. A business that spends heavily on customer acquisition cost may need substantial customer retention or repeat purchasing to recover that investment.
This is why gross margin should be viewed as one layer of economic analysis rather than a complete assessment of business performance.
Gross Margin and Inventory
Retailers, wholesalers, and manufacturers often need to evaluate gross margin together with inventory efficiency.
A high gross margin on products that sell extremely slowly may not produce attractive overall economics. Conversely, a business with somewhat lower margins may generate strong returns when inventory sells rapidly and capital is recycled efficiently.
The inventory turnover ratio helps measure how efficiently inventory moves through the business, while gross margin describes how much revenue remains after the direct cost of those sales.
Using the measurements together can provide a fuller view than either metric alone.
Gross Margin and Asset Efficiency
Gross margin tells you how much gross profit is generated from each dollar of sales, but it does not show how efficiently a company uses its asset base to produce those sales.
That is the role of asset turnover.
Two businesses may have identical gross margins while requiring very different levels of inventory, equipment, property, or working capital. The business using fewer assets to generate the same revenue may have stronger overall capital efficiency even though the gross margin percentages are identical.
Gross Margin and Cash Flow
Gross margin is an income-statement profitability measure, not a cash-flow measure.
A business can report a strong gross margin while experiencing cash pressure because customers have not paid, inventory has increased, capital expenditures are high, or other cash requirements have grown.
For this reason, profitability analysis should eventually be connected with measures such as free cash flow.
For planning purposes, cash flow forecasting can also help distinguish accounting profitability from the timing of actual cash receipts and payments.
Gross Margin and Debt Capacity
Gross margin can indirectly influence a company’s capacity to support its financing structure because stronger operating economics may create more room for operating income and cash generation. It is not, however, a debt-servicing ratio.
Analysts assessing the ability to meet interest payments would look more directly at interest coverage, while the degree to which debt influences the capital structure belongs to financial leverage.
A high gross margin should therefore never be interpreted as proof that a company has low financial risk.
How to Analyze Gross Margin Trends
The percentage becomes particularly useful when tracked consistently across periods.
Imagine a company reports:
Year 1 gross margin: 42%
Year 2 gross margin: 39%
Year 3 gross margin: 35%
Revenue might still be growing, but the declining margin suggests that direct costs are consuming a larger portion of every revenue dollar.
An analyst would then investigate potential causes: supplier prices, labor inputs included in cost of sales, discounts, product mix, freight, manufacturing efficiency, purchasing terms, competitive pricing, accounting classifications, or other relevant operational factors.
By contrast, an improving margin can indicate better pricing, favorable product mix, purchasing efficiencies, lower input costs, or operating improvements at the gross-profit level.
The percentage tells you what changed. Additional analysis is required to determine why it changed.
Percentage Points vs Percent Change
When comparing gross margin percentages, distinguish percentage-point changes from percentage changes.
If gross margin rises from 30% to 35%, it increased by:
5 percentage points
The relative percentage increase in the margin itself is:
(35% − 30%) ÷ 30% × 100 = 16.67%
Financial commentary often uses basis points for smaller changes.
Because 100 basis points equal one percentage point, a gross margin increase from 35.0% to 36.5% is an increase of:
150 basis points
Using the correct terminology prevents material misinterpretation.
Common Gross Margin Mistakes
One common error is dividing gross profit by cost rather than revenue. That calculation produces markup, not gross margin.
Another is treating gross margin as final profitability. Gross margin excludes many expenses that can significantly change the economic result.
Comparisons can also become misleading when businesses classify expenses differently. A cost included in cost of revenue by one company might appear elsewhere in another company’s income statement. Comparisons therefore work best when accounting definitions and business models are reasonably consistent.
Adjusted gross margin requires additional caution. A company may present an adjusted figure that excludes particular costs from its reported measure. When analyzing public-company disclosures, identify exactly how the adjusted calculation differs from the reported figure rather than assuming every measure labeled “gross margin” is calculated identically.
Finally, avoid evaluating gross margin without context. Product mix, industry structure, sales channel, geography, discounts, inflation, foreign exchange, and production efficiency can all influence the result.
Why Gross Margin Matters
Gross margin compresses two fundamental business variables—selling economics and direct cost structure—into a percentage that can be compared over time.
It can help answer questions such as:
Is the company retaining more or less from each dollar of sales?
Are direct costs rising faster than revenue?
Are price increases offsetting higher input costs?
Is product mix moving toward higher- or lower-margin offerings?
Does the business have enough gross profit capacity to support its operating structure?
Those questions make gross margin useful for managers, owners, analysts, investors, and anyone trying to understand the basic economics between sales and the cost of producing them.
However, the metric remains only one part of the financial picture. A complete evaluation should connect gross margin with operating profitability, cash generation, working capital, capital requirements, and financing obligations.
Frequently Asked Questions
What is gross margin in simple terms?
Gross margin is the percentage of revenue left after subtracting the direct cost of the goods or services sold. A 40% gross margin means 40 cents of every revenue dollar remains after those direct costs.
What is the formula for gross margin?
The standard formula is:
Gross Margin = (Revenue − Cost of Goods Sold) ÷ Revenue × 100
Because revenue minus cost of goods sold equals gross profit, you can also divide gross profit by revenue and multiply by 100.
Is gross margin the same as gross profit?
No. Gross profit is normally a dollar amount, while gross margin expresses gross profit as a percentage of revenue.
If gross profit is $200,000 on $500,000 of revenue, gross margin is 40%.
Is a higher gross margin always better?
Not automatically. A higher gross margin generally means more revenue remains after direct costs, but it does not account for sales volume, operating expenses, capital requirements, competitive conditions, or cash flow.
A lower-margin company can still generate strong overall returns under the right business model.
Can gross margin be negative?
Yes. Gross margin becomes negative when cost of goods sold exceeds revenue.
If revenue is $100,000 and COGS is $120,000:
Gross Margin = ($100,000 − $120,000) ÷ $100,000 = −20%
That means the business is losing money at the gross-profit level before considering additional operating expenses.
What does a 50% gross margin mean?
A 50% gross margin means half of revenue remains after the direct costs included in COGS are deducted.
For every $100 of revenue, approximately $50 represents gross profit and $50 represents cost of goods sold.
How do you calculate selling price from a target gross margin?
Use:
Selling Price = Cost ÷ (1 − Target Gross Margin)
If cost is $30 and the desired margin is 40%:
$30 ÷ 0.60 = $50
A $50 selling price therefore produces a 40% gross margin.
Why can gross margin increase while gross profit falls?
Gross margin is a percentage, while gross profit is an absolute dollar amount.
If revenue falls sharply but the remaining sales have better margins, the gross margin percentage can rise even though total gross profit dollars decline.
Why can gross profit rise while gross margin falls?
The reverse can also occur. Revenue and gross profit dollars may grow while direct costs rise faster than revenue.
For example, a company can increase gross profit from $1 million to $1.2 million while its gross margin falls from 40% to 35% because its overall revenue base and cost structure have changed.
What causes gross margin to decrease?
Common causes include higher input costs, heavier discounting, unfavorable product mix, pricing pressure, production inefficiency, increased fulfillment costs, or changes in how costs are classified.
The calculation identifies the change in profitability; operational analysis is required to establish the underlying cause.
Should gross margin include fixed costs?
It depends on how the company’s accounting system classifies those costs.
Some fixed production-related costs may be included in cost of goods sold, while corporate overhead and many other fixed expenses normally appear elsewhere. This is why analysts should use the company’s actual cost classifications rather than assuming every fixed cost belongs outside gross margin.
What is the difference between gross margin and net margin?
Gross margin measures revenue remaining after cost of goods sold. Net margin reflects final net profit after the broader set of expenses recognized by the business.
As a result, net margin is usually substantially lower than gross margin.




