


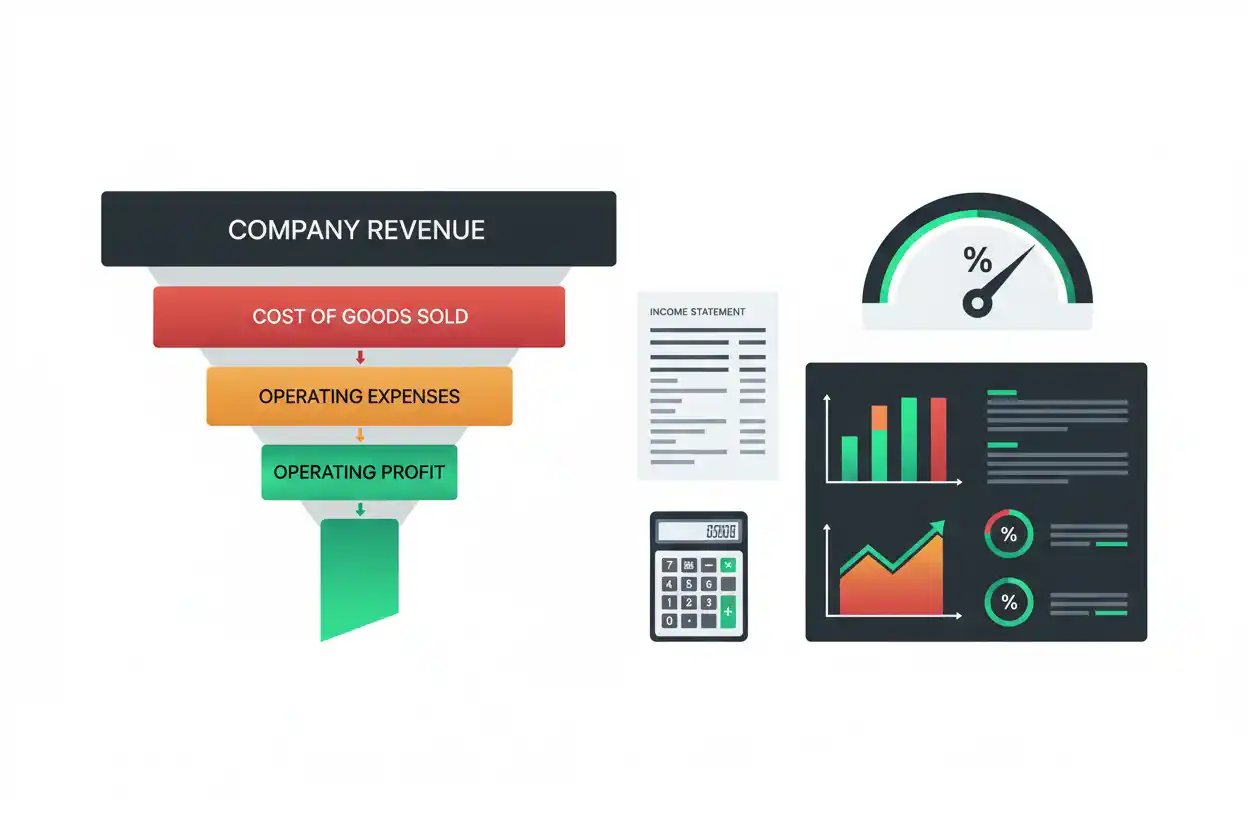
Operating margin measures how much operating profit a business generates from each dollar of revenue after accounting for the operating costs included in its operating-income calculation. It expresses operating profitability as a percentage, making it easier to compare performance across periods or businesses of different sizes.
If a company generates $2 million in revenue and $300,000 in operating profit:
Operating Margin = $300,000 ÷ $2,000,000 × 100
Operating Margin = 15%
A 15% operating margin means the company generates $0.15 of operating profit for every $1.00 of revenue before items excluded from operating income under the applicable financial-statement presentation.
Operating margin is a core measure in business finance because it shows how efficiently revenue becomes operating earnings after product costs and operating expenses.
What Is Operating Margin?
Operating margin is the percentage of revenue represented by operating profit or operating income.
The standard formula is:
Operating Margin = Operating Profit ÷ Revenue × 100
Suppose a business has:
Revenue = $1,000,000
Operating profit = $120,000
Then:
Operating Margin = $120,000 ÷ $1,000,000 × 100
Operating Margin = 12%
That means 12 cents of every revenue dollar remains as operating profit under the company’s reported operating-cost structure.
The metric sits between gross profitability and final net profitability. It considers more costs than gross margin but normally stops before the complete set of items that ultimately determines net profit.
Operating Margin Formula
The primary formula is:
Operating Margin = Operating Income ÷ Revenue × 100
When operating profit is not already given, a simplified operating-income calculation can be built from revenue and operating costs:
Operating Profit = Revenue − Cost of Goods Sold − Operating Expenses
Then:
Operating Margin = (Revenue − Cost of Goods Sold − Operating Expenses) ÷ Revenue × 100
Real income statements can contain classifications that make the calculation more detailed, so the company’s reported operating-income subtotal should be used when available.
The dedicated operating profit page owns that dollar-based earnings calculation, while this page focuses on operating profit as a percentage of revenue.
How to Calculate Operating Margin
Suppose a company reports:
Revenue = $5,000,000
Cost of goods sold = $2,800,000
Operating expenses = $1,300,000
First calculate operating profit:
Operating Profit = $5,000,000 − $2,800,000 − $1,300,000
Operating Profit = $900,000
Then divide operating profit by revenue:
Operating Margin = $900,000 ÷ $5,000,000 × 100
Operating Margin = 18%
The company’s operating margin is 18%.
In practical terms, the business generates $0.18 of operating profit from every $1.00 of revenue.
Operating Margin Example
Consider a retailer with:
Net sales = $2,500,000
Cost of goods sold = $1,500,000
Selling and administrative expenses = $700,000
Gross profit is:
Gross Profit = $2,500,000 − $1,500,000
Gross Profit = $1,000,000
Operating profit is:
Operating Profit = $1,000,000 − $700,000
Operating Profit = $300,000
Operating margin is:
Operating Margin = $300,000 ÷ $2,500,000 × 100
Operating Margin = 12%
The company converts 12% of its sales into operating profit.
This does not mean its final net profit margin is also 12%. Interest, taxes, and other applicable items can still affect bottom-line earnings.
What Does a 20% Operating Margin Mean?
A 20% operating margin means operating profit equals 20% of revenue.
If revenue is $100:
Operating Profit = $20
If revenue is $1 million:
Operating Profit = $200,000
If revenue is $50 million:
Operating Profit = $10 million
assuming the same margin applies.
The remaining 80% of revenue has been absorbed by the costs recognized before arriving at operating profit.
Operating margin therefore provides an intuitive way to understand how much operating earnings remain from each sales dollar.
What Does a 10% Operating Margin Mean?
Suppose:
Revenue = $4,000,000
Operating profit = $400,000
Then:
Operating Margin = $400,000 ÷ $4,000,000 × 100
Operating Margin = 10%
For every $1.00 of revenue, approximately $0.10 remains as operating profit.
That percentage can then be compared with prior years, similar companies, internal targets, and other profitability levels to understand whether operating economics are improving or deteriorating.
What Is a Good Operating Margin?
There is no universal operating margin that is good for every business.
Margins vary substantially by industry, business model, competitive intensity, scale, pricing power, labor requirements, capital intensity, product mix, geographic exposure, and accounting classification.
A high-volume retailer can operate successfully with a much thinner operating margin than a business selling specialized software or intellectual property.
Similarly, a rapidly expanding company may intentionally spend heavily on sales, marketing, research, infrastructure, or new locations, reducing current operating margin while pursuing future growth.
The most meaningful comparisons generally involve:
the same company over time;
businesses with similar economics;
relevant industry peers; and
the company’s own strategic and financial targets.
A percentage should be interpreted in context rather than compared with one universal benchmark.
Is a Higher Operating Margin Better?
All else equal, a higher operating margin indicates that a greater proportion of revenue remains as operating profit.
However, the source of the improvement matters.
A company can increase operating margin through stronger pricing, lower product costs, greater efficiency, economies of scale, better product mix, or tighter expense control.
It can also increase margin temporarily by cutting spending that supports long-term performance.
For example, reducing maintenance, research, employee training, or customer service may improve today’s margin but damage future economics.
Therefore, a higher operating margin is generally favorable when the improvement is sustainable and does not rely on economically harmful underinvestment.
What Does a Low Operating Margin Mean?
A low operating margin means only a small portion of revenue remains after the costs included before operating profit.
Suppose:
Revenue = $10 million
Operating profit = $300,000
Then:
Operating Margin = $300,000 ÷ $10,000,000 × 100
Operating Margin = 3%
Only three cents of each sales dollar becomes operating profit.
That may be entirely normal for the industry.
Alternatively, it can result from weak pricing, high product costs, excessive overhead, inefficient operations, poor product mix, underutilized capacity, or intense competition.
The ratio identifies the outcome. Additional analysis identifies the cause.
Can Operating Margin Be Negative?
Yes.
When operating expenses and other costs included before operating income exceed revenue, operating profit becomes negative.
Suppose:
Revenue = $1,000,000
Operating loss = −$150,000
Then:
Operating Margin = −$150,000 ÷ $1,000,000 × 100
Operating Margin = −15%
A −15% operating margin means the company lost approximately $0.15 at the operating-profit level for every $1.00 of revenue.
Negative margins can occur in startups, cyclical businesses, restructuring periods, rapidly expanding companies, or businesses with fundamentally weak operating economics.
The reason and expected duration matter more than the negative sign alone.
Operating Margin vs Gross Margin
Gross margin measures profitability before broader operating expenses.
Its formula is:
Gross Margin = Gross Profit ÷ Revenue × 100
Operating margin is:
Operating Margin = Operating Profit ÷ Revenue × 100
Suppose:
Revenue = $1,000,000
Gross profit = $500,000
Operating profit = $150,000
Gross margin:
$500,000 ÷ $1,000,000 = 50%
Operating margin:
$150,000 ÷ $1,000,000 = 15%
The 35-percentage-point difference reflects the operating expenses recognized between gross profit and operating profit in this simplified example.
Gross margin tells you about economics after the cost of goods sold.
Operating margin incorporates a broader portion of the cost structure.
Operating Margin vs Gross Profit
Gross profit is an absolute dollar subtotal rather than a percentage.
Suppose:
Revenue = $4 million
Gross profit = $2 million
Operating profit = $800,000
The company has $2 million of gross profit.
Its operating margin is:
$800,000 ÷ $4,000,000 = 20%
Gross profit tells you how many dollars remain after direct cost of sales.
Operating margin tells you what proportion of sales remains after the broader operating expense structure.
The metrics therefore answer different questions.
Operating Margin vs Net Profit Margin
Net profit margin measures final net profit relative to revenue.
Operating margin stops at operating profit.
Suppose:
Revenue = $10 million
Operating profit = $1.5 million
Net profit = $900,000
Operating margin:
$1.5 million ÷ $10 million = 15%
Net profit margin:
$900,000 ÷ $10 million = 9%
The six-percentage-point difference can reflect interest expense, taxes, non-operating items, and other amounts recognized below operating income.
Operating margin therefore offers a cleaner view of operating profitability than the final bottom line when financing and tax structures differ substantially.
Operating Margin vs Net Profit
Net profit is the final dollar earnings amount after the broader set of recognized expenses and other applicable income-statement items.
Operating margin is an operating profitability percentage.
A company could report:
Operating margin = 20%
Net profit = $5 million
Another could report:
Operating margin = 10%
Net profit = $20 million
The second company earns more final profit dollars because it may be much larger despite operating at a lower percentage margin.
Absolute earnings and margin efficiency should therefore be analyzed separately.
Operating Margin vs EBIT Margin
EBIT means earnings before interest and taxes.
In some companies and analytical contexts, EBIT and operating income can be very close or identical.
In others, non-operating income, non-operating expenses, restructuring classifications, or other presentation differences can cause them to diverge.
A common EBIT margin calculation is:
EBIT Margin = EBIT ÷ Revenue × 100
Operating margin is:
Operating Margin = Operating Income ÷ Revenue × 100
Before assuming the percentages are identical, inspect the company’s income statement and definitions.
Operating Margin vs EBITDA Margin
EBITDA excludes depreciation and amortization in addition to interest and taxes under its standard construction.
Therefore, EBITDA margin will generally differ from operating margin when material depreciation or amortization is recognized in operating expenses.
Suppose:
Revenue = $5 million
EBITDA = $1.5 million
Operating profit = $1 million
EBITDA margin:
$1.5 million ÷ $5 million = 30%
Operating margin:
$1 million ÷ $5 million = 20%
The ten-percentage-point gap represents depreciation, amortization, or other differences between the chosen earnings measures in this simplified example.
An EBITDA margin should never be relabeled as operating margin without checking the numerator.
Operating Margin and Revenue
Revenue is the denominator of the operating-margin calculation.
Revenue growth therefore does not automatically improve operating margin.
Suppose:
Year 1 revenue = $5 million
Operating profit = $750,000
Operating Margin = 15%
Year 2 revenue = $6 million
Operating profit = $780,000
Operating Margin = 13%
Revenue increased by 20%, and operating profit also increased in dollars.
Yet operating margin fell by two percentage points because operating profit grew much more slowly than revenue.
Growth and margin expansion are not the same thing.
Operating Margin Expansion
Operating margin expands when operating profit grows faster than revenue.
Suppose:
Year 1 revenue = $10 million
Operating profit = $1 million
Operating Margin = 10%
Year 2 revenue = $12 million
Operating profit = $1.8 million
Operating Margin = 15%
Revenue increased 20%.
Operating profit increased 80%.
The operating margin expanded from 10% to 15%.
This can occur when fixed costs are spread across more sales, gross margin improves, pricing rises, operating efficiency improves, or the business shifts toward more profitable products.
Operating Margin Contraction
Operating margin contracts when operating profit grows more slowly than revenue or falls faster than revenue.
Suppose:
Year 1 revenue = $8 million
Operating profit = $1.2 million
Operating Margin = 15%
Year 2 revenue = $9 million
Operating profit = $900,000
Operating Margin = 10%
Revenue increased, but operating profit fell.
The five-percentage-point decline indicates that costs consumed a larger percentage of revenue.
Possible causes include lower gross margin, wage inflation, higher marketing expense, expansion costs, inefficient capacity, lower pricing, or unfavorable product mix.
Operating Margin and Operating Leverage
The workbook maps operating leverage directly to this page because operating leverage can help explain margin expansion and contraction.
A company with substantial fixed costs may generate operating profit growth much faster than revenue when sales rise.
For example:
Revenue increases 20%.
Operating profit increases 60%.
Operating margin will normally expand because profit is growing faster than the revenue denominator.
The reverse occurs during a downturn. Fixed operating costs can cause operating profit to fall much faster than sales, compressing margins sharply.
Operating margin shows the profitability outcome.
Operating leverage helps explain the sensitivity that produced it.
Operating Margin and Fixed Costs
Fixed costs can create substantial operating-margin sensitivity.
Suppose a company has:
Revenue = $2 million
Variable and product-related costs = $1 million
Fixed operating expenses = $700,000
Operating profit:
$2 million − $1 million − $700,000 = $300,000
Operating margin:
$300,000 ÷ $2 million = 15%
If revenue grows while fixed costs remain near $700,000, more incremental contribution can flow into operating profit.
However, fixed costs remain fixed only over a relevant range. Continued growth may eventually require additional employees, facilities, equipment, or infrastructure.
Operating Margin and Variable Costs
Variable costs change more directly with activity.
If variable cost per dollar of revenue remains constant, higher sales alone may not improve the portion of margin attributable to those costs.
Suppose revenue rises 20%, but variable costs also rise exactly 20%.
The incremental profitability benefit will depend largely on what happens to fixed costs and other expenses.
If variable costs rise faster than sales, operating margin can contract even when fixed expenses remain controlled.
Changes in supplier prices, labor efficiency, freight, commissions, transaction costs, and product mix can all alter variable-cost economics.
Operating Margin and Contribution Margin
Contribution margin measures revenue remaining after variable costs.
Operating profit then subtracts fixed operating costs from that contribution.
A simplified relationship is:
Operating Profit = Contribution Margin − Fixed Operating Costs
Therefore, improvement in contribution margin can support a higher operating margin when fixed costs do not rise enough to offset the benefit.
Suppose revenue is $1 million and contribution margin is $500,000.
If fixed costs are $350,000:
Operating Profit = $150,000
Operating Margin = 15%
If contribution margin improves to $550,000 with the same revenue and fixed costs:
Operating Profit = $200,000
Operating Margin = 20%
The five-percentage-point improvement originates from stronger contribution economics.
Operating Margin and Break-Even
Break-even analysis helps explain why operating margin often improves as a company moves farther above its break-even level.
At operating break-even:
Operating Profit = $0
Therefore:
Operating Margin = 0%
Once contribution exceeds fixed operating costs, operating profit becomes positive.
As sales continue to rise without proportional increases in fixed costs, the operating margin can expand.
However, if additional growth requires new fixed capacity, that expansion may pause or reverse.
Operating Margin and Pricing
Price changes can have a powerful effect on operating margin when sales volume remains reasonably stable.
Suppose a company sells 100,000 units for $20 each.
Revenue:
100,000 × $20 = $2,000,000
Assume operating profit is $200,000.
Operating margin:
10%
If price rises to $21 and unit volume and costs remain unchanged:
New revenue:
100,000 × $21 = $2,100,000
The extra $100,000 can increase operating profit to approximately $300,000 under the simplified assumptions.
New operating margin:
$300,000 ÷ $2,100,000 ≈ 14.29%
A 5% price increase therefore produces a much larger margin improvement in this example.
Real demand can change when prices rise, so pricing analysis must also consider volume effects.
Operating Margin and Markup
Markup measures how much a selling price exceeds a defined cost as a percentage of cost.
Operating margin measures operating profit as a percentage of revenue.
A product can carry a large markup while the business has a modest operating margin because sales, administrative, marketing, research, facility, and other operating expenses consume a large portion of gross profit.
Markup belongs primarily to pricing.
Operating margin belongs to company-level operating profitability.
Operating Margin and Cost-Plus Pricing
Cost-plus pricing can help establish a selling price from cost, but the resulting markup does not guarantee a particular operating margin.
Suppose a product costs $50 and is sold for $75.
The price may appear attractive relative to product cost.
However, the business still has to fund payroll, marketing, rent, software, distribution, customer support, and other operating expenses.
Operating margin therefore tests whether the price-and-volume combination supports the broader operating cost structure.
Operating Margin and Asset Turnover
Asset turnover measures how effectively assets generate revenue.
Operating margin measures operating profit relative to that revenue.
Two companies can therefore follow different economic models.
Company A may generate high margins but relatively little revenue per dollar of assets.
Company B may operate with thin margins while turning its asset base rapidly.
Neither margin nor turnover alone determines overall capital efficiency.
The interaction becomes particularly important when evaluating asset-heavy businesses.
Operating Margin and Return on Assets
Return on assets places earnings in relation to the asset base.
Suppose two businesses each have a 15% operating margin.
Company A needs $100 million of assets to produce $100 million of annual revenue.
Company B needs only $25 million of assets to produce the same revenue.
Their operating margins are identical, but their asset efficiency is dramatically different.
Margin analysis therefore becomes more informative when capital requirements are considered as well.
Operating Margin and Return on Invested Capital
Return on invested capital goes further by relating operating performance to the capital invested in the business under its applicable formula.
A company can report an attractive operating margin while producing mediocre capital returns if enormous investment is required to support that revenue.
Conversely, a business with a somewhat lower operating margin may create strong returns if it operates with very little invested capital.
Operating margin measures profit relative to sales.
ROIC introduces the capital required to generate those sales.
Operating Margin vs Operating Cash Flow
The workbook maps operating cash flow as a neighboring concept, but cash flow and operating margin should remain distinct.
Operating margin uses accrual-accounting operating profit.
Operating cash flow measures cash generated or used by operations.
A company may report strong operating margin while receivables and inventory consume substantial cash.
Another company can have modest operating profit but strong cash generation because it collects customers quickly and benefits from favorable supplier terms.
Profitability and cash conversion therefore need separate analysis.
Operating Cash Flow Margin Is Different
Operating cash flow itself can be expressed relative to revenue:
Operating Cash Flow Margin = Operating Cash Flow ÷ Revenue × 100
Suppose:
Revenue = $10 million
Operating cash flow = $2 million
Then:
Operating Cash Flow Margin = 20%
If operating profit is only $1.5 million:
Operating Margin = 15%
The company therefore has a 15% operating margin and 20% operating cash-flow margin.
Those numbers use different numerators and should not be interchanged.
Operating Margin and Free Cash Flow
Free cash flow introduces capital expenditure into the cash analysis under a common simplified formula.
A company can report a strong operating margin while requiring substantial capital spending.
For example:
Revenue = $20 million
Operating margin = 20%
Operating profit = $4 million
If the business must continually invest heavily in factories, stores, equipment, or infrastructure, the amount of free cash ultimately available can be much smaller than the operating-margin percentage suggests.
Operating profitability is therefore only one layer of financial performance.
Operating Margin and Working Capital
Working capital can create another difference between operating profitability and cash generation.
A fast-growing business may report higher operating margin while simultaneously building inventory and receivables.
Those assets can consume cash even though reported operating profit improves.
Operating margin therefore does not measure how quickly profits convert into cash.
That question belongs to cash-flow and working-capital analysis.
Operating Margin and Payback Period
The workbook maps payback period because an investment can improve operating margin without necessarily repaying its initial cost quickly.
Suppose a new automated system reduces operating costs enough to improve margin from 12% to 16%.
That improvement may be economically attractive.
However, if the equipment costs $20 million, management still needs to evaluate how long the resulting cash benefits take to recover the initial investment.
Operating margin evaluates ongoing profitability.
Payback evaluates capital-recovery time.
Operating Margin and NFT Profit
The workbook also maps NFT profit as a specialist sibling.
NFT Profit measures transaction economics after acquisition price, marketplace costs, royalties, and other directly relevant transaction expenses.
Operating margin applies at the broader business level.
An NFT marketplace or digital-asset company could generate profitable individual transactions while reporting a negative operating margin because payroll, development, marketing, legal, infrastructure, and administrative costs exceed the resulting gross profit.
Transaction profitability does not automatically translate into company-wide operating profitability.
Operating Margin and Business Scale
Operating margin allows companies of different sizes to be compared more easily than operating-profit dollars alone.
Suppose:
Company A revenue = $10 million
Operating profit = $2 million
Operating Margin = 20%
Company B revenue = $1 billion
Operating profit = $100 million
Operating Margin = 10%
Company B generates much more operating profit in absolute dollars.
Company A converts twice as much of each revenue dollar into operating profit.
Neither fact alone determines which business is economically superior.
Size, growth, durability, risk, asset requirements, and capital returns also matter.
Operating Margin Trend Analysis
A company’s margin trend can reveal more than one isolated percentage.
Suppose operating margin changes as follows:
Year 1: 8%
Year 2: 10%
Year 3: 12%
Year 4: 15%
The business is progressively converting more revenue into operating earnings.
Possible reasons include stronger gross margin, scale, automation, better pricing, improved product mix, or operating-cost control.
Now consider:
Year 1: 18%
Year 2: 16%
Year 3: 13%
Year 4: 9%
The downward trend deserves investigation.
Possible causes include competition, discounting, input inflation, wage pressure, new investments, lower utilization, or a less profitable sales mix.
The trend tells you what changed.
The income statement helps reveal why.
Percentage Points vs Percentage Change
When discussing margins, percentage points and percentage change should be distinguished.
Suppose operating margin rises from 10% to 12%.
The increase is:
12% − 10% = 2 Percentage Points
The relative percentage increase is:
(12% − 10%) ÷ 10% × 100 = 20%
Saying margin “increased 2%” can therefore be ambiguous.
For direct comparisons between margin percentages, percentage points usually provide clearer language.
Basis Points and Operating Margin
Operating-margin changes are also frequently expressed in basis points.
One percentage point equals 100 basis points.
If margin rises from 14.2% to 15.0%:
15.0% − 14.2% = 0.8 Percentage Points
or:
80 Basis Points
If margin falls from 20.0% to 18.5%:
Decline = 1.5 Percentage Points
or:
150 Basis Points
Basis points are particularly useful when discussing relatively small margin movements.
Operating Margin by Segment
A company can have multiple business segments with very different operating margins.
Suppose:
Segment A revenue = $5 million
Segment A operating profit = $1 million
Segment A Margin = 20%
Segment B revenue = $5 million
Segment B operating profit = $250,000
Segment B Margin = 5%
The combined company margin is not simply useful as a replacement for understanding these segment economics.
Segment-level analysis can reveal which products, geographies, or divisions generate the strongest operating profitability.
However, corporate overhead and intersegment allocations can complicate comparisons.
Why Product Mix Affects Operating Margin
Suppose a business sells two products.
Product A generates high contribution per sales dollar.
Product B generates much lower contribution.
If sales shift toward Product A, operating margin can improve even if total revenue remains unchanged.
If growth comes mainly from Product B, revenue can rise while operating margin falls.
Therefore, revenue growth should be analyzed alongside mix.
The composition of sales can matter almost as much as the amount.
Why Inflation Can Reduce Operating Margin
Input inflation can compress operating margin when costs rise faster than selling prices.
Suppose:
Revenue = $10 million
Operating costs = $8 million
Operating profit:
$2 million
Operating margin:
20%
Now costs rise to $8.8 million while revenue remains $10 million:
Operating Profit = $1.2 million
Operating Margin = 12%
The margin falls eight percentage points.
A business may attempt to offset this through price increases, purchasing improvements, efficiency gains, product mix, or cost reductions.
The outcome depends on how quickly revenue can adjust relative to costs.
Why Scale Can Improve Operating Margin
Scale can improve operating margin when additional revenue does not require a proportional increase in operating expenses.
Suppose:
Year 1 revenue = $5 million
Operating costs = $4.5 million
Operating profit = $500,000
Operating margin = 10%
Year 2 revenue = $7 million.
If operating costs rise only to $5.95 million:
Operating Profit = $1.05 million
Operating Margin = $1.05 million ÷ $7 million
Operating Margin = 15%
The business becomes more profitable per revenue dollar because costs rise more slowly than sales.
This is favorable operating leverage in practice.
Why Scale Can Reduce Operating Margin
Growth can also reduce margin.
A company may enter lower-margin markets, hire ahead of revenue, open facilities, increase marketing, lower prices, or accept less-profitable customers.
Suppose revenue rises 30% but operating expenses rise 45%.
Operating profit may grow slowly or decline.
The correct conclusion is therefore not that growth automatically creates scale efficiencies.
Scale helps only when the economics of additional revenue are favorable.
Adjusted Operating Margin
Companies sometimes present an adjusted operating margin in addition to the operating margin derived from GAAP financial statements.
Conceptually:
Adjusted Operating Margin = Adjusted Operating Income ÷ Revenue × 100
The adjusted numerator may exclude items selected by management.
Such a measure can provide useful supplementary context, but it is not automatically equivalent to reported GAAP operating margin.
When analyzing an adjusted margin, identify:
what was excluded;
why it was excluded;
whether similar adjustments recur;
whether the revenue denominator was also adjusted; and
whether the calculation is comparable across periods.
A consistently labeled reconciliation is more useful than an adjusted percentage presented without explanation.
GAAP vs Non-GAAP Operating Margin
A company may disclose both GAAP and non-GAAP operating margin.
Suppose:
GAAP operating income = $100 million
Revenue = $1 billion
GAAP Operating Margin = 10%
Adjusted operating income = $150 million
Adjusted Operating Margin = 15%
The five-percentage-point difference comes from whatever adjustments management made to operating income.
That does not automatically make the adjusted metric wrong.
It does mean readers need to inspect the reconciliation before treating the 15% figure as comparable with another company’s GAAP operating margin.
Comparing Operating Margins Between Companies
Operating margin can be useful for peer comparison because the metric normalizes operating profit by revenue.
However, businesses should be reasonably comparable.
Differences can arise from:
industry structure;
product mix;
business model;
geographic exposure;
labor intensity;
asset ownership versus leasing;
accounting classification;
acquisition activity;
stock-based compensation;
restructuring;
and corporate cost allocation.
Comparing a software platform with a supermarket solely because both report an operating-margin percentage is unlikely to produce useful insight.
Peer selection matters.
Operating Margin and Seasonality
Seasonal businesses can report substantially different operating margins across quarters.
A retailer may earn most of its annual operating profit during a holiday period.
A tourism business may generate most of its earnings during peak travel months.
A manufacturer can experience temporary underutilization during seasonal slowdowns.
Therefore, comparing one strong quarter with one weak quarter without accounting for seasonality can be misleading.
Year-over-year comparisons for the same seasonal period and trailing annual results often provide better context.
Common Operating Margin Mistakes
One common mistake is dividing revenue by operating profit rather than operating profit by revenue.
Another is confusing gross margin with operating margin.
A third is treating EBITDA margin as though it were operating margin.
Analysts can also compare adjusted operating margin from one company with GAAP operating margin from another without checking the adjustment definitions.
Another error is assuming margin expansion automatically means the underlying business improved sustainably. Expense timing and temporary cost reductions can affect the percentage.
Finally, a strong operating margin does not automatically mean strong cash flow, high investment returns, low leverage, or attractive valuation.
The ratio answers one specific profitability question.
Limitations of Operating Margin
Operating margin is useful because it standardizes operating earnings relative to revenue, but it does not describe the complete business.
It does not directly measure cash flow.
It does not show the amount of capital required to generate sales.
It can be affected by accounting classifications.
It can exclude financing and tax burdens that ultimately matter to shareholders.
It can be influenced by temporary expense reductions or unusual charges.
Different industries can have fundamentally different normal margin structures.
It can also hide differences between high-margin and low-margin business segments.
For these reasons, operating margin should be considered alongside gross profitability, net profitability, cash flow, asset efficiency, and capital-return measures.
How to Analyze Operating Margin Properly
Start with the reported operating income and revenue figures.
Calculate:
Operating Margin = Operating Income ÷ Revenue × 100
Then compare the result with prior periods.
Next, examine gross margin to determine whether product economics improved or deteriorated.
Review operating expenses to understand what happened between gross profit and operating income.
Check revenue growth to see whether operating profit is expanding faster or slower than sales.
Compare operating margin with net profit margin to identify the effect of items below operating income.
Then examine operating cash flow to determine whether operating earnings are converting into cash.
Finally, consider asset and capital efficiency so a high margin is not mistaken for a high return on investment automatically.
Why Operating Margin Matters
Operating margin shows how effectively a business converts revenue into operating profit after accounting for the costs required to run its operations.
Its central formula is:
Operating Margin = Operating Profit ÷ Revenue × 100
A rising operating margin generally means operating profit is growing faster than revenue or declining more slowly than revenue.
A falling margin means operating costs are consuming a greater proportion of sales.
Yet the percentage should never be interpreted without context.
Industry economics matter.
Product mix matters.
Pricing matters.
Fixed and variable costs matter.
Scale matters.
Accounting classifications matter.
Operating margin becomes most useful when the percentage is traced back to the revenue and expenses that created it.
Frequently Asked Questions
What is operating margin in simple terms?
Operating margin is the percentage of revenue that remains as operating profit after the operating costs included before operating income are deducted.
What is the operating margin formula?
The standard formula is:
Operating Margin = Operating Profit ÷ Revenue × 100
If operating profit is $200,000 and revenue is $1 million, operating margin is 20%.
What does a 15% operating margin mean?
A 15% operating margin means the company generates approximately $0.15 of operating profit for every $1.00 of revenue.
Is a higher operating margin better?
A higher margin generally indicates stronger operating profitability per revenue dollar, but the source and sustainability of the improvement matter.
What is a good operating margin?
There is no universal good operating margin. Appropriate levels vary substantially by industry, business model, scale, cost structure, competitive environment, and growth strategy.
Can operating margin be negative?
Yes. If operating costs exceed revenue and the company reports an operating loss, operating margin becomes negative.
What is the difference between gross margin and operating margin?
Gross margin subtracts cost of goods sold or cost of revenue before comparing gross profit with revenue. Operating margin also incorporates the operating expenses recognized before operating income.
What is the difference between operating margin and net profit margin?
Operating margin uses operating profit. Net profit margin uses final net profit after the broader set of financing, tax, and other applicable items.
Is operating margin the same as EBIT margin?
Not always. EBIT and operating income can be similar or identical in some financial statements, but non-operating classifications can create differences. Check the company’s definitions before treating them as interchangeable.
Why does operating margin increase?
Operating margin can rise because of higher pricing, improved gross margin, lower operating expenses relative to sales, better product mix, efficiency gains, or favorable operating leverage.
Can revenue increase while operating margin falls?
Yes. If operating costs rise faster than revenue, the company can grow sales while its operating margin contracts.
Is operating margin the same as operating cash flow margin?
No. Operating margin uses operating profit as the numerator. Operating cash flow margin uses cash from operating activities. Accrual earnings and cash flow can differ materially.




