


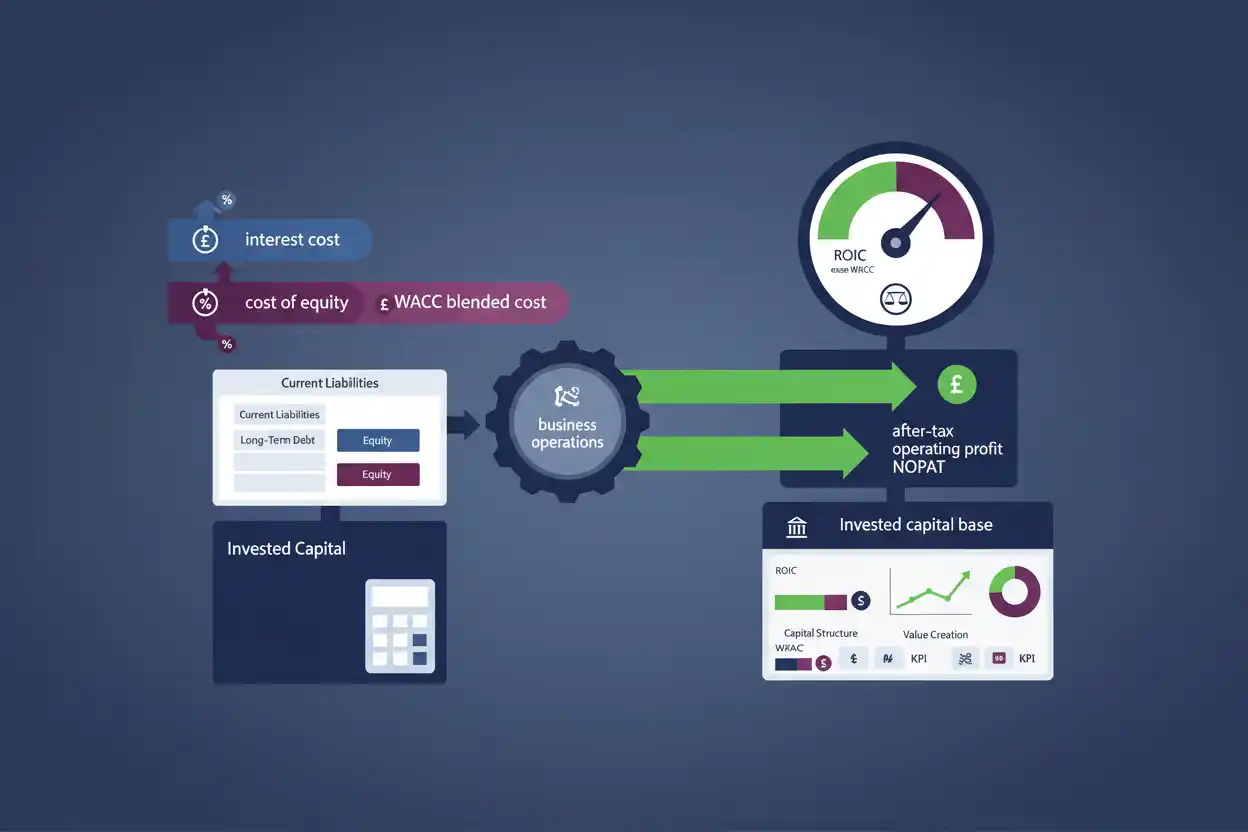
Return on invested capital measures how effectively a business generates after-tax operating profit from the capital invested in its operations. It is commonly abbreviated ROIC.
A common formula is:
ROIC = NOPAT ÷ Average Invested Capital × 100
Suppose a company generates $840,000 of net operating profit after tax and has average invested capital of $4.2 million.
ROIC = $840,000 ÷ $4,200,000 × 100
ROIC = 20%
A 20% return on invested capital means the business generated after-tax operating profit equal to 20% of the average capital included in its ROIC denominator.
ROIC is particularly useful because it connects operating profitability with capital efficiency. A company can grow revenue and profit while still creating weak economics if that growth requires disproportionately large amounts of new capital.
Within business finance, ROIC therefore helps answer a more demanding question than whether a company is simply profitable:
How effectively does the operating business convert invested capital into after-tax operating earnings?
What Is Return on Invested Capital?
Return on invested capital evaluates operating earnings relative to the capital committed to generating those earnings.
A common formulation is:
Return on Invested Capital = NOPAT ÷ Average Invested Capital × 100
Where:
NOPAT means net operating profit after tax.
Invested capital represents the debt and equity capital committed to the operating business under the chosen methodology, often adjusted for items such as excess cash or non-operating assets.
ROIC tries to separate the economics of business operations from the company’s particular financing mix.
That is why the numerator generally begins with operating earnings rather than net income.
The denominator also includes more than shareholder equity because operating assets can be financed with both debt and equity capital.
Return on Invested Capital Formula
The core formula is:
ROIC = NOPAT ÷ Average Invested Capital × 100
A simplified NOPAT calculation is:
NOPAT = Operating Profit × (1 − Tax Rate)
or, when EBIT represents the appropriate operating earnings measure:
NOPAT = EBIT × (1 − Tax Rate)
Invested capital can be constructed in several ways.
A common financing-side version is:
Invested Capital = Shareholders’ Equity + Interest-Bearing Debt − Excess Cash and Cash Equivalents
Another operating-side framework is conceptually:
Invested Capital = Operating Assets − Operating Liabilities
Companies and analysts can make further adjustments.
Therefore, ROIC is not one universally standardized accounting ratio. The exact numerator and denominator should be identified before comparing results.
How to Calculate ROIC
Suppose a company reports:
Operating profit = $1,200,000
Applicable tax rate for the simplified calculation = 30%
Beginning invested capital = $4,000,000
Ending invested capital = $4,400,000
First calculate NOPAT:
NOPAT = $1,200,000 × (1 − 0.30)
NOPAT = $840,000
Next calculate average invested capital:
Average Invested Capital = ($4,000,000 + $4,400,000) ÷ 2
Average Invested Capital = $4,200,000
Now calculate ROIC:
ROIC = $840,000 ÷ $4,200,000 × 100
ROIC = 20%
The company therefore generates a 20% after-tax operating return on average invested capital under these assumptions.
Why Use NOPAT?
NOPAT focuses on after-tax operating profitability.
It starts from the earnings generated by business operations before financing costs and then recognizes an estimated tax burden on those operating earnings.
This is different from net profit, which includes the effects of financing and other items that occur below operating income.
Suppose two businesses have identical operations.
Company A uses little debt.
Company B uses substantial debt and therefore incurs greater interest expense.
Their net income can differ because of financing.
Their operating businesses may still generate similar NOPAT.
Using NOPAT therefore makes ROIC more focused on operating economics rather than the debt-versus-equity financing decision.
NOPAT Example
Suppose operating profit is $2 million.
Using a 25% tax assumption for the simplified example:
NOPAT = $2,000,000 × (1 − 0.25)
NOPAT = $1,500,000
If average invested capital is $10 million:
ROIC = $1,500,000 ÷ $10,000,000
ROIC = 15%
The company generates an after-tax operating return of 15% on the capital included in the calculation.
EBIT and NOPAT
EBIT is frequently used as the operating earnings starting point for NOPAT.
Suppose:
EBIT = $5 million
Tax rate = 30%
Then:
NOPAT = $5M × 70%
NOPAT = $3.5M
However, the simplified formula assumes the EBIT amount and tax rate appropriately represent the operating economics being analyzed.
Real-company calculations can require adjustments for unusual operating items, tax effects, discontinued operations, acquisitions, restructuring, or other factors.
ROIC calculations should therefore be internally consistent rather than mechanically applying one tax percentage to every reported EBIT figure.
What Is Invested Capital?
Invested capital represents the capital committed to the operating business.
A common financing-side framework is:
Invested Capital = Equity + Debt − Excess Cash
Suppose:
Shareholders’ equity = $6 million
Interest-bearing debt = $4 million
Excess cash = $1 million
Then:
Invested Capital = $6M + $4M − $1M
Invested Capital = $9M
If NOPAT is $1.35 million:
ROIC = $1.35M ÷ $9M
ROIC = 15%
The subtraction of excess cash reflects the idea that cash not required for operations may not be capital actively deployed in producing operating profit.
However, determining how much cash is genuinely “excess” requires judgment.
Why Cash May Be Subtracted
Cash presents a common ROIC issue.
Suppose a business holds $500 million of cash but requires $100 million for routine operating liquidity.
Subtracting the entire $500 million can understate capital actually needed by the business.
Including all $500 million can overstate operating capital if $400 million is genuinely surplus.
The analytical question is:
How much cash is required to run the business, and how much is financially idle or non-operating?
This is why company ROIC methodologies often differ in their treatment of cash.
Average Invested Capital
As with other return ratios, averaging the denominator can improve period matching.
A common formula is:
Average Invested Capital = (Beginning Invested Capital + Ending Invested Capital) ÷ 2
Suppose:
Beginning invested capital = $8 million
Ending invested capital = $12 million
NOPAT = $1.8 million
Using ending invested capital:
ROIC = $1.8M ÷ $12M
ROIC = 15%
Using average capital:
Average Invested Capital = $10M
ROIC = $1.8M ÷ $10M
ROIC = 18%
When capital changes materially, denominator methodology can significantly affect the result.
What Does a 20% ROIC Mean?
A 20% ROIC means NOPAT equals approximately 20% of the average invested capital included in the analysis.
Suppose:
Average invested capital = $50 million
At 20% ROIC:
NOPAT = $50M × 20%
NOPAT = $10M
The company generates $10 million of after-tax operating profit from $50 million of average invested capital.
Whether that 20% is economically attractive depends partly on how much return investors require for providing that capital.
What Is a Good ROIC?
There is no universal ROIC percentage that is good for every company.
Capital intensity, business risk, industry structure, competition, accounting definitions, growth stage, and financing conditions all matter.
A useful analysis compares ROIC with:
the company’s historical ROIC;
appropriate competitors;
incremental returns on new capital;
and an appropriately comparable cost of capital.
A company consistently earning high returns on capital can have attractive business economics.
However, high historical ROIC is valuable only if those returns are sustainable and, ideally, the company can reinvest additional capital at similarly attractive rates.
ROIC vs WACC
One of the most important ROIC comparisons is with the weighted average cost of capital, or WACC.
Conceptually:
ROIC > WACC → Positive Return Spread
ROIC = WACC → Approximately Zero Return Spread
ROIC < WACC → Negative Return Spread
The spread can be written as:
ROIC Spread = ROIC − WACC
Suppose:
ROIC = 18%
WACC = 10%
Then:
ROIC Spread = 8 Percentage Points
The company’s modeled operating return exceeds its modeled cost of capital by eight percentage points.
That generally indicates favorable capital economics under compatible definitions and assumptions.
Why ROIC Above WACC Matters
Suppose a company invests $10 million of capital.
If it generates a sustainable after-tax operating return of 15%:
Annual NOPAT = $1.5 million
If the economic cost of that capital is modeled at 9%, the business earns a return above the capital hurdle.
By contrast, if ROIC is 6% against a comparable 9% capital cost, increasing the capital invested at those economics can destroy value even if revenue and accounting profit continue growing.
Growth alone is therefore not enough.
The return earned on incremental capital matters.
ROIC and Economic Value Added
Economic value added addresses a closely related idea by explicitly charging operating profit for the cost of capital.
Conceptually:
Economic Profit ≈ (ROIC − Cost of Capital) × Invested Capital
Suppose:
ROIC = 16%
Capital cost = 10%
Invested capital = $20 million
Return spread:
6%
Approximate economic profit based on the simplified relationship:
$20M × 6% = $1.2M
ROIC gives the rate.
Economic value added expresses the capital-return spread in dollar terms under its methodology.
Return on Invested Capital vs Return on Equity
The workbook maps return on equity directly to this article.
A common ROE formula is:
ROE = Net Income ÷ Average Shareholders’ Equity
ROIC commonly uses:
ROIC = NOPAT ÷ Average Invested Capital
The difference is fundamental.
ROE measures earnings relative to shareholder equity.
ROIC evaluates operating returns across the broader capital invested in the business.
As a result, financial leverage can dramatically increase ROE without producing a corresponding increase in ROIC.
ROIC vs ROE Example
Suppose:
Net income = $1 million
NOPAT = $1.5 million
Average equity = $4 million
Average invested capital = $10 million
ROE:
$1M ÷ $4M = 25%
ROIC:
$1.5M ÷ $10M = 15%
The company reports 25% ROE but only 15% ROIC.
The difference can partly reflect leverage and the different earnings and capital definitions used.
A high ROE should therefore not be assumed to imply an equally high ROIC.
Return on Invested Capital vs Return on Assets
The workbook maps return on assets as another sibling.
ROA commonly uses:
ROA = Net Income ÷ Average Total Assets
ROIC uses a more targeted operating-return numerator and invested-capital denominator.
Total assets can include assets that analysts may treat as non-operating in ROIC, such as excess cash.
Likewise, ROA’s net-income numerator includes financing effects that NOPAT is designed to avoid.
ROA therefore provides a broad accounting view of asset profitability.
ROIC focuses more specifically on operating capital productivity.
Return on Invested Capital vs Return on Capital Employed
The workbook maps return on capital employed directly.
A common ROCE formula is:
ROCE = EBIT ÷ Average Capital Employed
ROIC commonly uses:
ROIC = NOPAT ÷ Average Invested Capital
ROCE is therefore often pre-tax.
ROIC is generally after-tax.
Their denominators can also differ.
For example, ROIC may subtract excess cash or make other operating adjustments that are not included in a particular ROCE calculation.
They are related capital-efficiency measures, but they should not be treated as synonyms.
Return on Invested Capital vs ROI
The workbook maps ROI directly to this page.
ROI is a broad term that can be used for individual investments, marketing campaigns, equipment projects, securities, or other decisions.
ROIC is a more specific company operating-performance ratio.
A simplified ROI might be:
ROI = Gain ÷ Investment Cost × 100
ROIC instead evaluates:
After-Tax Operating Profit ÷ Invested Operating Capital
A project can have 30% ROI while the company as a whole generates 12% ROIC.
The metrics answer different questions.
ROIC vs Profitability Index
Profitability index is a capital-budgeting ratio based on discounted future cash flows.
ROIC is normally an accounting-based operating-return measure.
Suppose an existing business generates 18% ROIC.
A proposed expansion can still have a profitability index below 1 if the expected future cash flows do not justify the investment at the required discount rate.
Historical business profitability does not guarantee that every new project is economically attractive.
ROIC vs NPV
Net present value measures the dollar value created by a modeled stream of discounted future cash flows.
ROIC measures a rate of operating return on capital.
A company may have a 20% current ROIC but still consider a proposed acquisition with negative NPV if the purchase price is too high.
Likewise, a project with temporarily low early accounting ROIC can potentially have positive NPV if later cash flows are sufficiently strong.
Rate-of-return metrics and discounted dollar-value metrics should therefore be used together where appropriate.
ROIC vs Internal Rate of Return
Internal rate of return solves for the discount rate that makes a project’s NPV equal zero.
ROIC does not solve a discounted cash-flow equation.
It uses operating earnings and invested capital from the business.
The two percentages can therefore differ materially even when evaluating the same general investment.
IRR is primarily a project cash-flow concept.
ROIC is primarily an operating capital-efficiency concept.
ROIC and Operating Margin
Operating margin is an important ROIC driver.
Suppose a company generates more operating profit from the same sales.
NOPAT can rise.
If invested capital remains stable, ROIC improves.
For example:
Revenue = $10 million
Operating margin = 10%
Operating profit:
$1 million
At 25% tax:
NOPAT = $750,000
If invested capital is $5 million:
ROIC = 15%
Now operating margin rises to 15%.
Operating profit becomes:
$1.5 million
NOPAT:
$1.125 million
ROIC:
$1.125M ÷ $5M = 22.5%
Capital did not change.
Improved profitability drove the entire ROIC increase.
ROIC and Capital Turnover
ROIC can also improve when the business generates more revenue from the same capital base.
Conceptually:
ROIC ≈ After-Tax Operating Margin × Invested Capital Turnover
If:
After-tax operating margin = 10%
and:
Invested-capital turnover = 2
then:
ROIC ≈ 20%
One company can therefore achieve high ROIC through strong margins.
Another can achieve it through rapid capital turnover.
A third can combine both.
ROIC and Asset Turnover
Asset turnover provides a broader revenue-to-assets efficiency measure.
Suppose a retailer reduces excess inventory while maintaining sales.
Total assets can decline.
Invested capital can also decline.
If operating profit remains stable, ROIC can rise.
However, capital reduction should not compromise customer service or operating resilience.
The goal is productive use of capital, not simply the smallest possible denominator.
ROIC and Working Capital
Working capital is often a major component of invested capital.
Consider two businesses generating identical revenue and operating profit.
Company A collects customers quickly and turns inventory rapidly.
Company B carries much larger receivable and inventory balances.
Company B needs more operating capital.
Unless those extra balances generate greater NOPAT, ROIC will generally be lower.
Working-capital efficiency can therefore be a powerful source of capital-return improvement.
ROIC and Receivables Turnover
Receivables turnover affects how much money remains tied up in customer balances.
Suppose a company can reduce average receivables from $5 million to $3 million while maintaining sales and operating profit.
The company releases $2 million of capital.
If that reduction does not harm customer relationships or revenue, invested capital falls while NOPAT remains stable.
ROIC can improve.
ROIC and Inventory Turnover
Inventory turnover produces a similar effect.
Excess inventory requires financing.
If management can maintain the same sales and margins with a smaller inventory base, invested capital declines.
ROIC rises.
However, cutting inventory too aggressively can create lost sales, production interruptions, and higher logistics costs.
Capital efficiency must remain operationally sustainable.
ROIC and Cash Conversion Cycle
The cash conversion cycle links inventory, receivables, and supplier-payment timing.
A shorter cycle can reduce the capital needed to support a given level of revenue.
If NOPAT remains stable, lower operating capital requirements can improve ROIC.
This is why ROIC is not purely an income-statement metric.
Balance-sheet discipline matters substantially.
ROIC and Capital Expenditure
Capital expenditures can initially reduce ROIC.
Suppose a company invests $20 million in a new plant.
Invested capital rises.
The plant takes two years to reach full production.
During the ramp-up period, NOPAT may increase only slightly.
ROIC can decline.
That does not automatically mean the project was a mistake.
A meaningful analysis should evaluate whether the new capital eventually produces adequate incremental operating returns.
Incremental ROIC
Incremental return on invested capital focuses on the return generated from additional capital rather than the entire historical capital base.
A simplified conceptual formula is:
Incremental ROIC = Change in NOPAT ÷ Change in Invested Capital
Suppose:
Invested capital increases by $10 million.
Annual NOPAT eventually increases by $1.8 million.
Then:
Incremental ROIC = $1.8M ÷ $10M
Incremental ROIC = 18%
A company can have excellent historical ROIC but poor incremental ROIC if new investments earn much lower returns.
For long-term growth, incremental returns can be as important as the historical average.
High ROIC With No Reinvestment Opportunity
Suppose a mature company generates 30% ROIC but has almost no ability to invest additional capital at attractive returns.
Its current business may still be excellent.
However, growth from reinvestment can be limited.
The company may return more cash to shareholders through dividends or repurchases instead.
High ROIC is particularly powerful when combined with opportunities to reinvest substantial capital at similarly attractive incremental returns.
High Reinvestment With Low ROIC
Now suppose another business reinvests nearly all of its cash flow but earns only 5% on new invested capital.
Rapid reinvestment can increase revenue and assets dramatically.
Yet if the required economic return is substantially higher than 5%, growth can reduce value.
This is why growth rate should never be analyzed without the return earned on the capital required to create that growth.
ROIC and Free Cash Flow
Free cash flow complements ROIC.
ROIC uses accounting-based operating earnings and invested capital.
Free cash flow reflects cash generation after relevant capital expenditures under its formula.
A company can report strong ROIC but weak free cash flow during a major investment cycle because cash is being committed to new assets.
Conversely, a mature company can generate strong free cash flow because it has few opportunities requiring new investment.
The metrics answer different but complementary questions.
ROIC and Depreciation
Depreciation affects operating profit and therefore NOPAT.
It also reduces the carrying amount of fixed assets over time.
This means mature assets can create an accounting effect in which both the numerator and denominator change as assets age.
If a company continues generating strong earnings from heavily depreciated equipment, ROIC can rise as the recorded capital base declines.
A competitor with newly purchased equipment can report lower ROIC even if its physical productivity is similar.
Asset age therefore matters in capital-intensive comparisons.
ROIC and Goodwill
Acquisitions often create goodwill.
Whether goodwill is included in invested capital can materially affect ROIC.
Suppose:
NOPAT = $2 million
Invested capital including goodwill = $20 million
ROIC = 10%
If an adjusted methodology removes $5 million of goodwill:
Adjusted Invested Capital = $15 million
Adjusted ROIC ≈ 13.33%
The adjusted percentage is much higher.
Neither definition should be used without disclosure.
Including goodwill can be particularly useful when asking whether management earned adequate returns on the total acquisition price actually paid.
Excluding goodwill can answer a different question about underlying operating assets.
ROIC and Acquisitions
An acquisition can reduce ROIC even when earnings increase.
Suppose a company pays $500 million to acquire a business that contributes $30 million of annual NOPAT.
The incremental return is approximately:
$30M ÷ $500M = 6%
If the acquiring company’s existing ROIC is 20%, the acquisition can reduce consolidated ROIC.
That does not automatically prove the acquisition destroys value because synergies or future growth can matter.
But it does reveal that the new capital initially earns much less than the legacy business.
ROIC and Startup Valuation
The workbook maps startup valuation because early-stage businesses can have very different capital-return patterns from mature companies.
A startup may have negative NOPAT while investing heavily in customer acquisition, technology, employees, and infrastructure.
Its current ROIC can therefore be negative or not especially informative.
Investors may focus more heavily on unit economics, growth, market potential, cash runway, and expected mature economics.
However, the long-term economic question remains important:
Can the company eventually generate attractive returns on the capital required to scale?
ROIC and Business Valuation
Business valuation is closely connected to capital returns.
A company that earns high ROIC and can reinvest substantial amounts of capital at similarly high returns can potentially compound operating earnings rapidly.
A company with low reinvestment returns can grow without creating comparable economic value.
However, ROIC alone does not establish what a business is worth.
Valuation also depends on:
future growth;
competitive durability;
risk;
cash-flow timing;
required returns;
and the price paid by the investor.
ROIC and Financial Leverage
Financial leverage affects shareholder returns but is intentionally less central to ROIC than to ROE.
Suppose a company replaces equity financing with debt while its operating business remains unchanged.
ROE can change substantially because the equity denominator changes and interest affects net income.
ROIC may change much less if total operating invested capital remains similar.
This makes ROIC useful for evaluating operating economics with less dependence on financing structure.
ROIC and Debt-to-Equity
Debt-to-equity ratio should still be reviewed alongside ROIC.
Two companies can each report 18% ROIC.
One can be conservatively financed.
The other can carry substantial debt.
Operating capital productivity might be similar, but financial risk differs significantly.
A strong ROIC does not eliminate refinancing, interest, or leverage risk.
ROIC and Interest Coverage
Interest coverage helps evaluate whether financing obligations remain manageable.
A company can generate high ROIC yet still take on excessive debt.
If interest coverage deteriorates sharply, the capital structure can become vulnerable despite attractive underlying operating returns.
ROIC measures operating capital efficiency.
Interest coverage measures a different part of financial resilience.
ROIC and Share Repurchases
Share repurchases can dramatically affect ROE because they reduce shareholders’ equity.
Their effect on well-constructed ROIC is generally less direct.
If a company uses excess cash to repurchase shares, both excess cash and equity may decline.
Depending on the invested-capital definition, operating invested capital may change little.
This is another reason ROIC can provide useful context when ROE rises after substantial buybacks.
ROIC and Dividends
Dividends distribute capital to shareholders.
If the distributed cash was genuinely excess and excluded from operating invested capital, the effect on ROIC may be limited.
If the distribution reduces operating liquidity or is financed through additional debt, the economic picture changes.
Capital distributions should therefore be considered alongside operating funding requirements rather than assumed to improve capital efficiency automatically.
Adjusted ROIC
Companies frequently publish adjusted ROIC.
Conceptually:
Adjusted ROIC = Adjusted NOPAT ÷ Adjusted Average Invested Capital × 100
Adjustments can involve:
restructuring costs;
acquisition charges;
impairments;
lease obligations;
goodwill;
cash;
stock compensation;
or other items.
Adjusted ROIC can help management explain underlying performance.
However, every adjustment changes comparability.
A company’s adjusted 20% ROIC should not automatically be compared with another company’s reported 15% ROIC.
ROIC Is Often a Non-GAAP Measure
Unlike a standardized financial-statement line item, ROIC is frequently a company-defined performance measure.
That means two companies can use the same label while calculating the ratio differently.
One company may use tax-effected operating income.
Another may use adjusted NOPAT.
One may subtract all cash.
Another subtracts only cash above an operating threshold.
One may include leases and goodwill.
Another may exclude them.
Always read the reconciliation and methodology when using company-reported ROIC.
Comparing ROIC Between Companies
Before comparing ROIC figures, verify:
the NOPAT definition;
the tax rate used;
whether earnings are reported or adjusted;
whether capital is averaged;
whether cash is excluded;
whether goodwill is included;
how leases are treated;
how debt is defined;
whether acquisitions are adjusted;
and whether the periods match.
A five-percentage-point gap can come partly from methodology rather than economic performance.
ROIC Trend Analysis
Suppose:
Year 1 = 10%
Year 2 = 13%
Year 3 = 16%
Year 4 = 19%
The trend suggests improving capital efficiency.
Possible causes include stronger margins, higher capital turnover, better working-capital management, asset disposals, or improved capacity utilization.
Now suppose:
Year 1 = 25%
Year 2 = 20%
Year 3 = 14%
Year 4 = 9%
The decline deserves investigation.
Possible explanations include lower margins, expensive acquisitions, aggressive capital spending, excess working capital, weaker demand, or diminishing incremental returns.
ROIC Growth Example
Suppose:
Year 1
NOPAT = $1 million
Invested capital = $10 million
ROIC = 10%
Year 2
NOPAT = $1.5 million
Invested capital = $12 million
ROIC = 12.5%
NOPAT increased 50%.
Capital increased only 20%.
Capital efficiency improved.
ROIC Decline Despite Higher Profit
Now suppose:
Year 1:
NOPAT = $2 million
Invested capital = $10 million
ROIC = 20%
Year 2:
NOPAT = $2.5 million
Invested capital = $20 million
ROIC = 12.5%
Operating profit increased 25%.
Capital employed doubled.
The company is generating more total profit but much less profit per invested-capital dollar.
That distinction is exactly what ROIC is designed to reveal.
Negative ROIC
If NOPAT is negative while invested capital remains positive, ROIC becomes negative.
Suppose:
NOPAT = −$500,000
Average invested capital = $5 million
ROIC = −10%
A negative return indicates operating losses relative to the capital committed.
This can occur during startup periods, downturns, restructuring, or failed investments.
The cause and expected duration matter more than the sign alone.
Negative or Near-Zero Invested Capital
Some unusual companies can have very small or negative calculated invested capital because of large non-interest-bearing operating liabilities, accumulated accounting effects, or the particular formula used.
When the denominator approaches zero, ROIC can become extremely large and economically difficult to interpret.
If invested capital is zero:
ROIC = NOPAT ÷ 0
The ratio is undefined.
A conventional ROIC should not be forced onto a business where the denominator no longer produces a meaningful economic relationship.
ROIC for Financial Companies
ROIC is often less straightforward for banks and certain financial institutions because debt and other liabilities are deeply integrated into their operating model rather than functioning merely as external financing.
For these businesses, measures such as ROE, ROA, net interest margin, and regulatory capital returns may be more natural.
This does not make ROIC mathematically impossible.
It means the distinction between operating liabilities and financing capital becomes much less clear.
Common ROIC Mistakes
One common mistake is using net income in the numerator without recognizing that the calculation has moved away from NOPAT-based ROIC.
Another is including all cash in invested capital without considering whether some cash is genuinely excess.
A third is comparing one company’s adjusted ROIC with another company’s reported ROIC.
Analysts also confuse ROIC with ROE, ROCE, and ROI.
Another mistake is comparing pre-tax and after-tax measures as though they were equivalent.
Users can also focus only on historical average ROIC while ignoring declining incremental returns.
Finally, a high ROIC should not be treated as proof that the company’s stock or business is attractively valued at its current price.
Limitations of Return on Invested Capital
ROIC is powerful, but it is not perfectly standardized.
NOPAT can require judgment.
The appropriate tax rate can require judgment.
Invested capital can be calculated several ways.
Cash treatment varies.
Goodwill treatment varies.
Lease adjustments vary.
Acquisition accounting can distort comparisons.
Depreciation and asset age affect the denominator.
Adjusted company-reported ROIC can differ significantly from a standardized analytical calculation.
ROIC also uses accounting-derived operating earnings rather than directly measuring free cash flow.
These limitations make transparency and consistency essential.
How to Analyze ROIC Properly
Start with an operating earnings measure.
For a simplified calculation:
NOPAT = Operating Profit × (1 − Tax Rate)
Then construct invested capital consistently.
A common approach is:
Invested Capital = Equity + Interest-Bearing Debt − Excess Cash
Calculate average invested capital:
Average Invested Capital = (Beginning + Ending Invested Capital) ÷ 2
Then:
ROIC = NOPAT ÷ Average Invested Capital × 100
Compare the result with historical ROIC and relevant peers.
Next, compare ROIC with an appropriately compatible cost of capital.
Then analyze operating margin, capital turnover, working capital, acquisitions, capital expenditures, and incremental returns.
Finally, compare accounting capital returns with free cash flow.
This reveals not only how high ROIC is, but what creates it, whether new investment earns similar returns, and whether the economics appear sustainable.
Why Return on Invested Capital Matters
Return on invested capital answers one of the most important questions in business finance:
How effectively does a company turn invested operating capital into after-tax operating profit?
Its common formula is:
ROIC = NOPAT ÷ Average Invested Capital × 100
The ratio becomes particularly powerful when compared with the company’s cost of capital.
A business can grow revenue.
It can grow assets.
It can even grow accounting profit.
But if the return generated on new capital consistently falls below the economic cost of that capital, growth can still produce weak economics.
Conversely, a company that can repeatedly reinvest large amounts of capital at high ROIC can compound operating earnings efficiently.
Therefore, the most useful question is not simply:
“Does the company have a high ROIC today?”
It is:
“Can the business continue generating returns above its capital requirements as it reinvests and grows?”
Frequently Asked Questions
What is return on invested capital in simple terms?
Return on invested capital measures how much after-tax operating profit a company generates relative to the capital invested in its operations.
What is the ROIC formula?
A common formula is:
ROIC = NOPAT ÷ Average Invested Capital × 100
What does NOPAT mean?
NOPAT means net operating profit after tax. A simplified calculation is:
NOPAT = Operating Profit × (1 − Tax Rate)
It attempts to measure after-tax operating earnings before financing effects.
How do you calculate invested capital?
One common framework is:
Invested Capital = Shareholders’ Equity + Interest-Bearing Debt − Excess Cash
Company and analyst definitions can differ, so the methodology should always be stated.
What does a 20% ROIC mean?
A 20% ROIC means after-tax operating profit equals approximately 20% of average invested capital under the selected calculation.
What is a good ROIC?
There is no universal good percentage. ROIC is most useful when compared with the company’s historical returns, comparable businesses, incremental returns, and an appropriately comparable cost of capital.
Is ROIC above WACC good?
Conceptually, ROIC above a compatible WACC indicates that operating returns exceed the modeled cost of capital. The size and sustainability of the spread matter.
What is the difference between ROIC and ROE?
ROE measures net income relative to shareholders’ equity. ROIC measures after-tax operating earnings relative to a broader invested-capital base, making it less directly dependent on financing structure.
What is the difference between ROIC and ROCE?
ROCE commonly uses pre-tax EBIT divided by capital employed. ROIC commonly uses after-tax operating profit divided by invested capital. The denominator definitions can also differ.
What is the difference between ROIC and ROI?
ROI is a broad return measure that can be applied to an individual investment. ROIC is specifically designed to assess company operating returns on invested capital.
Can ROIC be negative?
Yes. If NOPAT is negative while average invested capital is positive, ROIC will be negative.
Why is incremental ROIC important?
Historical ROIC shows returns on the existing capital base. Incremental ROIC helps reveal whether additional capital invested for future growth is producing similarly attractive returns.




