


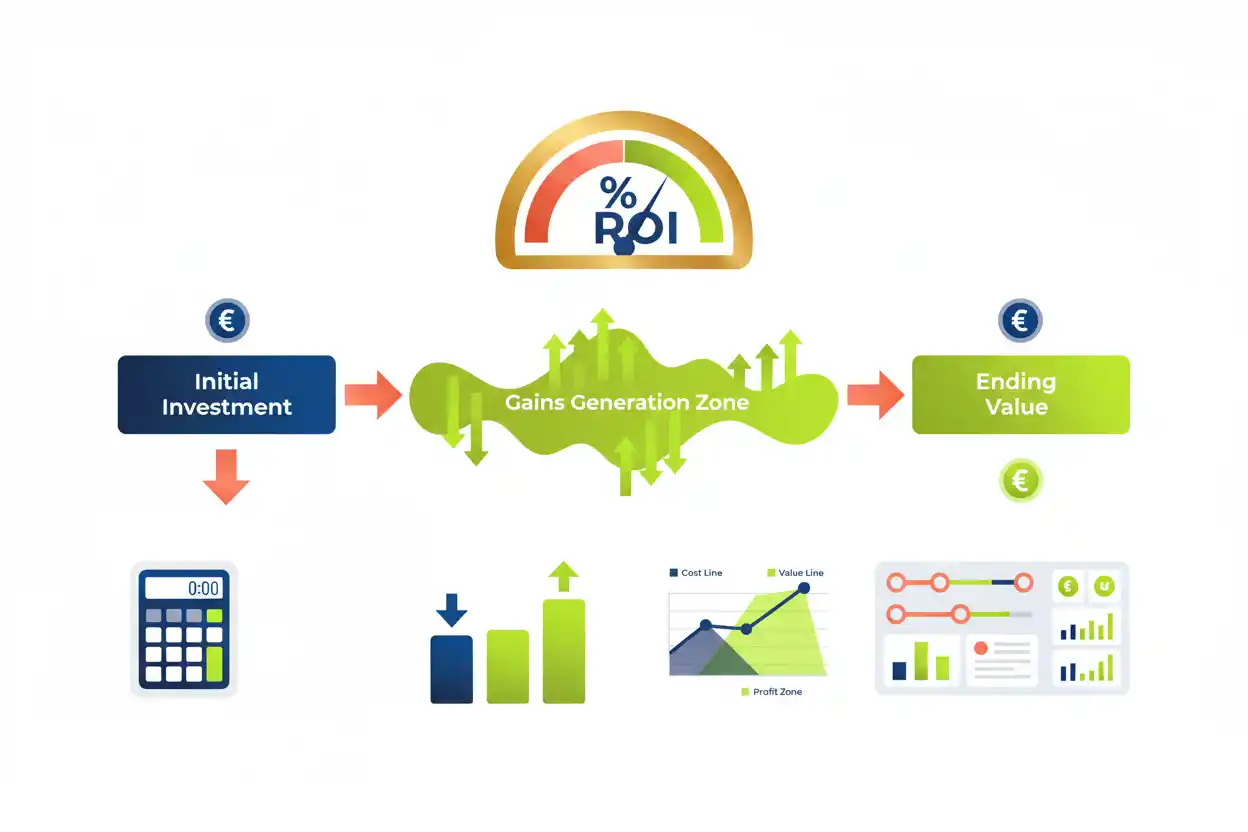
ROI, or return on investment, measures the gain or loss from an investment relative to the amount invested. It converts an investment result into a percentage, making it easier to compare opportunities of different sizes.
A common formula is:
ROI = Net Return ÷ Investment Cost × 100
If an investment costs $10,000 and produces a net gain of $2,500:
ROI = $2,500 ÷ $10,000 × 100
ROI = 25%
A 25% ROI means the net gain equals 25% of the original investment cost under the assumptions used.
The formula is simple, but interpretation requires care. ROI does not automatically account for how long the investment was held, when cash flows occurred, financing structure, risk, taxes, inflation, or the time value of money.
Within business finance, ROI is therefore best treated as a broad return measure rather than a substitute for more specialized calculations such as NPV, IRR, ROIC, or payback period.
What Does ROI Mean?
ROI stands for return on investment.
It answers a basic question:
How much did an investment gain or lose relative to what it cost?
The general relationship is:
ROI = Investment Gain or Loss ÷ Investment Cost
Suppose a business spends $50,000 on equipment and ultimately produces a $15,000 net economic gain attributable to that investment.
ROI = $15,000 ÷ $50,000
ROI = 30%
The investment generated a 30% return based on the defined gain and cost.
However, defining those two amounts correctly is critical.
If maintenance, installation, financing fees, implementation costs, or other necessary expenditures are omitted from the denominator or gain calculation, the reported ROI can be overstated.
ROI Formula
The standard formula is:
ROI = (Gain From Investment − Cost of Investment) ÷ Cost of Investment × 100
Because:
Net Return = Gain From Investment − Cost of Investment
the formula can also be written:
ROI = Net Return ÷ Investment Cost × 100
Suppose:
Investment cost = $20,000
Final proceeds = $26,000
Net gain:
$26,000 − $20,000 = $6,000
ROI:
$6,000 ÷ $20,000 × 100
ROI = 30%
The result is positive because proceeds exceed the investment cost.
Simple ROI Example
Suppose a company invests $100,000 in a project.
The project eventually returns $125,000.
Net gain:
$125,000 − $100,000 = $25,000
ROI:
$25,000 ÷ $100,000 × 100
ROI = 25%
The project produced a total return of 25%.
However, that result is incomplete without a time period.
A 25% ROI earned in one year is very different from 25% earned over ten years.
Simple ROI alone does not show that distinction.
Negative ROI
ROI can be negative when the investment loses money.
Suppose:
Investment cost = $50,000
Amount recovered = $40,000
Net return:
$40,000 − $50,000 = −$10,000
ROI:
−$10,000 ÷ $50,000 × 100
ROI = −20%
The investment lost 20% of the original amount invested under the stated calculation.
Negative ROI does not always mean an investment should never have been made. Unexpected events, strategic objectives, learning value, or long-term benefits can matter.
However, financially, the defined investment produced a loss.
What Does 0% ROI Mean?
A zero ROI means the investment recovered exactly the amount included as its cost but generated no net gain under the formula.
Suppose:
Investment = $25,000
Total proceeds = $25,000
Then:
Net Return = $0
and:
ROI = 0%
This is a break-even outcome on a simple undiscounted basis.
It does not necessarily mean the investor is economically indifferent.
If the capital was tied up for five years, the investor gave up alternative uses of that money during the period.
Simple ROI does not incorporate that opportunity cost.
What Does a 100% ROI Mean?
A 100% ROI means the net gain equals the original investment.
Suppose:
Initial investment = $10,000
Final proceeds = $20,000
Net gain:
$20,000 − $10,000 = $10,000
ROI:
$10,000 ÷ $10,000 × 100
ROI = 100%
The investor recovered the original $10,000 and earned an additional $10,000.
The ending amount is therefore twice the original investment.
ROI Above 100%
ROI can exceed 100%.
Suppose:
Investment cost = $20,000
Final value or proceeds = $50,000
Net gain:
$50,000 − $20,000 = $30,000
ROI:
$30,000 ÷ $20,000 × 100
ROI = 150%
A 150% ROI means the gain itself equals one and a half times the original investment.
The total ending proceeds equal 250% of the original amount.
What Is a Good ROI?
There is no universal good ROI.
A 15% return can be highly attractive for one investment and inadequate for another.
Interpretation depends on:
risk;
holding period;
liquidity;
capital requirements;
financing;
taxes;
alternative investments;
cash-flow timing;
and the probability that expected returns will actually occur.
A low-risk project producing a dependable 12% return can be more attractive than a speculative opportunity advertising 50% expected ROI with substantial probability of loss.
The percentage should always be evaluated in context.
ROI and Investment Cost
Correctly defining investment cost is one of the most important parts of the calculation.
Suppose equipment has a purchase price of $100,000.
Additional costs are:
Installation = $10,000
Training = $5,000
Implementation = $8,000
Total investment:
$100,000 + $10,000 + $5,000 + $8,000
Investment Cost = $123,000
If the economic gain is $30,000:
Using purchase price only:
ROI = $30,000 ÷ $100,000 = 30%
Using total investment:
ROI = $30,000 ÷ $123,000 ≈ 24.39%
Ignoring required implementation costs materially overstates the return.
ROI and Net Gain
The numerator should also be defined carefully.
Suppose an investment generates $50,000 of additional revenue but requires $20,000 of additional operating costs.
The net benefit is:
$50,000 − $20,000 = $30,000
If the investment cost was $100,000:
ROI = $30,000 ÷ $100,000
ROI = 30%
Using the $50,000 revenue increase as though it were the net return would give:
50%
That would overstate ROI because the incremental costs required to generate the revenue were ignored.
ROI vs Profit
Profit measures the amount by which applicable revenue or proceeds exceed costs.
ROI places a gain relative to the amount invested.
Suppose two projects each generate $100,000 of profit.
Project A requires $500,000.
Project B requires $2 million.
Project A:
ROI = $100,000 ÷ $500,000
ROI = 20%
Project B:
ROI = $100,000 ÷ $2,000,000
ROI = 5%
The projects generate equal profit dollars but dramatically different returns relative to investment.
ROI vs Profit Margin
Net profit margin measures profit relative to revenue:
Profit Margin = Profit ÷ Revenue × 100
ROI measures return relative to investment cost.
Suppose:
Revenue = $500,000
Profit = $50,000
Investment required = $200,000
Profit margin:
$50,000 ÷ $500,000 = 10%
ROI:
$50,000 ÷ $200,000 = 25%
The same business activity produces a 10% margin and 25% ROI because the denominators answer different questions.
ROI vs Gross Margin
Gross margin measures gross profit as a percentage of revenue.
A product can have a high gross margin but weak ROI if enormous investment is required to produce those sales.
For example, a capital-intensive manufacturing project may produce attractive gross margins while requiring expensive plants, equipment, inventory, and working capital.
Margin measures profitability relative to sales.
ROI measures gain relative to investment.
ROI vs Return on Equity
The workbook maps return on equity directly to this page.
ROE commonly uses:
ROE = Net Income ÷ Average Shareholders’ Equity × 100
ROI is broader:
ROI = Investment Gain ÷ Investment Cost × 100
ROE evaluates company accounting earnings relative to shareholders’ equity.
ROI can be applied to an individual project, property, marketing campaign, security, machine, acquisition, or many other investments.
They should not be treated as interchangeable.
ROI vs Return on Invested Capital
The workbook maps return on invested capital directly.
ROIC is a specialized corporate capital-efficiency metric.
A common ROIC formula is:
ROIC = NOPAT ÷ Average Invested Capital × 100
ROI is much broader and less standardized.
A company may earn 15% ROIC across its operating business while a specific automation project generates a modeled 40% ROI.
The project ROI does not describe the company’s overall capital efficiency.
ROI vs Return on Capital Employed
The workbook also maps return on capital employed.
A common ROCE formula is:
ROCE = EBIT ÷ Average Capital Employed × 100
ROCE evaluates company operating earnings relative to a defined capital base.
ROI can measure the return from one specific investment.
Therefore, a 25% project ROI does not mean the company has 25% ROCE.
The numerator and denominator are different.
ROI vs Return on Assets
Return on assets measures company net income relative to average total assets.
Suppose:
Net income = $2 million
Average assets = $20 million
ROA = 10%
The same company could complete a $500,000 project generating a $100,000 gain.
Project ROI = 20%
The 20% project ROI and 10% company ROA describe different scopes of performance.
ROI vs Profitability Index
Profitability index incorporates discounted future cash flows.
A common formula is:
PI = Present Value of Future Cash Inflows ÷ Initial Investment
ROI generally does not discount cash flows.
Suppose a $100,000 project is expected to generate $130,000 five years from now.
Simple ROI:
($130,000 − $100,000) ÷ $100,000
ROI = 30%
However, the present value of that future $130,000 can be substantially below $130,000.
Profitability index accounts for the required discounting.
Simple ROI does not.
ROI vs NPV
Net present value measures absolute value creation after discounting future cash flows.
ROI measures a relative percentage.
Suppose:
Project A:
Investment = $10,000
Net gain = $5,000
ROI = 50%
Project B:
Investment = $1 million
Net gain = $200,000
ROI = 20%
Project A has the higher simple ROI.
Project B creates a much larger dollar gain.
After incorporating timing and required return, NPV can rank the projects differently again.
High percentage return and high absolute value creation are not the same thing.
ROI vs IRR
Internal rate of return incorporates the timing of a sequence of project cash flows.
IRR is the discount rate that causes the project’s NPV to equal zero.
Simple ROI does not solve for a discount rate.
For example, a project could report:
Total ROI = 50%
over five years.
Another might produce:
Total ROI = 40%
in one year.
The first has the higher cumulative ROI.
The second may have a dramatically stronger annualized rate of return.
Timing matters.
ROI vs Payback Period
Payback period measures how long an investment takes to recover its initial cash outflow.
ROI measures how much gain occurs relative to the investment.
Consider:
Project A ROI = 30%
Payback = 2 years
Project B ROI = 60%
Payback = 8 years
Project A returns the initial capital sooner.
Project B eventually produces the higher simple percentage gain.
Which characteristic matters more depends on liquidity needs, risk, project life, and the complete economics.
ROI and Time
One of the biggest weaknesses of simple ROI is that it does not inherently include time.
Suppose two investments each cost $10,000 and eventually return $15,000.
Both have:
ROI = 50%
But Investment A reaches $15,000 in two years.
Investment B takes ten years.
The reported simple ROI is identical.
The investment experience is not.
Whenever holding periods differ, annualized return can provide a more meaningful comparison.
Annualized ROI Formula
If a total return is known over multiple years, a compound annualized rate can be calculated as:
Annualized Return = (1 + Total ROI)^(1 ÷ Years) − 1
Suppose:
Total ROI = 50%
Holding period = 3 years
Then:
Annualized Return = (1.50)^(1/3) − 1
Annualized Return ≈ 14.47%
A 50% cumulative gain over three years therefore corresponds to approximately 14.47% compounded annually.
It should not be described as 16.67% per year merely by dividing 50% by three.
One-Year ROI
When the entire measurement period is exactly one year, simple ROI and an annual return percentage can be much easier to compare.
Suppose:
Beginning investment = $50,000
Ending proceeds = $55,000
Net gain:
$5,000
One-year ROI:
$5,000 ÷ $50,000
ROI = 10%
If the investment produced additional cash distributions during the year, those also need to be incorporated in the return calculation when relevant.
Multi-Year ROI
Suppose:
Initial investment = $100,000
Final value after five years = $150,000
No intermediate distributions
Net gain:
$50,000
Simple ROI:
50%
But annualized compound return is:
(1.50)^(1/5) − 1
≈ 8.45% per year
Saying “50% ROI” without the five-year holding period could therefore create a misleading impression.
ROI With Dividends or Cash Distributions
An investment can produce both appreciation and cash distributions.
Suppose:
Initial investment = $10,000
Ending value = $11,000
Cash distributions received = $500
Total gain:
($11,000 − $10,000) + $500
Total Gain = $1,500
ROI:
$1,500 ÷ $10,000 × 100
ROI = 15%
Ignoring the $500 distribution would understate total return.
ROI With Fees
Fees reduce investment returns.
Suppose:
Initial cost = $10,000
Gross ending proceeds = $12,000
Transaction and management costs = $500
Net proceeds:
$11,500
Net gain:
$11,500 − $10,000 = $1,500
Net ROI:
15%
Ignoring the $500 cost would produce:
20%
The difference illustrates why return calculations should identify whether they are gross or net of fees.
Pre-Tax vs After-Tax ROI
Taxes can also materially affect investor outcomes.
Suppose:
Pre-tax gain = $20,000
Investment = $100,000
Pre-tax ROI:
20%
If the applicable tax effects reduce the realized gain to $15,000:
After-Tax ROI = $15,000 ÷ $100,000
After-Tax ROI = 15%
Tax treatment varies by investment, jurisdiction, structure, and investor.
Therefore, a return labeled “ROI” should specify whether it is pre-tax or after-tax when the distinction matters.
Nominal vs Real ROI
Inflation can reduce the purchasing-power value of a return.
Suppose an investment earns a 10% nominal return while prices rise substantially over the same period.
The investor has more money in nominal terms, but the increase in purchasing power is less than 10%.
For a more precise relationship between nominal and real return:
Real Return = (1 + Nominal Return) ÷ (1 + Inflation Rate) − 1
Simple ROI normally reports nominal financial gain unless adjusted explicitly.
ROI for Business Equipment
Suppose a company purchases equipment for $200,000.
Additional installation cost = $20,000.
Total investment:
$220,000
The equipment creates annual net cost savings of $55,000 for four years.
Ignoring discounting and residual value:
Total Benefit = $55,000 × 4
Total Benefit = $220,000
Under a simple cumulative gain framework:
Net Gain = $220,000 − $220,000 = $0
Simple ROI = 0%
Yet that does not mean the project has no economic implications.
The timing of the savings and any residual value matter.
This is where NPV and IRR provide more complete information.
ROI for Marketing
ROI is commonly applied to marketing decisions.
Suppose a campaign costs $20,000.
It generates $60,000 of attributable sales.
The gross profit attributable to those sales is $30,000.
If the campaign cost is the relevant incremental investment:
Net Marketing Gain = $30,000 − $20,000
Net Gain = $10,000
Then:
Marketing ROI = $10,000 ÷ $20,000 × 100
Marketing ROI = 50%
Using the full $60,000 of revenue as the “return” would ignore the costs associated with delivering those sales.
Attribution is another major challenge because some sales might have occurred without the campaign.
ROI for Software
Suppose software implementation costs:
License = $50,000
Setup = $20,000
Training = $10,000
Total investment:
$80,000
The software is expected to save $30,000 per year for four years.
Undiscounted total benefit:
$120,000
Net gain:
$120,000 − $80,000 = $40,000
Simple cumulative ROI:
$40,000 ÷ $80,000
ROI = 50%
But the timing still matters.
A full project analysis should evaluate when savings occur, implementation risk, recurring costs, and the software’s useful life.
ROI for Rental Property
The site’s rental property returns page provides property-specific measures such as cash flow and cap rate.
A simplified property ROI could compare total investment gain with cash invested.
Suppose:
Initial cash investment = $100,000
Cash flow received = $20,000
Net realized sale gain attributable to the investor = $30,000
Total gain:
$50,000
ROI:
$50,000 ÷ $100,000
ROI = 50%
Again, the holding period matters.
A property generating this result over two years is very different from one requiring fifteen years.
ROI for a Startup Investment
The workbook maps startup valuation directly to ROI.
Suppose an investor contributes $100,000 to a startup.
Years later, the investment is sold for $400,000.
Ignoring intermediate cash flows, taxes, and fees:
Net gain:
$400,000 − $100,000 = $300,000
Simple ROI:
$300,000 ÷ $100,000
ROI = 300%
That sounds extremely high.
If achieving it took 15 years, however, the annualized return is much less dramatic than 300% per year.
Startup returns therefore need both magnitude and time.
ROI and Target Pricing
The workbook maps target pricing because businesses can design pricing around desired economic returns.
Suppose a product investment requires substantial development spending.
A price that merely covers variable and fixed costs may produce accounting profit while failing to generate an adequate return on the capital invested.
Pricing decisions can therefore consider:
cost;
margin;
volume;
capital invested;
and desired return.
However, the price customers are willing to pay ultimately depends on the market, not only the seller’s ROI target.
ROI and Unit Economics
Unit economics helps determine whether growth is likely to produce an attractive return.
Suppose a company earns $50 of contribution from each customer but spends $100 to acquire one.
Initial unit economics are negative.
If the customer later generates enough repeat contribution, the investment may still produce positive ROI.
The relationship between acquisition cost, lifetime contribution, retention, and time therefore determines the ultimate economics.
ROI and Customer Acquisition Cost
Customer acquisition cost is particularly relevant to marketing ROI.
Suppose:
Acquisition cost per customer = $200
Net customer contribution over the measured period = $300
Net gain:
$300 − $200 = $100
Simplified customer-acquisition ROI:
$100 ÷ $200
ROI = 50%
If the $300 contribution arrives over many years, however, time and retention risk should also be considered.
ROI and Cash Flow
ROI should distinguish accounting gains from actual cash flows.
Suppose a project reports $100,000 of accounting profit but customer payments remain uncollected.
The apparent accounting return can look attractive while actual cash availability remains weak.
Operating cash flow helps reveal whether earnings converted into cash.
For large investments, return analysis should therefore consider both profitability and cash realization.
ROI and Free Cash Flow
Free cash flow can also provide important context.
Suppose a project increases operating earnings but requires repeated capital expenditure.
Its accounting ROI might look attractive while the amount of cash ultimately available to investors remains modest.
Cash-intensive businesses need return analysis that captures the complete investment burden rather than only the initial purchase price.
ROI and Working Capital
Working capital is often overlooked in project ROI.
Suppose a new product requires:
Equipment = $500,000
Initial inventory = $150,000
Additional receivables funding = $100,000
Total capital requirement may be closer to:
$750,000
rather than $500,000.
If the project generates a $100,000 annual gain:
Using equipment cost only:
ROI = 20%
Using the full $750,000 investment:
ROI ≈ 13.33%
The denominator should reflect all economically relevant capital required by the investment.
ROI and Business Valuation
Business valuation asks how much a business is worth.
ROI asks what return an investor earns relative to the price or capital invested.
The two concepts meet at acquisition price.
Suppose a business generates attractive cash flows but sells for an extremely high valuation.
The business itself may be excellent while the buyer’s prospective ROI is poor.
A lower-quality business purchased cheaply can sometimes generate a higher investment return.
Return therefore depends not only on economic performance but also on the price paid.
ROI and Risk
Simple ROI does not adjust automatically for risk.
Suppose:
Investment A expected ROI = 10%
Investment B expected ROI = 30%
Investment B is not necessarily better.
If A is highly predictable while B has a substantial probability of losing the entire investment, the higher expected percentage comes with greater uncertainty.
A meaningful comparison should consider the distribution of possible outcomes rather than one projected number.
Expected ROI
When multiple outcomes are possible, an expected return can be estimated using probabilities.
Suppose:
50% probability of +40% ROI
30% probability of +10% ROI
20% probability of −50% ROI
Expected ROI:
(0.50 × 40%) + (0.30 × 10%) + (0.20 × −50%)
20% + 3% − 10%
Expected ROI = 13%
This does not mean the investor will actually receive 13%.
Actual ROI will correspond to whatever outcome occurs.
Expected ROI is a probability-weighted planning measure.
ROI and Opportunity Cost
Suppose a project generates 6% ROI over one year.
That is a positive return.
But if a similarly risky alternative realistically offers 10%, the project can still represent poor capital allocation.
Simple ROI answers:
Did the investment earn money?
It does not automatically answer:
Was this the best available use of the capital?
Required returns and opportunity costs matter.
ROI and the Cost of Capital
The weighted average cost of capital can help establish a corporate hurdle for long-term investment analysis.
However, simple ROI should not be compared mechanically with WACC when the measurements are incompatible.
For example:
a three-year cumulative simple ROI;
and:
an annual cost-of-capital percentage
are not directly comparable.
Time basis, tax treatment, cash-flow timing, and risk need to be aligned.
ROI and Economic Value Added
Economic value added explicitly considers a capital charge.
A project can show positive simple ROI but fail to earn enough to compensate for its economic cost of capital.
For example:
Simple ROI = 5%
may look positive.
If the relevant required return is materially higher, the investment can still destroy economic value.
Positive ROI therefore does not automatically mean value creation.
ROI and Break-Even
Break-even analysis identifies the point where relevant revenues equal relevant costs.
At the investment level, ROI reaches zero when the net gain is zero.
Therefore:
ROI = 0% when Gain = Investment Cost
However, a zero simple ROI after several years can still be economically unattractive because the formula ignores the required return on capital during that time.
Accounting break-even and economic attractiveness are different concepts.
Comparing Two Investments With ROI
Suppose:
Investment A
Cost = $50,000
Net gain = $15,000
ROI = 30%
Investment B
Cost = $500,000
Net gain = $100,000
ROI = 20%
Investment A has higher ROI.
Investment B creates far more absolute profit.
If capital is scarce, A’s relative efficiency may be attractive.
If the investor can fund either and wants maximum total value, additional analysis is necessary.
ROI alone cannot resolve every capital-allocation decision.
ROI and Project Scale
ROI is a percentage, so it can hide scale.
A $100 investment earning $100 produces:
100% ROI
A $10 million investment earning $2 million produces:
20% ROI
The tiny project has the higher percentage.
The large project creates $1,999,900 more gain.
A business should therefore examine both:
percentage return
and:
absolute value created.
ROI and Capital Constraints
When capital is limited, relative return becomes more important.
Suppose a company has $1 million available and many competing projects.
ROI can provide a quick screening measure.
However, it still ignores cash-flow timing and project life.
For constrained capital budgeting, metrics such as profitability index and NPV across feasible project combinations can provide a more rigorous framework.
ROI and Reinvestment
Simple ROI generally does not specify what happens to interim cash flows.
Suppose an investment generates distributions every year.
If those distributions can be reinvested profitably, total wealth can grow faster than the simple ending ROI suggests.
If they sit idle, the result can be lower.
Compound annualized return calculations implicitly address compounding differently from simple cumulative ROI.
The treatment should match the decision being analyzed.
Forecast ROI vs Realized ROI
Forecast ROI uses expected benefits and costs.
Realized ROI uses actual outcomes.
Suppose a project is approved based on:
Expected investment = $100,000
Expected benefit = $140,000
Expected ROI:
40%
Actual cost rises to $120,000.
Actual benefit reaches only $135,000.
Actual net gain:
$15,000
Realized ROI:
$15,000 ÷ $120,000
ROI = 12.5%
The project remained profitable but performed far below forecast.
Post-investment reviews can reveal whether the original assumptions were realistic.
ROI Sensitivity Analysis
A return forecast should be tested against changing assumptions.
Suppose base-case ROI is 30%.
Management can test:
sales 20% lower;
costs 15% higher;
implementation delayed six months;
investment cost 10% higher;
customer retention lower;
or useful life shorter.
If modest adverse changes turn 30% ROI into a negative return, the project has a thin margin for forecasting error.
ROI Scenario Analysis
Scenario analysis changes several assumptions together.
A project might have:
Upside ROI = 60%
Base-case ROI = 25%
Downside ROI = −15%
The downside case provides information a single 25% forecast cannot.
Decision-makers can then evaluate both expected reward and potential loss.
Common ROI Mistakes
A common mistake is using revenue instead of net benefit in the numerator.
Another is excluding necessary implementation, maintenance, or working-capital costs from the investment.
Users also compare cumulative multi-year ROI with one-year returns without annualizing them.
Another mistake is treating the highest ROI as automatically the best investment while ignoring project scale.
Forecast ROI can also be mistaken for guaranteed return.
Some calculations ignore fees, taxes, or cash distributions.
Finally, simple ROI is frequently used where NPV or IRR would better capture the timing of multiple cash flows.
Limitations of ROI
ROI is popular because it is simple, intuitive, and flexible.
Those same characteristics create its limitations.
ROI does not have one universally standardized numerator.
It does not have one universally standardized investment-cost denominator.
It does not inherently account for time.
It does not discount future cash flows.
It does not automatically adjust for risk.
It can ignore interim distributions.
It can be distorted by omitted costs.
It can favor small high-percentage opportunities over larger projects that create more absolute value.
For serious capital allocation, ROI should therefore be one input rather than the only decision rule.
How to Calculate ROI Properly
First, define the investment clearly.
Include all economically relevant costs.
Then identify the benefits attributable to that investment.
Subtract the investment cost and other relevant costs to determine net return.
Calculate:
ROI = Net Return ÷ Investment Cost × 100
Next, state the measurement period.
If investments have different holding periods, calculate an annualized return where appropriate.
For projects with multiple cash flows across time, evaluate NPV and IRR.
Consider payback if recovery speed matters.
Review risk and downside scenarios.
Finally, compare forecast ROI with realized ROI after the investment has operated long enough to evaluate.
The formula is easy.
The quality of an ROI analysis depends on defining the economics behind the numerator, denominator, and time period correctly.
Why ROI Matters
ROI gives decision-makers an intuitive way to express investment performance:
ROI = Net Gain ÷ Investment Cost × 100
If a $100,000 investment creates $20,000 of net gain:
ROI = 20%
That simplicity makes ROI useful for equipment purchases, marketing, software, acquisitions, property, startups, and many other decisions.
Yet a percentage alone is never the complete investment story.
A 50% ROI over ten years is not equivalent to 50% in one year.
A 100% return on a $1,000 project can create less value than 15% on a $10 million project.
A positive ROI can still fall below an appropriate required return.
Therefore, the strongest use of ROI is not to identify the largest percentage automatically.
It is to establish a clear, comparable return measure and then interpret it alongside time, risk, cash flow, investment scale, and alternative uses of capital.
Frequently Asked Questions
What does ROI stand for?
ROI stands for return on investment. It measures an investment’s gain or loss relative to its cost.
What is the ROI formula?
A common formula is:
ROI = (Gain From Investment − Cost of Investment) ÷ Cost of Investment × 100
It can also be expressed as net return divided by investment cost.
How do you calculate ROI on $10,000?
If $10,000 grows to $12,500, the gain is $2,500:
ROI = $2,500 ÷ $10,000 × 100 = 25%
What does a 100% ROI mean?
A 100% ROI means the net gain equals the initial investment. A $10,000 investment with $10,000 of net gain has 100% ROI and $20,000 of total value or proceeds before other adjustments.
Can ROI be negative?
Yes. If the investment loses money, ROI is negative. A $10,000 investment that loses $2,000 produces a −20% ROI.
What is a good ROI?
There is no universal good ROI. The appropriate return depends on risk, holding period, liquidity, investment type, financing, opportunity cost, and available alternatives.
Does ROI include time?
Simple ROI does not inherently account for time. A 50% cumulative return over one year and 50% over ten years produce the same simple ROI even though their annualized economics differ substantially.
How do you annualize ROI?
For a multi-year total return:
Annualized Return = (1 + Total ROI)^(1 ÷ Years) − 1
This accounts for compounding.
What is the difference between ROI and ROE?
ROI is a broad investment-return measure. ROE specifically compares company net income with shareholders’ equity.
What is the difference between ROI and ROIC?
ROI can be used for almost any individual investment. ROIC specifically measures after-tax operating earnings relative to invested capital in a business.
What is the difference between ROI and IRR?
ROI measures gain relative to investment cost. IRR incorporates the timing of multiple project cash flows and calculates the discount rate at which NPV equals zero.
Is the investment with the highest ROI always best?
No. A higher percentage ROI can involve greater risk, longer holding periods, smaller absolute gains, lower liquidity, or less total value creation. Investment scale, time, risk, and cash-flow timing also matter.




