


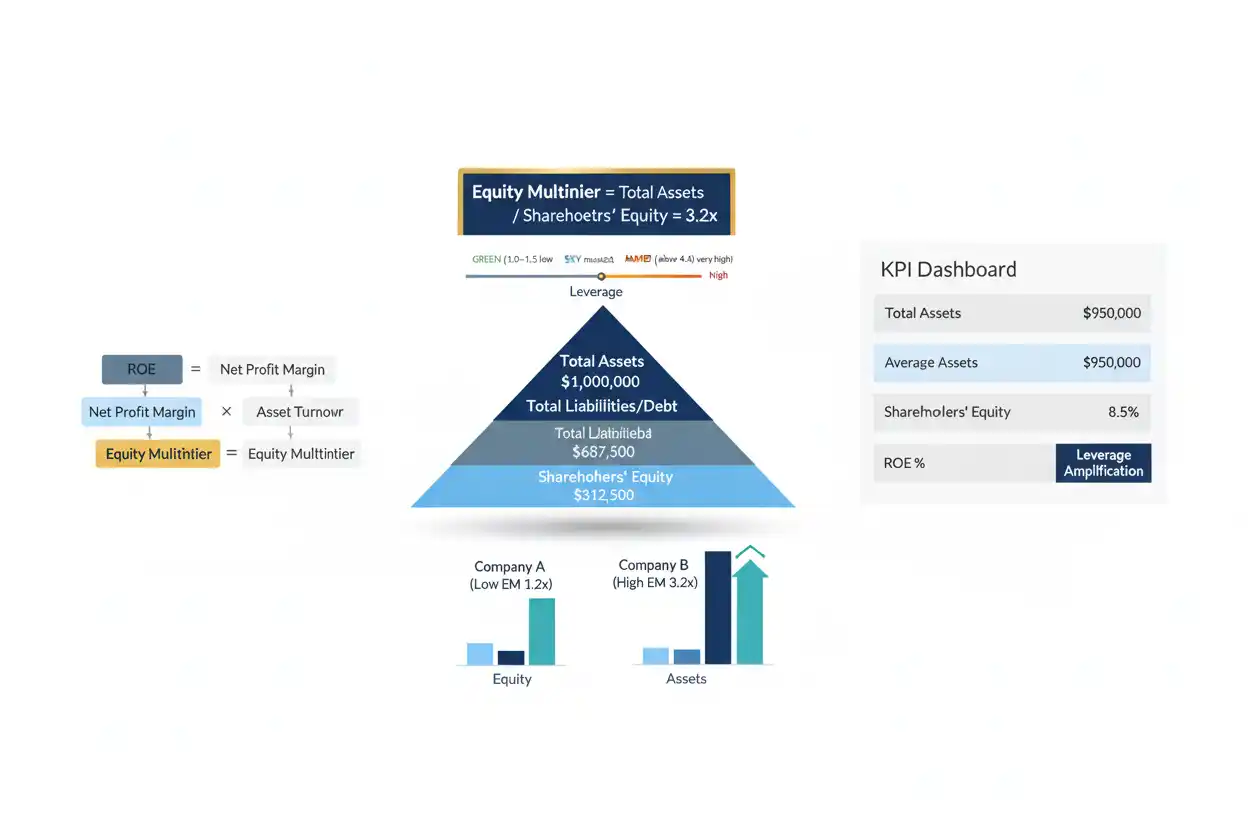
The equity multiplier measures how large a company’s asset base is relative to shareholders’ equity. It is a balance-sheet leverage ratio that helps show how much of the company’s assets are supported by equity versus other sources of financing.
The basic equity multiplier formula is:
Equity Multiplier = Total Assets ÷ Shareholders’ Equity
Suppose a company has $12 million of total assets and $4 million of shareholder equity.
Equity Multiplier = $12,000,000 ÷ $4,000,000
Equity Multiplier = 3.0
The company therefore has $3 of assets for every $1 of reported shareholder equity.
The same assets-to-equity relationship is sometimes described as a leverage ratio in corporate disclosures. SEC-filed financial reports have explicitly defined leverage as total assets divided by total equity or shareholders’ equity.
A higher equity multiplier generally indicates that more assets are supported by liabilities relative to equity. A lower multiplier generally indicates a larger equity cushion relative to the asset base.
However, the ratio does not reveal the type of liabilities, interest costs, maturity dates, cash flow, asset quality, or whether the leverage is economically productive.
Within business finance, the equity multiplier is therefore best treated as one dimension of financial leverage rather than a complete measure of financial risk.
What Is the Equity Multiplier?
The equity multiplier compares total assets with shareholder equity.
It answers a direct question:
How many dollars of assets does the company control for each dollar of accounting equity?
Suppose a company reports:
Total assets = $20 million
Shareholder equity = $10 million
Equity Multiplier = $20 million ÷ $10 million
Equity Multiplier = 2.0
The business controls $2 of reported assets for each $1 of shareholder equity.
Now consider another company with the same $20 million of assets but only $4 million of equity.
Equity Multiplier = $20 million ÷ $4 million
Equity Multiplier = 5.0
The second company has much more balance-sheet leverage.
That does not automatically mean it is a worse business. It means a smaller equity base supports the same amount of assets.
Equity Multiplier Formula
The standard point-in-time formula is:
Equity Multiplier = Total Assets ÷ Total Shareholders’ Equity
For an analysis that aligns with a period-based return calculation, average balances may be preferable:
Average Equity Multiplier = Average Total Assets ÷ Average Shareholders’ Equity
Average total assets can be calculated as:
Average Total Assets = (Beginning Assets + Ending Assets) ÷ 2
Likewise:
Average Shareholders’ Equity = (Beginning Equity + Ending Equity) ÷ 2
The average-balance approach is especially useful when connecting the equity multiplier with return on equity through DuPont analysis.
Basic Equity Multiplier Example
Suppose a business reports:
Total assets = $8,000,000
Total shareholder equity = $5,000,000
Then:
Equity Multiplier = $8,000,000 ÷ $5,000,000
Equity Multiplier = 1.60
For every $1 of book equity, the company has approximately $1.60 of assets.
Using the accounting equation:
Assets = Liabilities + Equity
Liabilities in this simplified example are:
Liabilities = $8,000,000 − $5,000,000
Liabilities = $3,000,000
The company’s asset base is therefore supported by $5 million of equity and $3 million of liabilities.
What Does an Equity Multiplier of 1 Mean?
An equity multiplier of exactly 1 means:
Total Assets = Shareholders’ Equity
Under the basic accounting equation, that implies liabilities equal zero.
Suppose:
Assets = $5 million
Equity = $5 million
Equity Multiplier = 1.0
The company’s reported asset base is entirely supported by equity in this simplified balance-sheet structure.
An equity multiplier cannot ordinarily fall below 1 when both assets and equity are positive and the standard accounting equation applies.
Unusual negative liabilities, classification issues, or other exceptional accounting situations would need separate analysis.
What Does an Equity Multiplier of 2 Mean?
An equity multiplier of 2 means assets equal twice shareholder equity.
Suppose:
Assets = $10 million
Equity = $5 million
Equity Multiplier = 2.0
Using:
Assets = Liabilities + Equity
liabilities are:
Liabilities = $10 million − $5 million
Liabilities = $5 million
The company’s assets are therefore supported equally by liabilities and shareholder equity in this simplified example.
What Does an Equity Multiplier of 3 Mean?
Suppose:
Assets = $15 million
Equity = $5 million
Equity Multiplier = 3.0
Liabilities are:
Liabilities = $15 million − $5 million
Liabilities = $10 million
The business has $3 of assets per $1 of equity, with $2 of liabilities for each $1 of equity under the total-liabilities interpretation.
This represents more balance-sheet leverage than an equity multiplier of 2.
Equity Multiplier and the Accounting Equation
The relationship becomes clearer when the accounting equation is rearranged:
Assets = Liabilities + Equity
Divide everything by equity:
Assets ÷ Equity = Liabilities ÷ Equity + Equity ÷ Equity
Therefore:
Equity Multiplier = 1 + (Total Liabilities ÷ Equity)
This equation shows why the equity multiplier increases as liabilities become larger relative to shareholder equity.
However, total liabilities should not automatically be treated as the same thing as interest-bearing debt.
Accounts payable, accrued expenses, deferred revenue, taxes payable and other liabilities can be included in total liabilities even though they are not conventional borrowing.
Equity Multiplier vs Debt-to-Equity Ratio
The debt-to-equity ratio compares debt with shareholder equity.
Debt-to-Equity Ratio = Debt ÷ Equity
The equity multiplier compares total assets with equity:
Equity Multiplier = Assets ÷ Equity
If a debt-to-equity calculation uses total liabilities as its numerator, the accounting identity produces:
Equity Multiplier = 1 + Liabilities-to-Equity Ratio
But if debt-to-equity includes only interest-bearing debt, the relationship is not exact because other liabilities are excluded.
This is why ratio definitions need to remain explicit.
Equity Multiplier vs Debt Ratio
The debt ratio compares debt with total assets.
The equity multiplier uses total assets divided by equity.
A company can therefore appear leveraged through both measures, but the ratios examine different relationships.
Suppose:
Assets = $10 million
Equity = $4 million
Interest-bearing debt = $3 million
Equity multiplier:
$10 million ÷ $4 million = 2.5
Debt ratio:
$3 million ÷ $10 million = 30%
The remaining liabilities are not captured by the debt-ratio numerator if that ratio is defined strictly as interest-bearing debt.
One ratio should not be mechanically converted into the other without matching definitions.
Equity Multiplier vs Financial Leverage
The financial leverage concept is broader than the equity multiplier.
The equity multiplier is one balance-sheet expression of leverage.
Financial leverage can also be examined through debt-to-equity, debt ratios, fixed financing costs, interest coverage, and the sensitivity of shareholder earnings to operating performance.
A high equity multiplier generally indicates greater leverage, but it does not tell you what that leverage costs or how risky the financing structure is.
The master plan therefore assigns the broader financial-leverage intent to its own dedicated page rather than folding it into this one.
Equity Multiplier and Return on Equity
The equity multiplier is especially important because of its connection with return on equity.
A common ROE formula is:
ROE = Net Income ÷ Average Shareholders’ Equity
A current 2026 SEC filing uses this same broad relationship, defining return on equity from annualized net income relative to average shareholder equity.
Because a smaller equity base increases financial leverage, the equity multiplier helps explain why two companies with identical asset profitability can report different ROE.
That connection is formalized through DuPont analysis.
Equity Multiplier in DuPont Analysis
A three-part DuPont decomposition expresses return on equity as:
ROE = Net Profit Margin × Asset Turnover × Equity Multiplier
where:
Net Profit Margin = Net Income ÷ Revenue
Asset Turnover = Revenue ÷ Average Assets
Equity Multiplier = Average Assets ÷ Average Equity
Multiplying the three terms gives:
ROE = (Net Income ÷ Revenue) × (Revenue ÷ Assets) × (Assets ÷ Equity)
Revenue cancels.
Assets cancel.
The result is:
ROE = Net Income ÷ Equity
SEC-filed analytical materials have described ROE through return on assets and leverage, and SEC materials also contain DuPont analyses that explicitly combine asset turnover with financial leverage in assessing return on equity.
DuPont Analysis Example
Suppose a company has:
Net profit margin = 8%
Asset turnover = 1.5
Equity multiplier = 2.0
Then:
ROE = 8% × 1.5 × 2.0
ROE = 24%
The company generates 24% return on equity under the simplified decomposition.
Now assume the same profit margin and asset turnover but an equity multiplier of 3.
ROE = 8% × 1.5 × 3.0
ROE = 36%
The higher leverage amplifies the return generated on the shareholder equity base.
However, leverage is not free. Additional liabilities or borrowing can create financing costs and financial risk, which may also affect net profit margin.
Equity Multiplier and Return on Assets
Return on assets provides another way to understand the relationship.
A simplified ROA formula is:
ROA = Net Income ÷ Average Total Assets
Because:
Equity Multiplier = Average Assets ÷ Average Equity
then:
ROE = ROA × Equity Multiplier
Suppose ROA is 10% and the equity multiplier is 2.
ROE = 10% × 2
ROE = 20%
If the multiplier increases to 3 while ROA remains unchanged:
ROE = 10% × 3
ROE = 30%
This demonstrates mathematically how leverage can amplify shareholder returns.
It also amplifies weak or negative returns when operating performance deteriorates.
Equity Multiplier and Asset Turnover
Asset turnover measures revenue relative to assets.
The equity multiplier then describes how those assets are financed relative to equity.
Consider two companies.
Company A:
Asset turnover = 2.0
Equity multiplier = 1.5
Company B:
Asset turnover = 0.8
Equity multiplier = 4.0
Company A relies less on leverage but uses its assets more intensively to produce revenue.
Company B relies more heavily on leverage while turning its assets more slowly.
Both dimensions matter when explaining ROE.
Equity Multiplier and Net Profit Margin
Net profit margin is the first component of the three-part DuPont framework.
A company can achieve high ROE through:
strong margins,
efficient asset utilization,
greater financial leverage,
or a combination.
These sources should not be treated as equally desirable automatically.
Suppose two businesses both report 20% ROE.
Company A earns high margins with modest leverage.
Company B earns thin margins but uses an extremely high equity multiplier.
The headline shareholder return is identical, but the risk and operating economics can differ substantially.
Equity Multiplier and Operating Margin
Operating margin looks at profitability before financing and tax effects.
The equity multiplier looks at financing structure.
Together they help distinguish operating strength from leverage-driven shareholder returns.
A business with strong operating margins and modest leverage may generate attractive returns primarily through operations.
Another with weak operating margins can produce high ROE because a very small equity base supports a large asset base.
The second result deserves more scrutiny.
Equity Multiplier and EBIT
EBIT measures earnings before interest and taxes.
The equity multiplier does not use EBIT directly, but EBIT helps determine whether the leveraged asset base is producing enough operating earnings.
Suppose two companies have an equity multiplier of 3.
Company A produces $10 million of EBIT.
Company B produces $2 million on a similar asset base.
Their leverage is similar, but their operating earnings capacity is dramatically different.
A leverage ratio should therefore be connected with profitability.
Equity Multiplier and EBITDA
EBITDA provides another operating-earnings perspective before depreciation and amortization.
The master workbook directly links EBITDA to the equity-multiplier page because leverage needs an earnings context.
However, EBITDA does not reveal whether a company’s large asset base requires substantial recurring capital investment.
A high equity multiplier paired with high EBITDA can still create risk when capital expenditures, interest expense, or cash conversion are demanding.
Equity Multiplier and Economic Value Added
Economic value added asks whether operating returns exceed the cost of invested capital.
The equity multiplier asks how much asset base is supported by each dollar of equity.
More leverage can increase ROE without necessarily increasing economic value.
Suppose leverage raises ROE from 12% to 18%, but the company invests additional capital in low-return assets.
The higher shareholder return ratio does not prove that the new investment creates value.
EVA and other capital-return measures therefore provide a useful counterweight to leverage-driven ROE.
Equity Multiplier and Return on Invested Capital
Return on invested capital focuses on the operating return generated from capital invested by debt and equity providers.
The equity multiplier focuses specifically on the asset-to-equity relationship.
A company can raise its equity multiplier by adding debt-financed assets.
If those new assets produce weak incremental returns, ROIC can deteriorate even while ROE rises initially.
This distinction is central to disciplined capital allocation.
Equity Multiplier and Return on Capital Employed
Return on capital employed evaluates operating returns relative to capital employed under its particular formula.
Again, the equity multiplier does not measure whether assets generate adequate returns.
It measures the amount of assets supported by each unit of equity.
A large asset base is economically useful only when those assets produce sufficient operating returns.
Equity Multiplier and Operating Leverage
Operating leverage should not be confused with the equity multiplier.
Operating leverage comes from fixed operating costs.
The equity multiplier reflects balance-sheet financing.
A company can have high operating leverage and low financial leverage.
Another can have flexible operating costs but heavy debt financing.
The first structure creates operating earnings sensitivity.
The second creates capital-structure risk.
Equity Multiplier and Degree of Combined Leverage
The degree of combined leverage combines operating and financing sensitivity in an earnings framework.
The equity multiplier does not measure earnings sensitivity directly.
Suppose two businesses have the same equity multiplier.
One pays very little interest because its liabilities are mostly non-interest-bearing.
The other carries expensive debt.
Their balance-sheet multipliers may be identical while their financial earnings sensitivity differs substantially.
That is why the multiplier cannot replace combined-leverage analysis.
Equity Multiplier and Interest Coverage
Interest coverage answers a question the equity multiplier cannot:
Can operating earnings cover interest expense?
Suppose two companies each report an equity multiplier of 4.
Company A has EBIT of $10 million and interest expense of $1 million.
Interest Coverage = 10×
Company B has EBIT of $2 million and interest expense of $1 million.
Interest Coverage = 2×
The same assets-to-equity leverage can therefore correspond with very different debt-service capacity.
High Equity Multiplier
A high equity multiplier generally indicates a relatively small equity base compared with total assets.
Potential causes include debt financing, accounts payable, accrued liabilities, deferred obligations, share repurchases, accumulated losses, or a naturally leveraged business model.
A high multiplier can increase ROE when assets produce positive returns.
However, it can also increase shareholder risk because the equity cushion available to absorb losses is smaller.
The cause matters more than the number alone.
Low Equity Multiplier
A low equity multiplier means shareholders finance a relatively large portion of the asset base.
Potential advantages can include lower balance-sheet leverage and a larger equity cushion.
However, a low multiplier does not guarantee superior financial performance.
A company can be conservatively financed while using assets inefficiently or earning poor margins.
The ratio describes financing structure, not management quality.
What Is a Good Equity Multiplier?
There is no universal good equity multiplier.
A capital-light consulting company can operate with a very different balance sheet from a bank, insurer, utility, property business, retailer, or industrial manufacturer.
Financial businesses in particular can report large assets relative to equity because leverage is structurally embedded in their business models. SEC filings from financial institutions have long reported total-assets-to-equity leverage ratios as important capital measures.
Meaningful comparison therefore requires similar industries, accounting structures, business models, and regulatory environments.
Equity Multiplier by Industry
Industry differences can be substantial.
A software company may require limited physical assets and operate with relatively little debt.
A utility can own billions of dollars of infrastructure financed through a mix of debt and equity.
A bank’s balance sheet is structurally dominated by financial assets and liabilities.
A retailer can use supplier credit heavily.
These businesses should not be ranked using a single universal equity-multiplier threshold.
Peer comparison becomes useful only when the underlying economics are genuinely comparable.
Equity Multiplier for Banks
Banks and similar financial institutions require particular caution.
A high assets-to-equity ratio is part of how traditional banking models operate, while regulators impose specialized capital requirements.
The ordinary corporate equity multiplier therefore should not be interpreted in isolation.
Regulatory capital ratios, asset quality, liquidity, funding structure, and risk-weighted assets can be more relevant than a generic industrial-company leverage benchmark.
Equity Multiplier for Asset-Light Businesses
Asset-light businesses often require fewer physical assets to generate revenue.
They may therefore have relatively small asset bases and substantial equity relative to assets.
A low multiplier can result.
However, asset-light does not automatically mean low risk.
Customer concentration, competitive pressure, intangible investment, and revenue volatility can remain significant.
The equity multiplier captures balance-sheet leverage, not total business risk.
Equity Multiplier for Capital-Intensive Businesses
Manufacturing, transport, energy, telecommunications, utilities, and infrastructure companies often require substantial assets.
Those assets can be financed partly with long-term borrowing.
Consequently, equity multipliers can be higher.
The critical questions become whether assets generate adequate returns, how debt is structured, and whether cash flows can support financing obligations.
How Debt Financing Changes the Equity Multiplier
Suppose a company begins with:
Assets = $10 million
Equity = $6 million
Equity Multiplier = $10 million ÷ $6 million
≈ 1.67
The company borrows $3 million and holds the proceeds in cash.
Assets rise to $13 million.
Equity remains $6 million.
New Equity Multiplier = $13 million ÷ $6 million
≈ 2.17
The multiplier rises because more assets are supported without additional shareholder equity.
Buying Assets With Debt
Suppose the same $3 million loan is immediately used to purchase equipment.
Assets still increase to $13 million.
Debt increases by $3 million.
Equity stays unchanged.
Equity Multiplier ≈ 2.17
Whether the leverage proves economically useful depends on what return the equipment eventually produces.
The multiplier tells us that leverage increased.
It does not tell us whether the investment was wise.
How Debt Repayment Changes the Equity Multiplier
Suppose:
Assets = $15 million
Equity = $5 million
Equity Multiplier = 3.0
The company uses $3 million of cash to repay debt.
Assets fall to $12 million.
Equity remains $5 million in this simplified transaction.
New Equity Multiplier = $12 million ÷ $5 million
= 2.4
Debt repayment reduced balance-sheet leverage.
How an Equity Issue Changes the Multiplier
Suppose:
Assets = $15 million
Equity = $5 million
Equity Multiplier = 3.0
The company issues $5 million of new equity and initially holds the proceeds as cash.
Assets become $20 million.
Equity becomes $10 million.
New Equity Multiplier = $20 million ÷ $10 million
= 2.0
The company has more assets but substantially less financial leverage relative to shareholder equity.
Share Buybacks and the Equity Multiplier
Share repurchases can increase the equity multiplier because they reduce both cash and shareholder equity.
Suppose:
Assets = $20 million
Equity = $10 million
Equity Multiplier = 2.0
The company uses $4 million of cash for a share repurchase.
For this simplified example:
New assets = $16 million
New equity = $6 million
New Equity Multiplier = $16 million ÷ $6 million
≈ 2.67
The company did not borrow additional money.
Yet its assets are now supported by a smaller equity base, increasing the multiplier.
Dividends and the Equity Multiplier
Cash dividends can create a similar mathematical effect.
Suppose assets are $10 million and equity is $6 million.
Equity Multiplier ≈ 1.67
The company pays a $2 million cash dividend.
Simplifying the accounting effect:
Assets fall to $8 million.
Equity falls to $4 million.
New Equity Multiplier = $8 million ÷ $4 million
= 2.0
The payout increases financial leverage relative to equity even though debt itself did not increase.
Retained Earnings and the Equity Multiplier
Profitable operations retained within the business can increase shareholder equity.
Suppose assets and equity rise through retained earnings while liabilities remain stable.
The multiplier can decline because shareholder capital becomes a larger portion of the balance sheet.
For example:
Initial assets = $10 million
Initial equity = $4 million
Initial Multiplier = 2.5
After retained profit increases assets and equity by $2 million:
Assets = $12 million
Equity = $6 million
New Multiplier = 2.0
The company became less leveraged relative to equity.
Operating Losses and the Equity Multiplier
Losses reduce retained earnings and therefore shareholder equity.
Suppose assets are $10 million and equity is $5 million.
Equity Multiplier = 2.0
The business incurs a $2 million loss that reduces assets and equity to $8 million and $3 million in this simplified example.
New Equity Multiplier = $8 million ÷ $3 million
≈ 2.67
The company became more leveraged even though it did not borrow additional money.
The equity cushion simply became smaller.
Asset Write-Downs
Asset impairments can also increase the equity multiplier when the write-down reduces shareholder equity.
Suppose:
Assets = $20 million
Liabilities = $12 million
Equity = $8 million
Equity Multiplier = 2.5
A $4 million impairment reduces assets and equity:
Assets = $16 million
Equity = $4 million
New Equity Multiplier = $16 million ÷ $4 million
= 4.0
The company’s nominal liabilities did not increase.
However, the asset and equity cushion supporting those liabilities became much smaller.
Equity Multiplier With Negative Equity
The equity multiplier becomes difficult to interpret when shareholder equity is negative.
Suppose:
Assets = $5 million
Equity = −$1 million
A mechanical calculation gives:
Equity Multiplier = $5 million ÷ −$1 million
= −5
A negative multiplier does not indicate unusually low leverage.
Negative equity generally means reported liabilities exceed reported assets.
The conventional positive-ratio interpretation therefore breaks down.
Analysts should inspect the balance sheet directly rather than ranking a negative multiplier against positive companies.
Equity Multiplier When Equity Is Near Zero
The ratio can become extremely large when shareholder equity approaches zero.
Suppose assets equal $10 million.
At $2 million of equity:
Equity Multiplier = 5
At $500,000 of equity:
Equity Multiplier = 20
At $100,000:
Equity Multiplier = 100
Assets barely changed.
The denominator collapsed.
This mathematical sensitivity is a major limitation of the equity multiplier.
What Happens When Equity Is Zero?
If shareholder equity equals zero:
Equity Multiplier = Total Assets ÷ 0
The ratio is undefined.
There is no meaningful finite multiplier because division by zero is impossible.
Any analysis should move directly to the underlying assets, liabilities, earnings, and solvency position.
Average Equity Multiplier Example
Period-based profitability analysis is often stronger when average balances are used.
Suppose:
Beginning assets = $10 million
Ending assets = $14 million
Average Assets = ($10 million + $14 million) ÷ 2
= $12 million
Beginning equity = $5 million
Ending equity = $7 million
Average Equity = ($5 million + $7 million) ÷ 2
= $6 million
Average equity multiplier:
Average Equity Multiplier = $12 million ÷ $6 million
= 2.0
This can align more naturally with annual net income when performing DuPont analysis.
Why Period-End Equity Multiplier Can Mislead
Suppose a business raises substantial equity one day before year-end.
Ending equity increases dramatically.
The year-end equity multiplier falls.
Yet the company operated with a much smaller equity base during almost the entire year.
Using the year-end ratio to explain annual ROE can therefore misrepresent the capital structure supporting the period’s earnings.
Average balance-sheet values can reduce that mismatch.
Equity Multiplier and Free Cash Flow
Free cash flow adds an important cash dimension.
A company can maintain a high equity multiplier and still generate strong free cash flow.
Another can have low leverage but consistently consume cash.
The multiplier only describes how assets relate to equity.
It does not measure whether the assets generate cash after operating and investment requirements.
Equity Multiplier and Operating Cash Flow
Operating cash flow shows how much cash operations generate or consume.
A heavily leveraged asset base supported by strong, predictable operating cash flow can be more manageable than the same multiplier attached to volatile or negative cash generation.
This is why balance-sheet leverage should always be connected with cash-flow capacity.
Equity Multiplier and Working Capital
Working capital affects the asset and liability structure beneath the multiplier.
Inventory and receivables increase current assets.
Accounts payable and accrued operating obligations increase liabilities.
A company can therefore change its equity multiplier through working-capital expansion even without conventional new borrowing.
Understanding the balance-sheet components prevents leverage analysis from becoming too simplistic.
Equity Multiplier and Current Ratio
The current ratio measures current assets relative to current liabilities.
The equity multiplier uses total assets and shareholder equity.
A company can therefore have a high equity multiplier and strong current ratio when much of its financing is long term.
Another can have a modest multiplier and poor current liquidity.
Leverage and liquidity answer different questions.
Equity Multiplier and Quick Ratio
The quick ratio narrows short-term liquidity toward more liquid assets.
A company’s equity multiplier might appear reasonable while much of the asset base consists of inventory or other less liquid assets.
The quick ratio can reveal whether near-term obligations have adequate liquid-asset coverage.
That information is absent from the equity multiplier.
Equity Multiplier and Cash Ratio
The cash ratio is even more restrictive, focusing primarily on cash and cash equivalents relative to current liabilities.
A business can control billions of dollars of assets and report a high multiplier while maintaining very little immediate cash.
Asset scale is not the same as liquidity.
Equity Multiplier and Cash Flow Forecasting
Cash flow forecasting addresses the timing problem that the multiplier ignores.
Suppose a company has an equity multiplier of 3 and appears financially stable.
A large debt maturity is due in six months.
The multiplier does not change simply because that date approaches.
The cash forecast can reveal whether the company will have enough liquidity or need refinancing.
Equity Multiplier and Business Valuation
Business valuation cannot be determined from the equity multiplier.
A high multiplier can increase shareholder returns when assets produce strong returns.
It can also increase financial risk and reduce equity value when asset returns deteriorate.
Valuation requires expected cash flow, growth, risk, capital structure, and required returns.
The multiplier provides useful capital-structure context rather than a valuation result.
Equity Multiplier and Startup Valuation
Startup valuation often involves businesses with limited asset bases and substantial equity financing.
An early-stage company may have a relatively low multiplier because conventional debt is limited.
As the business matures, it may introduce loans, equipment financing, working-capital facilities, or other liabilities.
The multiplier can then increase.
However, startup value depends much more on expected growth, economics, risk, and financing terms than on one leverage ratio.
Can a Higher Equity Multiplier Increase ROE?
Yes, mathematically, when return on assets remains positive and other conditions are held constant.
Because:
ROE = ROA × Equity Multiplier
if ROA is 8%:
At an equity multiplier of 2:
ROE = 8% × 2 = 16%
At a multiplier of 3:
ROE = 8% × 3 = 24%
However, real-world leverage can create additional interest costs and risk that reduce net income and therefore ROA.
The multiplier cannot be increased in isolation without considering those effects.
Can Leverage Reduce ROE?
Yes.
Suppose a company borrows at a high cost and invests the money in assets producing inadequate returns.
Interest reduces net income.
Asset returns can weaken.
Even though the equity multiplier rises, ROE can decline.
Leverage improves shareholder returns only when the economics of the financed activity are sufficiently favorable.
Equity Multiplier and Economic Risk
A high multiplier means losses are absorbed by a smaller equity cushion relative to assets.
Suppose:
Assets = $100 million
Equity = $20 million
Equity Multiplier = 5
A $10 million asset-value loss represents:
$10 million ÷ $20 million Equity = 50%
of the original equity base.
Now consider the same $100 million of assets supported by $50 million of equity.
Equity Multiplier = 2
The same $10 million loss equals:
$10 million ÷ $50 million = 20%
of equity.
This simple example demonstrates why leverage can magnify the economic impact of asset losses on shareholders.
Equity Multiplier Trend Analysis
Suppose a company’s multiplier changes:
Year 1 = 1.8
Year 2 = 2.2
Year 3 = 3.1
Financial leverage relative to equity is increasing.
Possible causes include borrowing, growth in other liabilities, share repurchases, losses, dividends, or asset expansion without equivalent equity growth.
Now suppose the ratio falls from 4.0 to 2.5.
Possible explanations include debt repayment, new equity issuance, retained earnings, or restructuring.
The trend identifies a change.
The balance sheet explains why.
Increasing Equity Multiplier Without More Debt
A company does not need to borrow more for its equity multiplier to rise.
Share buybacks can reduce equity.
Losses can reduce retained earnings.
Asset write-downs can shrink equity.
Cash dividends can lower equity.
Other liabilities can increase.
This is why saying “high equity multiplier equals high debt” is too simplistic.
The multiplier measures assets relative to equity, not interest-bearing debt directly.
Lowering the Equity Multiplier
A company can lower the multiplier by strengthening equity relative to assets or reducing assets financed through liabilities.
Possible mechanisms include debt repayment using assets, retaining earnings, raising new equity, or disposing of assets and using proceeds to reduce liabilities.
The economic merit depends on the situation.
A company should not issue unnecessary equity merely to make the ratio appear lower.
Capital structure should support the underlying business strategy.
Is a Lower Equity Multiplier Always Safer?
Usually, lower balance-sheet leverage provides a larger equity cushion, all else equal.
But total financial risk depends on much more.
A low-multiplier company can have volatile sales, weak margins, customer concentration, poor cash flow, or unproductive assets.
A higher-multiplier regulated utility can have very stable cash generation.
Financial risk therefore cannot be ranked from the multiplier alone.
Common Equity Multiplier Mistakes
One mistake is treating the equity multiplier as identical to debt-to-equity.
Another is assuming all liabilities represent interest-bearing debt.
Analysts may also compare financial institutions with ordinary operating companies without considering business-model differences.
Using period-end assets and equity to explain annual ROE when balances changed dramatically can distort DuPont analysis.
Negative or near-zero shareholder equity creates another major problem because the multiplier becomes negative, undefined, or extremely large.
Finally, a higher ROE caused by leverage should not automatically be interpreted as better operating performance.
Limitations of the Equity Multiplier
The equity multiplier compresses an entire balance sheet into one number.
It does not distinguish debt from accounts payable.
It does not show interest expense.
It does not reveal maturity dates.
It does not measure asset quality.
It ignores cash generation.
It can be distorted when shareholder equity is very small or negative.
Accounting changes, impairments, acquisitions, buybacks, dividends, and accumulated losses can all alter the ratio.
Its simplicity makes it useful, but that simplicity also defines its limitations.
How to Analyze the Equity Multiplier Properly
Start with:
Equity Multiplier = Total Assets ÷ Shareholders’ Equity
Check whether point-in-time or average balances are appropriate.
Then compare the multiplier with prior periods and genuinely similar businesses.
Review the liabilities supporting the asset base.
Separate interest-bearing debt from operating liabilities.
Compare the result with debt-to-equity and debt ratio.
Next, examine ROA and ROE through DuPont analysis.
Review asset turnover and profit margins to determine whether shareholder returns come from operating strength or leverage.
Then examine interest coverage and cash flow.
Finally, determine whether the leveraged asset base is producing returns sufficient to justify its financial risk.
The objective is not to minimize or maximize the multiplier.
It is to understand how much financial leverage supports the business, why that leverage exists, and whether the assets financed by it generate adequate returns and cash flow.
Frequently Asked Questions
What is the equity multiplier?
The equity multiplier is a leverage ratio comparing total assets with shareholder equity.
What is the equity multiplier formula?
Equity Multiplier = Total Assets ÷ Shareholders’ Equity
What does an equity multiplier of 1 mean?
It means total assets equal shareholder equity. Under the standard accounting equation, liabilities would be zero in the simplified balance-sheet relationship.
What does an equity multiplier of 2 mean?
It means the company has approximately $2 of assets for each $1 of shareholder equity.
Is a high equity multiplier bad?
Not automatically. It indicates greater assets-to-equity leverage, but financial risk depends on asset quality, liability structure, cash flow, financing costs, and industry economics.
Is a low equity multiplier good?
A lower multiplier generally means a larger equity cushion relative to assets, but it does not guarantee strong profitability or efficient capital use.
What is a good equity multiplier?
There is no universal ideal. Appropriate leverage varies substantially by industry and business model.
How is the equity multiplier related to ROE?
In a simplified relationship:
ROE = ROA × Equity Multiplier
It is also the leverage component of the three-step DuPont framework.
What is the DuPont formula using the equity multiplier?
ROE = Net Profit Margin × Asset Turnover × Equity Multiplier
Is equity multiplier the same as debt-to-equity?
No. Equity multiplier divides assets by equity, while debt-to-equity divides a defined amount of debt or liabilities by equity.
Can the equity multiplier be negative?
Yes, mathematically, when shareholder equity is negative. However, conventional leverage interpretation becomes unreliable in that situation.
What happens if shareholder equity is zero?
The equity multiplier is undefined because total assets cannot be divided by zero.
Final Perspective
The equity multiplier is a simple formula with important implications:
Equity Multiplier = Total Assets ÷ Shareholders’ Equity
A multiplier of 2 means the company controls approximately $2 of assets for every $1 of equity.
A multiplier of 5 means the same equity dollar supports a much larger asset base.
That additional leverage can magnify shareholder returns when assets perform well.
It can also magnify the impact of losses.
Through DuPont analysis:
ROE = Net Profit Margin × Asset Turnover × Equity Multiplier
the multiplier shows that strong ROE can originate from more than profitability.
A company may earn attractive shareholder returns because it has excellent margins, productive assets, substantial financial leverage, or some combination of all three.
The ratio is therefore most useful when it leads to the next questions:
What liabilities support these assets? What do those liabilities cost? How efficiently are the assets used? What return do they generate? How much cash does the business produce? And how much of the reported ROE comes from genuine operating performance rather than leverage?
Answering those questions turns the equity multiplier from a simple balance-sheet calculation into a useful diagnostic of capital structure and shareholder risk.




