


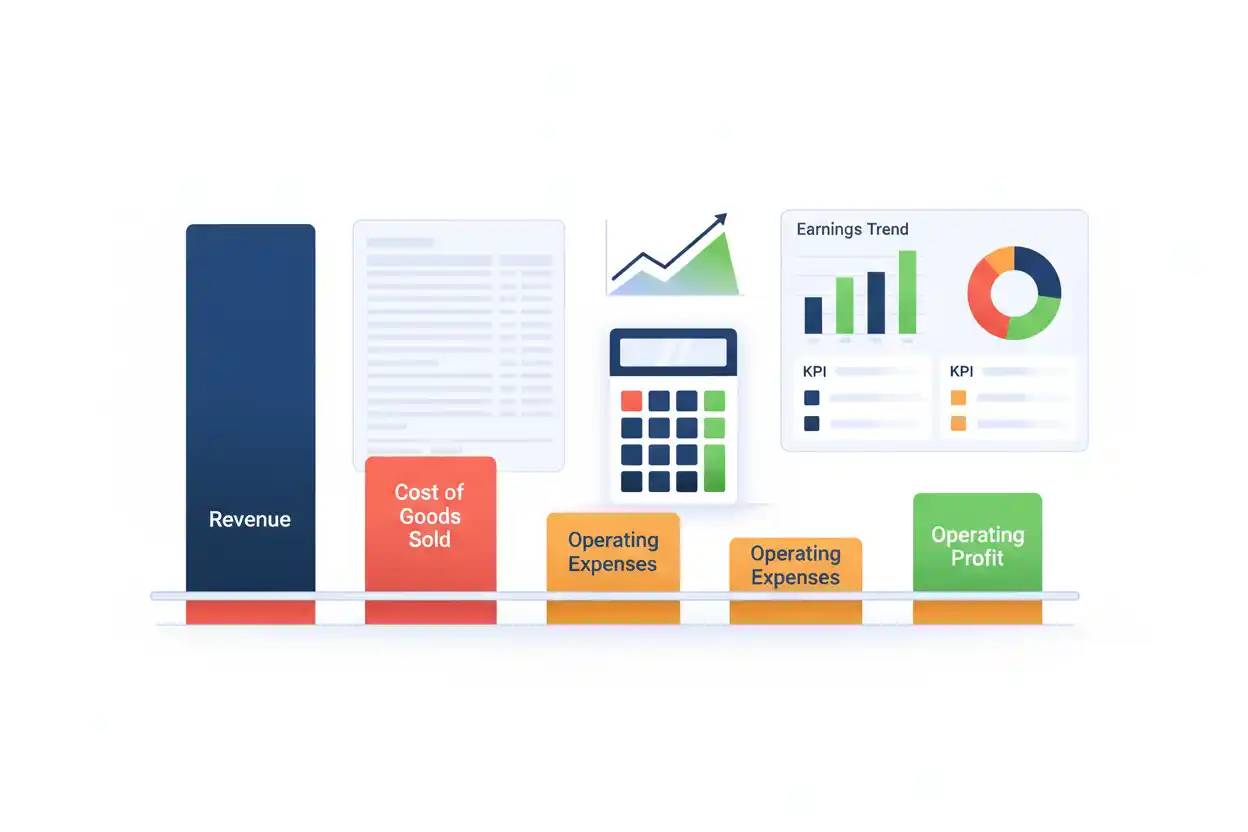
Operating profit is the earnings a business generates from its operations after subtracting the costs associated with producing its goods or services and its operating expenses. It focuses on the profitability of the operating business before moving to the final bottom-line effects of items such as interest and income taxes.
Suppose a company generates $2 million of revenue, incurs $1.1 million of cost of goods sold, and has $600,000 of operating expenses.
Operating Profit = $2,000,000 − $1,100,000 − $600,000
Operating Profit = $300,000
The business therefore generates $300,000 of operating profit from the period’s reported operations.
Operating profit is particularly useful within business finance because it separates core operating economics from some financing and tax effects. It can help answer whether the underlying business model is profitable before considering how the company is financed.
What Is Operating Profit?
Operating profit is the amount remaining after subtracting operating costs from revenue.
A simplified income statement progresses like this:
Revenue
− Cost of goods sold
= Gross profit
− Operating expenses
= Operating profit
The basic formula is:
Operating Profit = Revenue − Cost of Goods Sold − Operating Expenses
Alternatively, if gross profit is already known:
Operating Profit = Gross Profit − Operating Expenses
The exact financial-statement presentation can differ among companies, so the reported operating-income subtotal should be used when available rather than forcing every business into an identical simplified formula.
The dedicated operating margin page converts this dollar operating-profit amount into a percentage of revenue.
Operating Profit Formula
The standard simplified operating profit formula is:
Operating Profit = Revenue − COGS − Operating Expenses
Where:
Revenue represents sales or other operating revenue recognized for the period.
COGS, or cost of goods sold, represents the costs assigned to the goods or services sold under the company’s accounting framework.
Operating expenses represent costs incurred in running the business that are recognized before operating profit.
If gross profit has already been calculated:
Operating Profit = Gross Profit − Operating Expenses
These two formulations describe the same simplified income-statement progression.
How to Calculate Operating Profit
Suppose a business reports:
Revenue = $5,000,000
Cost of goods sold = $2,800,000
Selling expenses = $650,000
General and administrative expenses = $550,000
Other operating expenses = $200,000
First calculate total operating expenses other than COGS:
Operating Expenses = $650,000 + $550,000 + $200,000
Operating Expenses = $1,400,000
Now calculate operating profit:
Operating Profit = $5,000,000 − $2,800,000 − $1,400,000
Operating Profit = $800,000
The company therefore generates $800,000 of operating profit.
Its operating margin would be:
Operating Margin = $800,000 ÷ $5,000,000 × 100
Operating Margin = 16%
Operating profit is the dollar amount. Operating margin expresses that same operating earnings level relative to revenue.
Operating Profit Example
Consider a retailer reporting:
Net sales = $1,500,000
Cost of merchandise sold = $900,000
Payroll and administrative expense = $250,000
Rent and utilities = $100,000
Marketing = $60,000
Gross profit is:
Gross Profit = $1,500,000 − $900,000
Gross Profit = $600,000
Total operating expenses after gross profit are:
$250,000 + $100,000 + $60,000 = $410,000
Operating profit becomes:
Operating Profit = $600,000 − $410,000
Operating Profit = $190,000
The retailer therefore earns $190,000 before moving to applicable non-operating, financing, and tax items below the operating-profit level.
Operating Profit From Gross Profit
If the income statement already provides gross profit, the calculation becomes simpler.
Suppose:
Gross profit = $900,000
Operating expenses = $620,000
Then:
Operating Profit = $900,000 − $620,000
Operating Profit = $280,000
This is why understanding gross profit is useful before analyzing operating profit.
Gross profit answers:
What remains after the cost associated with producing or acquiring what was sold?
Operating profit asks:
What remains after the broader operating expenses are also deducted?
Operating Profit and Revenue
Revenue forms the top line from which operating profit ultimately emerges.
Increasing revenue can increase operating profit, but only if the associated costs do not rise by the same amount or more.
Suppose revenue rises by $500,000.
If the costs required to generate that additional revenue rise by $350,000:
Incremental Operating Profit = $500,000 − $350,000
Incremental Operating Profit = $150,000
However, if costs rise by $550,000:
Incremental Operating Profit = $500,000 − $550,000
Incremental Operating Profit = −$50,000
Sales growth therefore does not automatically mean operating-profit growth.
The economics of the additional sales matter.
Operating Profit and Cost of Goods Sold
Cost of goods sold directly affects gross profit and therefore the amount available to become operating profit.
Suppose revenue remains $4 million.
Original COGS = $2.2 million
New COGS = $2.5 million
The $300,000 increase in COGS reduces gross profit by $300,000.
If operating expenses remain unchanged, operating profit also falls by $300,000.
Changes in supplier pricing, manufacturing costs, labor, product mix, freight, materials, inventory accounting, and efficiency can therefore flow through to operating earnings.
Operating Profit and Gross Margin
Gross margin shows how much gross profit remains from each revenue dollar before operating expenses.
Suppose:
Revenue = $10 million
Gross margin = 50%
Gross profit is:
$10 million × 50% = $5 million
If operating expenses equal $3.5 million:
Operating Profit = $5 million − $3.5 million
Operating Profit = $1.5 million
A strong gross margin creates more room to cover operating expenses and generate operating profit.
However, high gross margin does not guarantee high operating profit.
A company can have excellent product economics but spend heavily on sales, marketing, research, administration, or infrastructure.
Operating Profit and Fixed Costs
Fixed costs can materially affect operating profit because many operating expenses remain relatively stable across a range of sales activity.
Suppose a business has:
Contribution margin = $700,000
Fixed operating costs = $500,000
Then:
Operating Profit = $700,000 − $500,000
Operating Profit = $200,000
If contribution margin increases to $900,000 while fixed operating costs remain at $500,000:
Operating Profit = $400,000
Contribution margin increased by approximately 28.6%, but operating profit doubled.
This sensitivity is one of the central effects measured by operating leverage.
Operating Profit and Variable Costs
Variable costs change more directly with sales or production activity.
Suppose an item sells for $100 and has $60 of variable cost.
Contribution per unit is:
Contribution Margin per Unit = $100 − $60
Contribution Margin per Unit = $40
Each additional unit sold contributes $40 toward covering fixed operating costs and then creating operating profit, assuming the price and cost relationship remains stable.
If variable costs rise to $70 without a corresponding price increase:
Contribution per Unit = $100 − $70 = $30
Less contribution remains to support operating profit.
Operating Profit and Contribution Margin
Contribution margin provides a useful bridge between unit economics and operating profit.
In a simplified cost model:
Operating Profit = Contribution Margin − Fixed Operating Costs
Suppose:
Revenue = $2 million
Variable costs = $1.2 million
Fixed operating costs = $500,000
Contribution margin:
$2 million − $1.2 million = $800,000
Operating profit:
$800,000 − $500,000 = $300,000
This relationship is especially useful for internal planning because it shows how each incremental dollar of contribution eventually affects operating earnings after fixed costs are covered.
What Does Positive Operating Profit Mean?
Positive operating profit means the revenues recognized from operations exceeded the operating costs included before the operating-profit subtotal.
Suppose:
Revenue = $3 million
COGS and operating expenses = $2.6 million
Then:
Operating Profit = $400,000
The company’s core operations are profitable at that accounting level.
However, positive operating profit does not guarantee positive net profit.
Interest expense, taxes, losses, or other items below operating income can still reduce final earnings.
It also does not automatically guarantee positive cash flow because accounting earnings and cash movements can differ.
What Does Negative Operating Profit Mean?
Negative operating profit means the business reports an operating loss.
Suppose:
Revenue = $2 million
COGS = $1.3 million
Operating expenses = $900,000
Then:
Operating Profit = $2,000,000 − $1,300,000 − $900,000
Operating Profit = −$200,000
The company reports a $200,000 operating loss.
Possible causes include insufficient sales, weak pricing, high product costs, excessive operating expenses, low capacity utilization, unfavorable product mix, deliberate growth investment, or temporary restructuring.
The negative number identifies the outcome but not its cause.
What Does Zero Operating Profit Mean?
Zero operating profit means operating revenue equals the operating costs recognized before the operating-profit subtotal.
Operating Profit = $0
At this level, the business has reached operating break-even under the cost definitions used.
This concept connects with break-even analysis, although managerial break-even calculations can use more simplified fixed and variable cost assumptions than financial statements.
A company at zero operating profit can still have a net loss after interest and other below-operating items.
Operating Profit vs Gross Profit
Gross profit and operating profit occur at different levels of the income statement.
Gross profit is:
Gross Profit = Revenue − Cost of Goods Sold
Operating profit is:
Operating Profit = Gross Profit − Operating Expenses
Suppose:
Revenue = $5 million
COGS = $3 million
Operating expenses = $1.5 million
Gross profit:
$5 million − $3 million = $2 million
Operating profit:
$2 million − $1.5 million = $500,000
Gross profit is $2 million.
Operating profit is $500,000.
The difference represents the operating expenses deducted after gross profit.
Operating Profit vs Operating Margin
Operating profit is a dollar amount.
Operating margin is a percentage.
The formula is:
Operating Margin = Operating Profit ÷ Revenue × 100
Suppose:
Operating profit = $600,000
Revenue = $4 million
Then:
Operating Margin = $600,000 ÷ $4,000,000 × 100
Operating Margin = 15%
The workbook deliberately gives operating margin its own page because the two metrics serve different search intents.
Operating Profit answers how many dollars the business generated from operations.
Operating Margin answers what percentage of sales became operating profit.
Operating Profit vs Net Profit
Net profit sits farther down the income statement.
Suppose:
Operating profit = $500,000
Interest expense = $100,000
Other net expenses = $20,000
Income tax expense = $90,000
A simplified net-profit calculation is:
Net Profit = $500,000 − $100,000 − $20,000 − $90,000
Net Profit = $290,000
Operating profit isolates operating earnings before those later items.
Net profit reflects the broader final accounting result.
Operating Profit vs Net Profit Margin
Net profit margin converts final net profit into a percentage of revenue.
Suppose:
Revenue = $5 million
Operating profit = $750,000
Net profit = $400,000
Operating margin:
$750,000 ÷ $5 million = 15%
Net profit margin:
$400,000 ÷ $5 million = 8%
The gap can reflect financing costs, taxes, and other items below the operating-profit line.
Operating profit therefore helps separate operating performance from those later effects.
Operating Profit vs EBIT
EBIT means earnings before interest and taxes.
Operating profit and EBIT are frequently close, and some companies or analyses may effectively use the terms interchangeably.
However, they should not automatically be assumed to be identical.
A company may recognize non-operating income or expense that affects EBIT while remaining outside operating income, depending on the statement presentation and analytical definition used.
For example, if:
Operating profit = $600,000
Non-operating income = $50,000
then an analytical EBIT figure could potentially be:
EBIT = $650,000
depending on how the item is classified.
Therefore, use the company’s reported definitions before treating operating profit and EBIT as the same number.
Operating Profit vs EBITDA
EBITDA excludes depreciation and amortization under its standard construction, while reported operating profit generally includes operating depreciation and amortization where those expenses are classified within operations.
Suppose:
Operating profit = $800,000
Depreciation = $150,000
Amortization = $50,000
A simplified EBITDA calculation is:
EBITDA = $800,000 + $150,000 + $50,000
EBITDA = $1,000,000
EBITDA is therefore higher by $200,000 in this example.
That does not mean the company earned an additional $200,000 of cash. EBITDA remains an earnings measure and should not be substituted for cash flow.
Operating Profit vs Operating Cash Flow
The workbook maps operating cash flow directly to this page because operating profit and operating cash generation are closely related but fundamentally different.
Operating profit is based on accrual accounting.
Operating cash flow reflects cash provided by or used in operating activities.
Suppose a company reports:
Operating profit = $500,000
but customers delay payment and accounts receivable increases substantially.
Reported operating profit can remain $500,000 even though the business collected much less cash during the period.
Likewise, noncash depreciation can reduce operating profit without requiring a current-period cash payment.
Therefore:
Operating Profit ≠ Operating Cash Flow
Both should be analyzed.
Operating Profit vs Free Cash Flow
Free cash flow moves further into cash analysis by considering capital expenditures under a common simplified formula.
Suppose:
Operating cash flow = $800,000
Capital expenditures = $550,000
Then:
Free Cash Flow = $800,000 − $550,000
Free Cash Flow = $250,000
The company might simultaneously report $700,000 of operating profit.
These figures can differ because accounting earnings, working-capital cash movements, noncash expenses, and capital expenditures follow different measurement rules.
Operating profit therefore should not be used as a substitute for available cash.
Operating Profit and Operating Leverage
Operating profit is the earnings measure amplified by operating leverage.
Suppose current:
Revenue = $1 million
Contribution margin = $400,000
Fixed costs = $300,000
Operating profit is:
$400,000 − $300,000 = $100,000
Degree of operating leverage:
DOL = $400,000 ÷ $100,000
DOL = 4
A 10% increase in sales can therefore produce approximately a 40% increase in operating profit around this activity level under the simplified assumptions.
Operating profit provides the denominator that makes this sensitivity visible.
Operating Profit and Payback Period
The workbook maps payback period as another neighboring finance concept.
Suppose a company spends $2 million on automation and expects the investment to increase annual operating profit by $500,000.
The operating-profit improvement is economically relevant, but it does not by itself establish the investment’s exact cash payback.
Depreciation, working capital, taxes, capital expenditure timing, and other cash effects can differ from accounting profit.
Payback analysis should therefore use the relevant cash flows rather than simply dividing investment cost by accounting operating profit without checking those differences.
Operating Profit and Interest Coverage
Interest coverage commonly uses an earnings measure such as EBIT relative to interest expense.
Operating profit can provide useful context because it represents earnings before financing costs under the usual operating-income framework.
Suppose:
Operating profit = $900,000
Interest expense = $300,000
A simple comparison suggests operating earnings equal three times the interest expense.
However, when calculating a formal interest-coverage ratio, use the specific numerator defined by that methodology rather than assuming every operating-profit subtotal is identical to EBIT.
Operating Profit and Revenue Growth
Revenue growth can produce several different operating-profit outcomes.
Case 1: Favorable operating leverage
Revenue increases 20%.
Operating profit increases 60%.
The business is converting the additional sales into earnings efficiently.
Case 2: Neutral relationship
Revenue increases 20%.
Operating profit increases roughly 20%.
Operating profitability remains broadly proportional to sales.
Case 3: Operating deleverage
Revenue increases 20%.
Operating profit increases only 5%, or falls.
Costs are rising faster than the earnings generated by the additional revenue.
Therefore, operating-profit growth should be compared with revenue growth rather than analyzed in isolation.
Operating Profit Growth Formula
Operating profit growth can be calculated as:
Operating Profit Growth = (Current Operating Profit − Previous Operating Profit) ÷ Previous Operating Profit × 100
Suppose:
Previous operating profit = $800,000
Current operating profit = $1,000,000
Then:
Operating Profit Growth = ($1,000,000 − $800,000) ÷ $800,000 × 100
Operating Profit Growth = 25%
If revenue grew only 10% over the same period, operating earnings grew much faster than sales.
That can signal favorable operating leverage or another improvement in the company’s cost or pricing structure.
Operating Profit and Pricing
Pricing can directly affect operating profit when volume and costs remain stable.
Suppose a business sells 100,000 units at $20.
Revenue:
100,000 × $20 = $2,000,000
Assume operating profit equals $200,000.
Now increase price to $21 with no volume decline and no material cost increase.
New revenue:
100,000 × $21 = $2,100,000
The $100,000 increase can flow substantially toward operating profit.
Under the simplified assumptions:
New Operating Profit ≈ $300,000
Operating profit rises 50% even though price rises only 5%.
In reality, price increases can affect demand, product mix, and competitive behavior, so the final result must be tested rather than assumed.
Operating Profit and Markup
Markup focuses on selling price relative to a defined cost.
A high markup does not guarantee strong operating profit.
Suppose a product costs $40 and sells for $80.
Its markup on that cost is:
($80 − $40) ÷ $40 = 100%
However, the business may still face substantial marketing, payroll, rent, technology, distribution, and administrative expenses.
Operating profit captures those broader operating costs.
Markup remains a pricing calculation rather than a complete measure of operating profitability.
Operating Profit and Unit Economics
Unit economics can help explain where operating profit originates.
Suppose an online business earns $30 of contribution from each order after its relevant variable costs.
At 100,000 orders:
Total Contribution = $3,000,000
If fixed operating costs equal $2.4 million:
Operating Profit = $3,000,000 − $2,400,000
Operating Profit = $600,000
Improving contribution per order to $35 without increasing fixed costs would produce:
100,000 × $35 = $3,500,000 Contribution
Operating Profit = $3,500,000 − $2,400,000
Operating Profit = $1,100,000
A relatively small improvement in unit economics can therefore create a much larger change in operating profit when sales volume is substantial.
Operating Profit and Asset Turnover
Asset turnover measures how much revenue a company generates relative to its asset base.
Operating profit measures the earnings produced after operating costs.
Two companies can therefore generate the same operating profit through very different models.
Company A may earn high margins but require substantial assets.
Company B may operate with thinner margins while turning its assets rapidly.
Operating profit alone does not reveal capital efficiency.
Operating Profit and Return on Assets
Return on assets places earnings in the context of the company’s asset base.
Suppose two companies each generate $1 million in operating profit.
Company A uses $5 million in assets.
Company B uses $25 million.
Their absolute operating profit is identical, but the amount of economic resources required is very different.
This illustrates why operating-profit analysis should be supplemented with asset and return metrics when evaluating capital efficiency.
Operating Profit and Return on Invested Capital
Return on invested capital goes beyond the operating-profit dollar amount by relating operating economics to invested capital under its particular methodology.
A business can generate large operating profit simply because enormous amounts of capital have been invested.
Another can generate less absolute operating profit while requiring much less capital.
Neither result can be fully evaluated without understanding the capital base.
Operating profit is therefore a building block rather than a complete return measure.
Operating Profit and Working Capital
Working capital helps explain why profitable growth can still consume cash.
Suppose operating profit rises sharply because sales increase.
If many sales are made on credit, accounts receivable can also increase substantially.
If more inventory is needed to support growth, additional cash can become tied up there as well.
The income statement may therefore show higher operating profit while operating cash flow temporarily weakens.
Accounting profitability and funding requirements need separate analysis.
Operating Profit and Break-Even
At operating break-even:
Operating Profit = $0
Suppose:
Selling price per unit = $100
Variable cost per unit = $60
Contribution margin per unit = $40
Fixed operating costs = $400,000
Break-even volume is:
Break-Even Units = $400,000 ÷ $40
Break-Even Units = 10,000
At 10,000 units:
Operating Profit = $0
At 12,000 units:
Contribution Margin = 12,000 × $40 = $480,000
Operating Profit = $480,000 − $400,000
Operating Profit = $80,000
The business has moved above operating break-even.
Operating Profit and Cost-Plus Pricing
Cost-plus pricing can establish selling prices from a cost base, but an adequate markup on direct cost does not automatically create sufficient operating profit.
Suppose a business adds 30% to product cost but has substantial selling, administrative, and infrastructure expenses.
Gross profit can remain positive while operating profit is weak or negative.
A pricing model should therefore consider whether total expected gross profit can cover the company’s operating expense structure.
Operating profit shows whether that has actually occurred.
Operating Profit and NFT Profit
The workbook maps NFT profit indirectly through neighboring Business Finance pages, and the distinction is important.
An individual NFT transaction can produce positive profit after acquisition price, marketplace fees, royalties, and other relevant transaction costs.
An NFT-related company can still report an operating loss if development, marketing, salaries, platform costs, legal expenses, and other business-wide operating costs exceed the gross profit from its transactions.
Transaction profit and company operating profit answer different questions.
Operating Profit by Segment
Large companies may report operating profit or operating income by segment.
For example:
Segment A revenue = $10 million
Segment A operating profit = $2 million
Segment B revenue = $10 million
Segment B operating profit = $500,000
Both segments generate the same sales, but Segment A creates four times as much operating profit.
Segment analysis can therefore expose differences that the consolidated number hides.
However, corporate expenses, shared costs, and allocation methods can affect how segment operating profit is presented.
Product Mix and Operating Profit
Product mix can change operating profit even when total revenue remains stable.
Suppose a business generates $10 million of annual sales.
If more sales shift toward products with higher contribution margins, operating profit can rise without any top-line growth.
The reverse is also possible.
Revenue may increase while operating profit falls if new sales come mainly from low-margin products.
This is why management should examine what generated the revenue, not only how much revenue was generated.
Operating Profit and Economies of Scale
Operating profit can grow faster than revenue when a company gains economies of scale.
Suppose revenue increases from $10 million to $12 million.
Gross profit increases from $5 million to $6 million.
Operating expenses increase only from $4 million to $4.4 million.
Operating profit changes from:
$5 million − $4 million = $1 million
to:
$6 million − $4.4 million = $1.6 million
Revenue grew 20%.
Operating profit grew 60%.
This is favorable operating leverage.
However, scale does not guarantee these economics. New capacity, staffing, logistics, or infrastructure can eventually cause fixed and semi-fixed costs to rise.
Operating Profit and Cost Inflation
Rising costs can reduce operating profit even when revenue remains stable.
Suppose:
Revenue = $5 million
COGS = $2.5 million
Operating expenses = $1.5 million
Operating profit:
$1 million
Now COGS rises to $2.8 million while all other amounts remain unchanged.
New operating profit:
$5 million − $2.8 million − $1.5 million
Operating Profit = $700,000
The $300,000 increase in cost reduced operating profit by 30%.
If the company cannot offset inflation with pricing, efficiency, product mix, or purchasing improvements, operating earnings can deteriorate quickly.
Operating Profit and Expense Control
Expense reductions can improve operating profit, but the quality of the reduction matters.
Suppose operating expenses fall by $200,000 while revenue and gross profit remain unchanged.
Operating profit increases by $200,000.
That looks favorable mathematically.
However, if the savings came from eliminating maintenance that later causes production failures, the short-term improvement may not be sustainable.
Similarly, cuts to product development, customer service, or sales capacity can improve current earnings while weakening future revenue.
Expense quality matters alongside expense quantity.
Operating Profit and Depreciation
Depreciation is often included in operating expenses and can therefore reduce reported operating profit.
Suppose:
Operating profit before depreciation = $1 million
Depreciation expense = $250,000
Reported operating profit after depreciation:
$1,000,000 − $250,000 = $750,000
The depreciation expense reduces accounting operating earnings even though it does not necessarily represent a current-period cash payment.
This is one reason operating profit can differ materially from operating cash flow and EBITDA.
Operating Profit and Amortization
Amortization can create a similar difference.
Suppose a company recognizes $100,000 of operating amortization expense.
If everything else remains constant, operating profit declines by $100,000.
Whether analysts should adjust for a particular amortization expense depends on the purpose of the analysis and the nature of the underlying asset.
For reported operating profit, the amount should not simply be removed because it is noncash.
Accounting earnings and cash-flow analysis answer different questions.
Adjusted Operating Profit
Companies sometimes report adjusted operating profit or adjusted operating income that excludes specified items from the reported GAAP figure.
Conceptually:
Adjusted Operating Profit = Reported Operating Profit ± Stated Adjustments
Examples of adjustments can include restructuring expenses, acquisition-related costs, impairment charges, or other amounts selected by management.
Adjusted measures can provide supplementary context, but they should not be treated as automatically superior to reported operating profit.
The key questions are:
What was adjusted?
Why?
Does the item recur?
Is the reconciliation clear?
Is the definition consistent between periods?
Reported vs Adjusted Operating Profit
Suppose:
Reported operating profit = $200 million
Management excludes:
Restructuring expense = $30 million
Acquisition-related charge = $20 million
Adjusted operating profit becomes:
$200 million + $30 million + $20 million
Adjusted Operating Profit = $250 million
The adjusted figure is 25% higher than reported operating profit.
That difference may be analytically useful, but readers should not compare the $250 million adjusted figure with another company’s reported GAAP operating profit without understanding the methodologies.
Consistency matters.
Operating Profit Trend Analysis
Consider:
Year 1: $2 million
Year 2: $2.4 million
Year 3: $3.1 million
Year 4: $4 million
Operating profit is consistently rising.
That is encouraging, but the next question is whether the increase comes from:
revenue growth;
higher gross margin;
cost control;
favorable product mix;
acquisitions;
or one-time adjustments.
Now consider:
Year 1: $4 million
Year 2: $3.5 million
Year 3: $2.8 million
Year 4: $1.5 million
A sustained decline deserves investigation even if the company remains profitable.
Trend direction is useful. The underlying drivers determine the interpretation.
Revenue Growing Faster Than Operating Profit
Suppose:
Revenue grows 25%.
Operating profit grows 10%.
The company is still generating more operating earnings in absolute dollars, but its operating margin will generally decline because operating profit did not keep pace with sales.
This can result from lower prices, higher product costs, more expensive labor, increased marketing, growth investment, or unfavorable sales mix.
Revenue growth should therefore be evaluated alongside operating-profit growth.
Operating Profit Growing Faster Than Revenue
Now suppose:
Revenue grows 10%.
Operating profit grows 30%.
The business is converting incremental revenue into earnings more efficiently.
Possible explanations include:
favorable operating leverage;
better pricing;
improved product mix;
lower product costs;
greater utilization;
or better expense control.
If the improvement is sustainable, operating margin should generally expand.
Operating Profit and Business Valuation
Business valuation can use operating earnings as one analytical input, but operating profit is not itself the value of a business.
Two companies with identical operating profit can have different valuations because of growth, risk, debt, capital requirements, cash conversion, competitive position, customer concentration, and expected future economics.
For example:
Company A operating profit = $5 million
Company B operating profit = $5 million
If Company A requires enormous annual capital expenditure while Company B requires very little, their economic value can differ materially.
Valuation requires more than multiplying one operating-profit figure by an arbitrary number.
Operating Profit vs Investment Return
Operating profit also should not be confused with investment-return calculations such as net present value.
Operating profit measures accounting earnings during a period.
NPV compares discounted project cash flows with the required investment.
A project can produce positive operating profit every year and still have negative NPV if the initial capital requirement is too large relative to the future cash benefits.
Likewise, an investment can create positive NPV despite low early operating profit if later cash flows justify the initial cost.
Common Operating Profit Mistakes
One common mistake is treating gross profit as operating profit.
Another is subtracting interest and taxes and still calling the result operating profit.
A third is automatically equating operating profit with EBIT without examining non-operating classifications.
Users can also mistake EBITDA for operating profit even though depreciation and amortization can create meaningful differences.
Another error is assuming positive operating profit means positive operating cash flow.
It does not.
Companies may also focus on operating-profit growth without comparing it with revenue growth or operating margin.
Finally, adjusted operating profit should not be compared blindly with reported operating profit from another company.
Definitions matter.
Limitations of Operating Profit
Operating profit provides a valuable view of operating performance, but it does not describe the entire financial condition.
It does not directly measure cash generation.
It does not capture the final impact of financing costs and taxes.
It does not reveal how much capital the business requires.
It can be affected by accounting estimates and classifications.
It can include depreciation and amortization that differ from current cash spending.
Adjusted versions may differ significantly from reported results.
Absolute operating-profit dollars can also make businesses of different sizes difficult to compare.
For these reasons, operating profit should be analyzed alongside operating margin, cash flow, net profit, capital efficiency, leverage, and growth.
How to Analyze Operating Profit Properly
Begin with revenue.
Then examine gross profit and gross margin to understand the economics before broader operating expenses.
Next, review operating expenses and calculate:
Operating Profit = Gross Profit − Operating Expenses
Compare operating profit with prior periods.
Then calculate operating margin to determine whether earnings are growing faster or slower than sales.
Review operating leverage to understand sensitivity to changes in revenue.
Compare operating profit with operating cash flow to evaluate cash conversion.
Finally, examine net profit, debt obligations, working capital, capital expenditure, and return measures.
This sequence shows not only how much operating profit the company generated, but also why it generated that amount and what the number does not capture.
Why Operating Profit Matters
Operating profit isolates one of the most important layers of company performance: the earnings produced by the operating business after the costs required to run it are recognized.
The central formula is:
Operating Profit = Revenue − Cost of Goods Sold − Operating Expenses
or:
Operating Profit = Gross Profit − Operating Expenses
A rising operating profit can indicate stronger sales, better pricing, improved gross margin, operating leverage, cost control, or a more profitable sales mix.
A declining operating profit can point toward weaker demand, higher product costs, rising operating expenses, lower pricing, or inefficient capacity.
However, the dollar amount is only the beginning of the analysis.
Operating margin shows its size relative to revenue.
Operating cash flow shows how operations converted into cash.
Net profit shows what remained after the broader income-statement structure.
Together, these measures provide a much stronger view than operating profit alone.
Frequently Asked Questions
What is operating profit in simple terms?
Operating profit is the earnings left after subtracting cost of goods sold and operating expenses from revenue. It measures profitability from the company’s operating activities before the broader effects of financing and taxes.
What is the operating profit formula?
A simplified formula is:
Operating Profit = Revenue − Cost of Goods Sold − Operating Expenses
If gross profit is already known:
Operating Profit = Gross Profit − Operating Expenses
Is operating profit the same as gross profit?
No. Gross profit subtracts cost of goods sold from revenue. Operating profit then subtracts operating expenses from gross profit.
Is operating profit the same as EBIT?
They can be identical or very similar in some financial statements, but not always. Non-operating income and expense classifications can create differences, so the specific company’s definitions should be checked.
Is operating profit the same as EBITDA?
No. EBITDA excludes depreciation and amortization under its standard construction, while operating profit generally includes applicable depreciation and amortization recognized within operations.
What is the difference between operating profit and net profit?
Operating profit focuses on earnings from operations before the broader effects of financing and taxes. Net profit reflects the final bottom-line earnings after the additional applicable items.
What does negative operating profit mean?
Negative operating profit means the company’s operating costs exceeded its operating revenue under the reported calculation. The result is an operating loss.
Can operating profit be positive while net profit is negative?
Yes. Large interest expense, taxes, non-operating losses, or other items below operating income can turn positive operating profit into a final net loss.
Can operating profit be positive while operating cash flow is negative?
Yes. Accrual accounting and working-capital movements can create significant differences between operating earnings and cash generated from operations.
How can a business increase operating profit?
Potential drivers include sustainable revenue growth, stronger pricing, improved gross margin, better product mix, lower operating costs, increased utilization, and favorable operating leverage.
Is depreciation included in operating profit?
Depreciation that is classified within operating costs generally reduces reported operating profit. The precise presentation depends on the company’s financial statements and accounting classification.
Why is operating profit important?
Operating profit helps isolate the profitability of the operating business before financing and tax effects. It is useful for evaluating operating performance, trends, margins, cost structure, and the economics of revenue growth.




