

Pricing & Growth: Complete Guide, Formulas & Examples

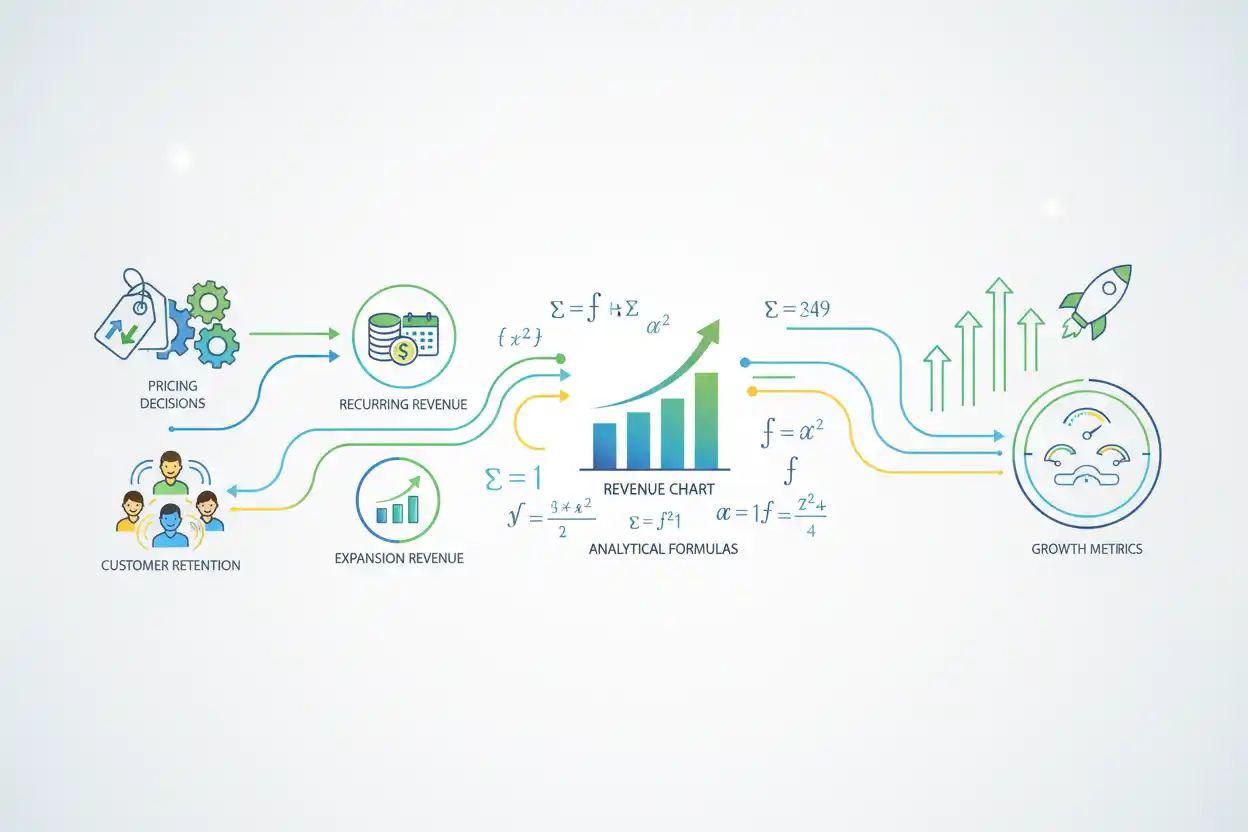
Pricing & growth analysis connects what a business charges with how revenue expands, contracts, repeats, and converts into sustainable customer economics.
Pricing determines more than the amount collected from one transaction. It can affect customer acquisition, retention, expansion, margins, payback periods, recurring revenue, sales efficiency, and the rate at which a business can grow without weakening its economics.
A useful starting relationship is:
Revenue = Price × Quantity
But a complete pricing & growth framework goes much further. A subscription business may need to understand recurring revenue, customer churn, retention, expansion, acquisition economics, and growth rates at the same time.
This guide explains how those measures fit together and when to use each one. The specialist calculations remain separate because each metric answers a narrower business question.
What Is Pricing & Growth Analysis?
Pricing & growth analysis examines how commercial decisions affect the size, quality, and durability of revenue.
Consider two companies.
Company A grows revenue 40% by heavily discounting prices and spending aggressively to acquire customers who leave quickly.
Company B grows only 20%, but retains customers, expands existing accounts, maintains strong margins, and recovers customer-acquisition costs quickly.
The first company is growing faster by one headline measure.
The second may have stronger economics.
A complete analysis therefore asks several questions:
Price: What does the customer pay?
Revenue: How much recurring and nonrecurring revenue does that pricing create?
Retention: How much of the customer and revenue base remains?
Expansion: How much more do existing customers spend?
Acquisition economics: How much does growth cost?
Growth rate: How rapidly are the underlying commercial metrics changing?
The answers reveal whether growth is merely fast or economically durable.
The Basic Pricing Formula
The most fundamental relationship is:
Revenue = Price × Quantity
Suppose a company sells 20,000 units at $50:
Revenue = 20,000 × $50 = $1,000,000
If price increases to $55 and volume remains unchanged:
Revenue = 20,000 × $55 = $1,100,000
Revenue increases by:
$100,000
or:
$100,000 ÷ $1,000,000 × 100 = 10%
In practice, volume may respond to the price change.
A 10% price increase that causes a 20% fall in quantity can reduce total revenue.
Pricing therefore cannot be analyzed without customer behavior.
Price Increase Percentage
When a business changes its selling price, price increase percentage isolates the size of the increase.
The basic relationship is:
Price Increase % = (New Price − Old Price) ÷ Old Price × 100
Suppose price moves from $100 to $115:
($115 − $100) ÷ $100 × 100 = 15%
The new price is 15% higher.
The specialist price-increase analysis can then be combined with unit volume, churn, conversion, and revenue data to determine whether the increase strengthened the business.
Price Decrease Percentage
A reduction is analyzed separately through price decrease percentage.
Suppose a product falls from $80 to $68:
Price Decrease = $12
$12 ÷ $80 × 100 = 15%
The selling price declined 15%.
Lower prices can increase demand, but more sales are required simply to preserve the same revenue when unit price falls.
If price declines 15%, unit volume must rise sufficiently to compensate.
Discount Percentage and Discounted Price
Discounting creates two related but distinct calculations.
Discount percentage measures the reduction relative to the original price.
Discounted price calculates what the customer actually pays after the reduction.
Suppose list price is $200 with a 20% discount.
Discount amount:
$200 × 20% = $40
Discounted price:
$200 − $40 = $160
If discounts increase conversion but reduce margin or attract customers with poor retention, the apparent sales growth may not create strong long-term economics.
Break-Even Price
Before aggressively changing prices, a business needs to understand the minimum economics required to cover the relevant cost base.
Break-even price focuses specifically on the price at which the applicable revenue and cost relationship reaches the defined break-even condition.
Pricing below an economically sustainable level can create impressive unit growth while producing losses.
A business selling more at an inadequate contribution can make its financial problem larger rather than smaller.
That is why growth targets should be evaluated alongside price and cost structure.
Margin and Pricing
Margin measures the difference between revenue and the relevant cost base, usually expressed either in dollars or as a percentage.
Suppose a product sells for $100 and carries $60 of relevant cost:
Margin Amount = $100 − $60 = $40
A simplified margin percentage is:
$40 ÷ $100 × 100 = 40%
If the price falls to $80 while cost remains $60:
Margin Amount = $20
Margin Percentage = $20 ÷ $80 × 100 = 25%
A 20% price reduction cuts the margin amount in half in this example.
Price changes can therefore have disproportionate effects on profit economics.
Pricing and Volume Tradeoffs
Suppose a product currently sells:
10,000 Units at $100 = $1,000,000 Revenue
Relevant unit cost is $60.
Gross contribution before other costs:
10,000 × ($100 − $60) = $400,000
Management cuts price to $90.
To maintain the same $400,000 contribution with a $30 contribution per unit:
Required Units = $400,000 ÷ $30 ≈ 13,334 Units
Unit volume must rise approximately:
(13,334 − 10,000) ÷ 10,000 × 100 ≈ 33.34%
A 10% price reduction requires about 33.34% more units to preserve the same contribution under these assumptions.
This illustrates why pricing decisions should focus on economics rather than percentage discounts alone.
Recurring Revenue Changes the Analysis
A one-time product sale ends after the transaction.
Recurring-revenue businesses have another dimension: the customer can continue paying month after month or year after year.
That makes retention and expansion crucial.
A subscription acquired today can generate revenue across many periods.
A customer that cancels quickly can destroy much of the expected value from the original acquisition.
Pricing therefore interacts with the duration and expansion of customer relationships.
Monthly Recurring Revenue
Monthly recurring revenue measures the recurring revenue base expressed monthly.
Suppose 1,000 customers each pay $100 per month:
MRR = 1,000 × $100 = $100,000
If another 100 comparable customers are added:
Additional MRR = 100 × $100 = $10,000
New MRR:
$110,000
This provides a more focused view of recurring business scale than total accounting revenue when the company also has one-time fees or other nonrecurring items.
Annual Recurring Revenue
Annual recurring revenue expresses recurring revenue on an annualized basis.
In a stable simple case:
ARR = Monthly Recurring Revenue × 12
If MRR is $100,000:
ARR = $100,000 × 12 = $1,200,000
Annual recurring revenue is useful for understanding the scale of the recurring contract base.
It should not automatically be treated as identical to recognized annual revenue, particularly when contract timing, one-time charges, usage revenue, or accounting recognition differ.
Annual Contract Value
Annual contract value normalizes an individual contract’s value to an annual period.
Suppose a three-year contract is worth $360,000 under a simple evenly allocated commercial model:
ACV = $360,000 ÷ 3 = $120,000 per Year
ACV focuses on contract economics.
ARR focuses on the broader annualized recurring revenue base.
A business can use both when analyzing enterprise or subscription pricing, but the metrics should not be substituted blindly.
Average Revenue Per Account
When customers are organizations or accounts, average revenue per account helps measure monetization.
Suppose recurring revenue for a period is $2 million across 500 active customer accounts:
Average Revenue Per Account = $2,000,000 ÷ 500
= $4,000 per Account
If the value rises, the company may be improving pricing, product mix, expansion, or customer segmentation.
A higher average can also result from losing small customers, so the underlying customer movement still matters.
Average Revenue Per User
For products where the user is the more meaningful unit, average revenue per user provides a similar lens.
Suppose monthly revenue is $500,000 from 100,000 active users:
ARPU = $500,000 ÷ 100,000 = $5
If ARPU rises to $6 while user count remains constant:
New Revenue = 100,000 × $6 = $600,000
Revenue increases 20%.
The change might come from pricing, premium-plan adoption, usage, advertising, or another monetization mechanism.
Account Metrics and User Metrics Are Not Interchangeable
A business can have one customer account containing hundreds or thousands of users.
That makes average revenue per account very different from average revenue per user.
Suppose one enterprise account pays $120,000 per year for 2,000 users.
Revenue per account:
$120,000
Revenue per user:
$120,000 ÷ 2,000 = $60
Both calculations are correct.
They describe different levels of the customer relationship.
Choosing the appropriate metric depends on how the business sells, prices, and expands.
Growth Requires Retention
Acquiring new customers is only one side of growth.
A company that adds 1,000 customers while losing 900 has far weaker underlying retention than one that adds the same 1,000 while losing only 100.
Customer churn measures the proportion of customers lost during a period.
If a business starts with 10,000 customers and loses 500:
Customer Churn = 500 ÷ 10,000 × 100 = 5%
Churn directly influences how much new acquisition is required simply to keep the customer base from shrinking.
Logo Retention
Logo retention focuses on the percentage of customers or accounts retained.
If a company begins with 1,000 customer accounts and retains 920:
Logo Retention = 920 ÷ 1,000 × 100 = 92%
A business can have strong logo retention while still losing a meaningful amount of revenue if the customers that leave are unusually large.
That is why customer-count retention should be combined with revenue retention.
Revenue Churn
Revenue churn focuses on recurring revenue lost rather than customer count.
Suppose a business begins with $1 million of recurring revenue and loses $70,000 through cancellations or qualifying contractions:
Revenue Churn = $70,000 ÷ $1,000,000 × 100 = 7%
A few large customer losses can therefore produce severe revenue churn even when most customer logos remain.
This distinction becomes important in enterprise businesses where customer values differ substantially.
Gross Revenue Retention
Gross revenue retention measures how much starting recurring revenue remains after churn and contraction while excluding expansion.
Suppose beginning recurring revenue is $1 million.
During the period:
Churn = $50,000
Contraction = $30,000
Ending retained revenue before expansion:
$1,000,000 − $50,000 − $30,000 = $920,000
Gross revenue retention:
$920,000 ÷ $1,000,000 × 100 = 92%
GRR shows how well the existing revenue base survives before upsells or expansion can compensate for losses.
Expansion Revenue
Expansion revenue comes from existing customers who increase their spending through upgrades, additional seats, cross-sells, usage growth, or other expansion.
Suppose beginning recurring revenue is $1 million and existing customers add $120,000 of expansion revenue.
That growth is valuable because it occurs within the existing customer base.
Pricing structures that naturally scale with customer value, seats, usage, modules, or consumption can create significant expansion opportunities.
Net Revenue Retention
Net revenue retention incorporates both losses and expansion from the starting customer base.
Suppose:
Starting Recurring Revenue = $1,000,000
Churn = $50,000
Contraction = $30,000
Expansion = $180,000
Ending recurring revenue from the same starting cohort:
$1,000,000 − $50,000 − $30,000 + $180,000 = $1,100,000
NRR:
$1,100,000 ÷ $1,000,000 × 100 = 110%
The existing customer base grew 10% even before adding new customers.
A pricing model that supports sustainable customer expansion can therefore become an important growth engine.
Gross Revenue Retention vs. Net Revenue Retention
GRR excludes expansion.
NRR includes it.
Using the prior example:
GRR = 92%
NRR = 110%
The company loses 8% of starting revenue through churn and contraction but more than offsets those losses with expansion.
Both metrics matter.
NRR alone can hide a serious underlying churn problem if expansion from a smaller group of customers is unusually strong.
Pricing and Customer Churn
Price increases can improve revenue per customer but also increase churn.
Suppose 10,000 customers pay $20 per month:
Monthly Revenue = $200,000
Price rises 10% to $22.
If no one leaves:
Revenue = $220,000
But suppose the increase causes 1,000 customers to cancel.
Remaining customers:
9,000
New revenue:
9,000 × $22 = $198,000
Despite a 10% price increase, total monthly revenue falls from $200,000 to $198,000.
The price increase failed to compensate for lost customers.
This is why pricing must be tested against customer behavior.
Pricing and Expansion
The opposite can occur when customers willingly pay more because the product delivers greater value.
Suppose 5,000 customers pay $50.
Monthly revenue:
$250,000
A new premium tier convinces 1,000 customers to upgrade to $80 while the remaining 4,000 stay at $50.
New revenue:
(1,000 × $80) + (4,000 × $50)
$80,000 + $200,000 = $280,000
Expansion revenue is:
$30,000 per Month
No new customers were required to generate the increase.
CAC Payback Period
Growth acquired through paid sales and marketing has a cost.
CAC payback period estimates how long it takes to recover customer acquisition cost from the relevant contribution generated by a customer.
If a company spends heavily to acquire customers who repay that investment only after many years, rapid growth can create severe cash pressure.
A shorter economically sound payback period generally allows acquisition spending to recycle more quickly.
The specialist calculation should be applied with the company’s actual acquisition-cost and contribution assumptions rather than using a generic rule.
Lifetime Value to CAC Ratio
The lifetime value to CAC ratio compares expected customer economic value with the cost of acquiring that customer.
Conceptually:
LTV:CAC = Customer Lifetime Value ÷ Customer Acquisition Cost
If estimated lifetime value is $6,000 and CAC is $2,000:
LTV:CAC = 3.0
The customer is expected to generate three times the economic value represented by acquisition cost under the assumptions.
A ratio that looks attractive mathematically can still be misleading if lifetime value depends on unrealistic retention, margin, or expansion assumptions.
Sales Efficiency
Sales efficiency helps evaluate how effectively commercial spending produces new revenue.
A company can grow rapidly by increasing sales and marketing expenditure much faster than new revenue.
The top-line result can look impressive while acquisition efficiency deteriorates.
Pricing influences this relationship because higher realized revenue per customer can improve revenue generated from a given acquisition effort—provided conversion and retention remain healthy.
SaaS Magic Number
For recurring-revenue businesses, the Magic Number SaaS metric provides another lens on sales and marketing efficiency relative to recurring-revenue growth.
It is particularly useful when management wants to understand whether incremental commercial spending is producing enough recurring revenue to justify continued acceleration.
The exact formula and interpretation belong on the specialist page because period timing and annualization assumptions materially affect the result.
Within the broader pricing & growth framework, its role is to connect revenue expansion with the cost of acquiring that expansion.
Monthly Recurring Revenue Growth
Monthly recurring revenue growth tracks how quickly the recurring monthly base changes.
Suppose MRR rises from $200,000 to $230,000:
MRR Growth = ($230,000 − $200,000) ÷ $200,000 × 100
MRR Growth = 15%
That growth can come from new customers, expansion, pricing changes, reactivation, or reduced churn.
Understanding the components is more useful than reading the headline growth rate alone.
Month-Over-Month Growth
Month-over-month growth compares one month with the immediately preceding month.
Suppose revenue rises:
January = $500,000
February = $550,000
Then:
MoM Growth = ($550,000 − $500,000) ÷ $500,000 × 100 = 10%
Month-over-month analysis responds quickly to change but can be noisy because seasonality, billing timing, or one-time transactions can have large effects.
Quarter-Over-Quarter Growth
Quarter-over-quarter growth compares performance with the preceding quarter.
Suppose quarterly revenue rises from $3 million to $3.3 million:
QoQ Growth = $300,000 ÷ $3,000,000 × 100 = 10%
Quarterly comparison reduces some monthly noise but can still be strongly affected by seasonality.
A retailer comparing Q4 with Q3 may see substantial growth simply because of holiday demand.
Year-Over-Year Growth
Year-over-year growth compares a period with the corresponding period one year earlier.
Suppose Q2 revenue rises from $5 million to $6 million:
YoY Growth = ($6M − $5M) ÷ $5M × 100 = 20%
Year-over-year comparisons can be more useful than sequential growth when seasonality is significant because both periods occupy a similar point in the annual cycle.
No single growth interval is universally superior. Each provides a different analytical perspective.
Growth Rates Need Context
Suppose a business reports:
Month-over-Month Growth = 5%
Compounded mechanically for 12 periods:
Annualized Factor = 1.05¹² ≈ 1.796
That would imply approximately 79.6% growth if the monthly rate continued every month.
But short-term growth rarely remains perfectly constant.
Using one strong month as a permanent forecast can produce unrealistic expectations.
Growth rates should be interpreted alongside market size, capacity, retention, pricing, seasonality, and customer acquisition economics.
Rule of 40
The Rule of 40 combines growth and profitability into one high-level framework commonly associated with software businesses.
Its purpose is not to replace detailed profitability or growth analysis.
Instead, it highlights the tradeoff between expanding rapidly and generating profitability.
A company with very high growth can sometimes accept weaker current profitability.
A slower-growth company may need stronger margins to produce a balanced profile.
The underlying growth and profitability measures should remain clearly defined.
Value-Based Pricing
Value-based pricing approaches price from the customer’s perceived or measurable value rather than simply adding a markup to cost.
Suppose a product saves a business customer $100,000 per year.
A pricing strategy based only on a $5,000 production cost may leave significant economic value uncaptured.
Value-based pricing asks what portion of the customer-created value the supplier can reasonably capture while preserving a compelling customer return.
This approach requires understanding customer outcomes, alternatives, segmentation, willingness to pay, and differentiation.
Cost-Based Thinking vs. Value-Based Pricing
Suppose a product costs $20 to provide.
A 50% markup produces:
Price = $20 × 1.50 = $30
But suppose customers would willingly pay $80 because the product eliminates a far more expensive alternative.
A cost-based $30 price may substantially under-monetize the offering.
The opposite can also occur.
A product costing $50 cannot automatically command $100 merely because management wants a 100% markup.
Customer value and competitive alternatives still constrain the achievable price.
Pricing Tiers and Growth
Tiered pricing can allow customers with different needs and willingness to pay to select different packages.
Suppose a service has:
Basic = $50 per Month
Professional = $100
Enterprise = $250
If all customers were forced into one $100 plan, price-sensitive customers might leave while high-value customers pay less than they are willing to spend.
Segmentation can therefore improve both conversion and expansion when tiers correspond to real customer value differences.
Poorly designed tiers can create confusion or force customers into plans that do not match their needs.
Usage-Based Pricing
Usage-based pricing links customer spending to consumption.
If the unit price is $0.10 per transaction:
Monthly Revenue = Transactions × $0.10
At 100,000 transactions:
Revenue = $10,000
At 200,000:
Revenue = $20,000
This creates natural expansion when successful customers use more of the product.
It can also make revenue less predictable if usage varies substantially.
Pricing architecture changes not only monetization but also the behavior of recurring-revenue metrics.
Growth From New Customers vs. Existing Customers
Suppose beginning monthly recurring revenue is $100,000.
During the month:
New Customer MRR = $20,000
Expansion MRR = $10,000
Churned MRR = $8,000
Contraction = $2,000
Ending MRR:
$100,000 + $20,000 + $10,000 − $8,000 − $2,000
= $120,000
Total growth is 20%.
But only half of the $20,000 net increase came from new customers:
New MRR = $20,000
Net existing-customer movement:
$10,000 − $8,000 − $2,000 = $0
This reveals that the existing base did not contribute net growth during the period.
Example of Strong Expansion-Led Growth
Suppose:
Beginning MRR = $500,000
During the month:
New MRR = $30,000
Expansion MRR = $50,000
Churned MRR = $15,000
Contraction = $5,000
Ending MRR:
$500,000 + $30,000 + $50,000 − $15,000 − $5,000
= $560,000
Net growth:
$60,000
Half of that increase comes from new customers, while the existing base adds:
$50,000 − $15,000 − $5,000 = $30,000
Expansion is therefore an equally important growth engine.
Example of Acquisition Masking Weak Retention
Suppose:
Beginning MRR = $500,000
New MRR = $100,000
Expansion MRR = $10,000
Churned MRR = $70,000
Contraction = $20,000
Ending MRR:
$520,000
Headline monthly growth is:
($520,000 − $500,000) ÷ $500,000 × 100 = 4%
The company is still growing.
But it had to add $100,000 of new MRR just to produce a net $20,000 increase.
Weak retention is consuming most of the acquisition effort.
This is why pricing & growth analysis needs retention measures rather than relying solely on total revenue growth.
Price Increases and Net Revenue Retention
Suppose a company raises prices for existing customers by 10%.
If most customers accept the change, expansion revenue can increase and NRR can improve.
But if the price increase causes significant churn or downgrades, the result can reverse.
For example, starting revenue is $1 million.
Price effects add:
$100,000 Expansion
But churn caused by the change reaches:
$120,000
Ignoring other changes:
Ending Revenue From Starting Base = $980,000
NRR would fall below 100%.
The success of a price increase therefore depends on customer response, not simply the percentage increase itself.
Discounting and Customer Quality
Discounts can accelerate acquisition, but they can also change the composition of the customer base.
Suppose a temporary 30% discount doubles sign-ups.
If those customers churn much faster after the promotional period, the company may generate poor lifetime economics.
A lower initial price can also anchor customer expectations and make later increases more difficult.
Discount strategy should therefore consider retention, expansion, CAC payback, and lifetime value—not just immediate conversion.
Pricing and CAC Payback Example
Suppose customer acquisition cost is $1,200.
At the original price, the customer generates $100 of applicable monthly contribution:
Payback = $1,200 ÷ $100 = 12 Months
A price improvement raises monthly contribution to $120 without increasing churn:
New Payback = $1,200 ÷ $120 = 10 Months
Pricing improves acquisition economics by shortening the simplified payback period by two months.
If the higher price substantially reduces conversion or retention, the full business effect may differ.
Pricing and LTV:CAC Example
Suppose customer lifetime value is estimated at $4,000 and CAC is $2,000:
LTV:CAC = 2.0
A stronger pricing and retention strategy raises expected lifetime value to $6,000 with CAC unchanged:
LTV:CAC = 3.0
The economics improve materially.
But lifetime value estimates are highly sensitive to customer retention, margin, and expansion assumptions.
Improving the ratio through unrealistic forecasts creates no real economic benefit.
Growth and Margin Tradeoffs
A business can deliberately accept lower current margins to grow more quickly.
For example, it may spend heavily on:
- sales;
- marketing;
- product development;
- geographic expansion; or
- customer onboarding.
The important question is whether the spending produces durable revenue and customer economics.
A company with 50% growth and deteriorating retention may be weaker than one with 30% growth, strong expansion, healthy payback, and stable margins.
Growth quality matters.
Growth Efficiency
Suppose two companies each add $10 million of annual recurring revenue.
Company A spends $4 million in incremental commercial investment to do so.
Company B spends $15 million.
Their growth rate may look similar, but the capital required to achieve it differs dramatically.
Metrics such as sales efficiency, CAC payback, LTV:CAC, and the SaaS Magic Number help add cost context to revenue growth.
No one metric should be used alone.
Pricing & Growth Dashboard Example
Consider a subscription company with:
| Metric | Current Result |
|---|---|
| MRR | $500,000 |
| ARR | $6,000,000 |
| ARPA | $2,000/month |
| Customer churn | 2% monthly |
| GRR | 94% |
| NRR | 108% |
| Monthly MRR growth | 6% |
| CAC payback | 11 months |
No single number explains performance.
The 6% monthly MRR growth looks strong.
NRR above 100% indicates that expansion from existing customers more than offsets qualifying revenue losses.
GRR at 94% shows some underlying contraction and churn still exists.
An 11-month CAC payback provides additional information about the cost of acquiring growth.
Pricing decisions should therefore be evaluated across the system.
How Pricing Changes Flow Through Growth Metrics
Consider a 10% price increase.
It can directly increase:
ARPA or ARPU, because each customer pays more.
It can increase:
MRR and ARR, if the price change applies to recurring revenue.
It may improve:
CAC payback, if customer contribution rises.
It may improve:
LTV:CAC, if higher customer value outweighs any retention deterioration.
But it can also increase:
customer churn or revenue churn if customers reject the new price.
That can reduce:
GRR and NRR.
The same pricing action can therefore improve some metrics and damage others.
The complete outcome determines whether the change is economically successful.
How Discounts Flow Through Growth Metrics
A discount can increase conversion and therefore new-customer growth.
But it can reduce:
- ARPU;
- ARPA;
- margin;
- customer contribution; and
- CAC payback efficiency.
If customers obtained through heavy discounts also churn quickly, lifetime value can fall.
A promotion should therefore be evaluated by the cohort economics it creates rather than by the initial sign-up spike alone.
Choosing a Growth Interval
Use month-over-month growth when rapid changes matter and monthly noise is acceptable.
Use quarter-over-quarter growth when quarterly operating cycles provide a more stable view.
Use year-over-year growth when seasonality makes same-period comparisons particularly useful.
Recurring businesses can additionally track monthly recurring revenue growth to isolate changes in the recurring revenue base.
The appropriate interval depends on the decision being made.
Growth Can Be Positive While the Business Weakens
Suppose revenue grows 25%.
At the same time:
Gross Revenue Retention Falls
CAC Payback Lengthens
Discounting Increases
Margin Declines
Customer Churn Rises
The company is still growing, but every new dollar of growth may be becoming more expensive and less durable.
Headline growth therefore needs to be decomposed into acquisition, retention, expansion, pricing, and margin.
Growth Can Slow While Economics Improve
Now suppose growth falls from 50% to 30%.
Meanwhile:
NRR improves from 95% to 110%
CAC payback falls from 20 months to 12 months
Margins improve
Discount dependence falls
Customer churn declines
The business is growing more slowly but may be becoming significantly stronger.
Growth rate alone cannot measure business quality.
Common Pricing & Growth Mistakes
One common mistake is focusing on revenue growth without measuring retention.
Another is increasing prices and judging success only from ARPU while ignoring churn.
Businesses can also use discounting to produce short-term conversion improvements without calculating the effect on contribution and payback.
Another error is comparing ARR, ACV, MRR, ARPU, and ARPA as though they measure the same thing.
Growth percentages can also be misleading when the starting base is very small.
Companies may celebrate NRR above 100% while ignoring weak GRR underneath.
Finally, one metric should never be expected to summarize pricing, customer economics, and growth simultaneously.
A Practical Pricing & Growth Framework
A useful sequence begins with the commercial model.
First, determine how customers are charged: per unit, per user, per account, per transaction, subscription, usage, tier, or negotiated contract.
Then measure the resulting revenue base using the appropriate metrics such as MRR, ARR, ACV, ARPA, or ARPU.
Next, separate new revenue from existing-customer expansion.
Measure customer and revenue retention to determine how much of the base survives.
Then evaluate the cost of acquiring growth using CAC payback, LTV:CAC, and sales-efficiency metrics.
Finally, track growth over an interval appropriate to the business—monthly, quarterly, yearly, or specifically recurring-revenue growth.
This keeps each metric in its proper role rather than combining unrelated calculations into one headline number.
Frequently Asked Questions
What does pricing & growth mean?
Pricing & growth analysis examines how what a business charges affects revenue, customer behavior, retention, expansion, acquisition economics, margins, and the rate at which the business grows.
What is the basic pricing and revenue formula?
At its simplest:
Revenue = Price × Quantity
Subscription and recurring-revenue models require additional metrics because customers can remain, expand, contract, or churn over time.
Does raising prices always increase revenue?
No.
Higher prices increase revenue per retained unit or customer, but they can also reduce demand, conversion, or retention.
The net effect depends on customer response.
Does discounting always increase growth?
No.
Discounts may increase short-term conversion or unit volume, but they can reduce margin, ARPU, payback efficiency, and potentially long-term customer quality.
What is the difference between ARR and ACV?
ARR measures the annualized recurring revenue base.
ACV measures the annualized value of an individual contract under its defined commercial calculation.
They can be related but are not interchangeable.
What is the difference between ARPA and ARPU?
Average revenue per account uses customer accounts as the denominator.
Average revenue per user uses individual users.
One account can contain many users, so the two metrics can differ substantially.
Why is customer churn important to growth?
A company must replace lost customers before acquisition produces net customer growth.
High churn can therefore consume a large portion of new-customer acquisition.
What is the difference between GRR and NRR?
Gross revenue retention excludes expansion and shows how much starting revenue survives churn and contraction.
Net revenue retention includes expansion from existing customers.
Can NRR exceed 100%?
Yes.
If expansion revenue from retained customers exceeds churn and contraction, the starting customer base can grow without new customer acquisition.
Why track expansion revenue?
Expansion shows how effectively existing customer relationships generate additional revenue through upgrades, additional seats, usage, cross-sells, or other growth mechanisms.
How does pricing affect CAC payback?
Higher customer contribution can shorten CAC payback if acquisition cost and retention remain comparable.
A price increase that causes heavy churn can offset that benefit.
What does LTV:CAC measure?
It compares estimated customer lifetime value with the cost required to acquire the customer.
Its usefulness depends heavily on realistic retention, margin, and lifetime assumptions.
What is sales efficiency?
Sales efficiency evaluates how effectively commercial spending generates incremental revenue or recurring revenue under the chosen methodology.
It complements growth rate by showing the cost of generating that growth.
Which growth rate should a business use?
Month-over-month is useful for short-term movement, quarter-over-quarter for quarterly trends, and year-over-year for comparable annual periods. Recurring businesses may also track MRR growth specifically.
Is faster growth always better?
No.
Growth that depends on weak margins, excessive acquisition cost, poor retention, or unsustainable discounting can destroy economic value.
Why is retention important when evaluating pricing?
A price that raises revenue per customer but causes enough customers to leave can reduce total revenue and lifetime value.
Retention reveals whether customers continue accepting the value proposition.
What is value-based pricing?
Value-based pricing sets price primarily with reference to customer value and willingness to pay rather than relying only on cost plus a markup.
How should pricing & growth metrics be used together?
Use pricing metrics to understand what customers pay, recurring-revenue metrics to measure the revenue base, retention metrics to measure durability, expansion metrics to measure existing-customer growth, acquisition metrics to evaluate growth cost, and growth rates to measure how quickly the business is changing. Together they provide a far stronger view than any single metric.




