


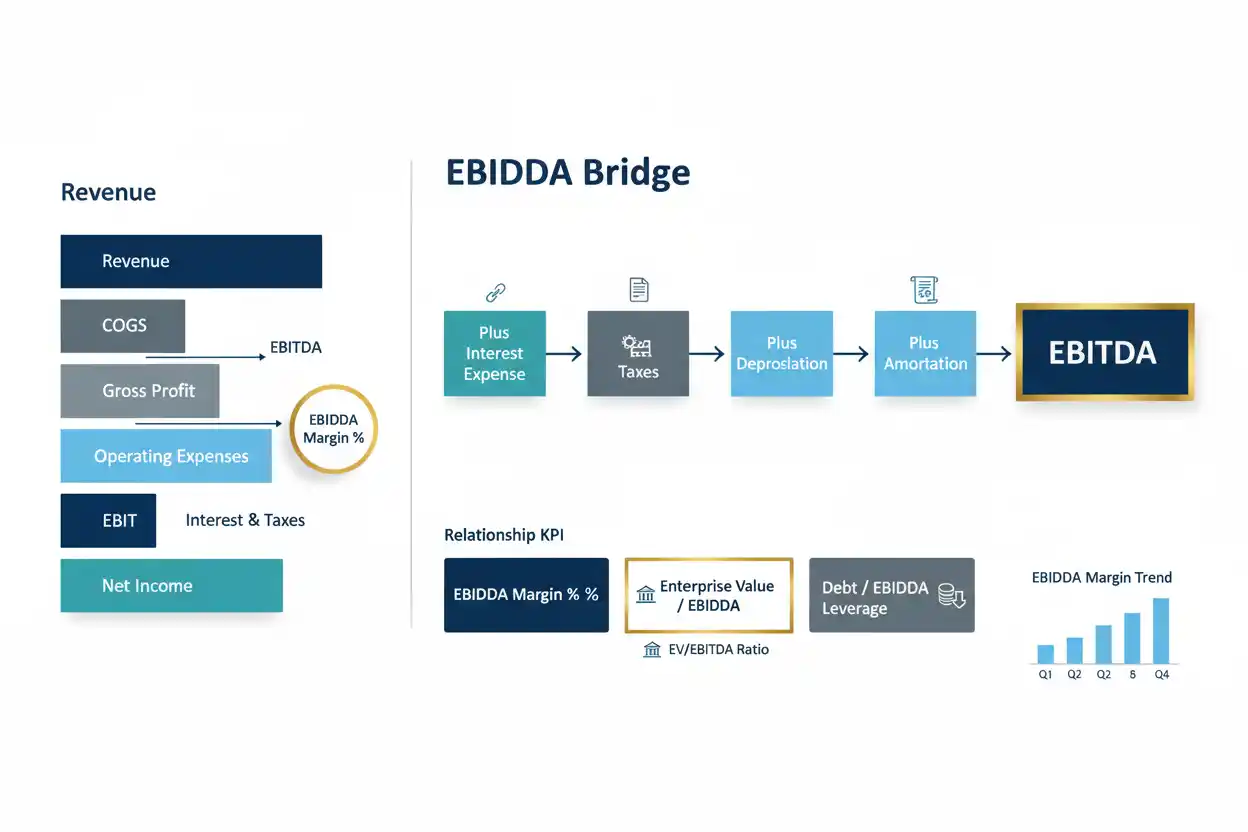
EBITDA stands for earnings before interest, taxes, depreciation and amortization. It is a profitability measure used to examine earnings before financing costs, income taxes, and the accounting charges for depreciation and amortization.
A common formula starts with net income:
EBITDA = Net Income + Interest + Taxes + Depreciation + Amortization
It can also be calculated from EBIT:
EBITDA = EBIT + Depreciation + Amortization
Suppose a company reports:
Net income = $700,000
Interest expense = $100,000
Income tax expense = $200,000
Depreciation = $150,000
Amortization = $50,000
Then:
EBITDA = $700,000 + $100,000 + $200,000 + $150,000 + $50,000
EBITDA = $1,200,000
The business generated $1.2 million of EBITDA under that calculation.
The U.S. Securities and Exchange Commission describes EBITDA as earnings before interest, taxes, depreciation and amortization and treats standard EBITDA as distinct from measures that make additional adjustments.
EBITDA can be useful for comparing operating performance across businesses with different financing structures, tax circumstances and depreciation or amortization charges. However, it is not cash flow, does not deduct capital expenditures, and should not be treated as money automatically available to owners or lenders.
Within business finance, EBITDA is most useful when interpreted alongside EBIT, operating cash flow, free cash flow, leverage, margins and capital requirements.
What Does EBITDA Mean?
EBITDA removes four categories from the earnings calculation:
Interest reflects financing costs.
Taxes reflect income-tax expense.
Depreciation allocates the recorded cost of qualifying tangible assets over their accounting lives.
Amortization performs a similar accounting function for qualifying intangible assets.
By looking before those items, EBITDA provides a view of earnings generated by the business before those financing, tax and noncash accounting charges.
The SEC’s current non-GAAP guidance specifically identifies EBITDA as earnings before interest, taxes, depreciation and amortization. It also states that a measure making additional adjustments should not simply be characterized as EBITDA without distinguishing the modified measure appropriately.
That distinction is important because EBITDA and Adjusted EBITDA are not automatically the same number.
EBITDA Formula
The most familiar formula is:
EBITDA = Net Income + Interest Expense + Income Tax Expense + Depreciation + Amortization
Suppose:
Net income = $1,000,000
Interest = $200,000
Taxes = $300,000
Depreciation = $250,000
Amortization = $50,000
Then:
EBITDA = $1,000,000 + $200,000 + $300,000 + $250,000 + $50,000
EBITDA = $1,800,000
If EBIT is already known, the calculation is shorter:
EBITDA = EBIT + Depreciation + Amortization
With EBIT of $1.5 million and total depreciation and amortization of $300,000:
EBITDA = $1,500,000 + $300,000
EBITDA = $1,800,000
Both routes lead to the same result when the underlying classifications are consistent.
EBITDA Example From an Income Statement
Consider a fictional company with:
Revenue = $8,000,000
Cost of goods sold excluding D&A = $4,000,000
Operating expenses excluding D&A = $1,500,000
Depreciation = $500,000
Amortization = $200,000
Interest expense = $300,000
Income tax expense = $400,000
First calculate earnings before D&A:
EBITDA = $8,000,000 − $4,000,000 − $1,500,000
EBITDA = $2,500,000
Then deduct depreciation and amortization:
EBIT = $2,500,000 − $500,000 − $200,000
EBIT = $1,800,000
After interest:
Earnings Before Tax = $1,800,000 − $300,000
Earnings Before Tax = $1,500,000
After income tax:
Net Income = $1,500,000 − $400,000
Net Income = $1,100,000
Check EBITDA from the bottom up:
EBITDA = $1,100,000 + $300,000 + $400,000 + $500,000 + $200,000
EBITDA = $2,500,000
The calculation reconciles.
EBITDA vs EBIT
The difference between EBITDA and EBIT is depreciation and amortization.
EBITDA = EBIT + Depreciation + Amortization
or:
EBIT = EBITDA − Depreciation − Amortization
Suppose EBITDA is $4 million and depreciation plus amortization equals $1.2 million.
EBIT = $4,000,000 − $1,200,000
EBIT = $2,800,000
EBITDA removes those accounting expenses.
EBIT retains them.
This distinction can be economically significant for asset-intensive companies.
A factory, airline, telecommunications network or logistics business may require substantial investment in assets that depreciate over time. Ignoring depreciation can make current-period operating earnings look stronger, but the productive assets eventually need maintenance or replacement.
Why EBITDA Is Usually Higher Than EBIT
When depreciation and amortization are positive:
EBITDA > EBIT
Suppose:
EBIT = $900,000
Depreciation = $250,000
Amortization = $50,000
EBITDA = $900,000 + $250,000 + $50,000
EBITDA = $1,200,000
The $300,000 difference does not mean the company suddenly created another $300,000 of cash.
EBITDA simply removes those expenses from the earnings measure.
That distinction is fundamental.
Can EBITDA Equal EBIT?
Yes.
If depreciation and amortization are both zero:
EBITDA = EBIT
This may occur in a business with minimal depreciable or amortizable assets.
In practice, many businesses have at least some depreciation, amortization or both.
Can EBITDA Be Lower Than EBIT?
Under the conventional formulas and positive depreciation and amortization expenses, EBITDA should generally be equal to or greater than EBIT.
If reported EBITDA is lower than EBIT, investigate the calculation.
The company may be using a modified definition, unusual adjustments may exist, or the numbers may come from inconsistent reporting periods.
EBITDA vs Operating Income
Operating income and EBITDA are not identical.
Operating income generally includes depreciation and amortization when those expenses are part of operations.
EBITDA adds them back.
Suppose:
Operating income = $2 million
Depreciation = $400,000
Amortization = $100,000
If operating income corresponds with EBIT:
EBITDA = $2,000,000 + $400,000 + $100,000
EBITDA = $2,500,000
A historical SEC-filed AT&T presentation, for example, defined EBITDA as operating income before depreciation and amortization.
The exact reconciliation still depends on the company’s financial-statement structure.
EBITDA vs Net Income
Net profit includes expenses that EBITDA excludes.
A simplified relationship is:
Net Income = EBITDA − Depreciation − Amortization − Interest − Taxes
Suppose EBITDA equals $3 million.
Depreciation = $500,000
Amortization = $100,000
Interest = $400,000
Taxes = $500,000
Net Income = $3,000,000 − $500,000 − $100,000 − $400,000 − $500,000
Net Income = $1,500,000
The company’s EBITDA is twice its net income in this example.
Neither number is inherently more important.
They answer different questions.
EBITDA vs Gross Profit
Gross profit measures revenue after cost of goods sold.
EBITDA also reflects operating expenses beyond cost of goods sold, while excluding depreciation and amortization according to the EBITDA definition.
Suppose:
Revenue = $10 million
COGS = $6 million
Gross Profit = $4 million
Operating expenses before D&A = $2 million
EBITDA = $4 million − $2 million
EBITDA = $2 million
Gross profit therefore describes product or service economics earlier in the income statement, while EBITDA reflects a broader operating expense structure.
EBITDA Margin Formula
EBITDA margin expresses EBITDA as a percentage of revenue.
EBITDA Margin = EBITDA ÷ Revenue × 100
Suppose EBITDA is $1.5 million on $6 million of revenue.
EBITDA Margin = $1,500,000 ÷ $6,000,000 × 100
EBITDA Margin = 25%
The company generates approximately 25 cents of EBITDA for every $1 of revenue under the calculation.
A current 2026 SEC filing from MasterBrand explicitly defines EBITDA as earnings before interest, taxes, depreciation and amortization and separately defines adjusted EBITDA margin relative to sales, demonstrating current corporate use of EBITDA-based performance margins.
What Is a Good EBITDA Margin?
There is no universal good EBITDA margin.
Industry economics differ too much.
A software company may have a very different margin structure from a supermarket, construction contractor, airline or manufacturer.
Capital intensity also matters.
A company can report an attractive EBITDA margin while requiring enormous recurring capital expenditure.
Another can report a lower EBITDA margin but convert a much larger percentage of earnings into free cash flow.
The useful comparison is against the company’s history and genuinely comparable businesses with similar accounting and operating economics.
EBITDA and Depreciation
Depreciation is added back to EBIT when calculating EBITDA.
That does not mean depreciation is economically meaningless.
Suppose a delivery company owns trucks worth millions of dollars.
Depreciation may not involve a cash payment in the current period, but the trucks physically wear out and eventually need replacement.
EBITDA removes the current accounting depreciation charge.
It does not pay for replacement vehicles.
This is one of EBITDA’s most important limitations.
EBITDA and Amortization
Amortization is also added back.
For a company with acquired intangible assets, amortization can be substantial.
Suppose an acquisition created customer-relationship and technology intangibles that produce $500,000 of annual amortization.
EBITDA removes that $500,000 expense from its profitability measure.
Whether that exclusion improves economic analysis depends on the purpose.
Some amortization relates to historical acquisition accounting and may not require equivalent recurring reinvestment.
Other intangible investment may remain economically essential to the business.
Why Interest Is Excluded
Interest reflects the financing structure.
Suppose two otherwise identical companies each generate $5 million of operating earnings before financing effects.
Company A has almost no debt.
Company B borrowed heavily and pays $2 million of annual interest.
Their net profits differ materially because of capital structure.
EBITDA allows analysts to look at earnings before that financing difference.
However, shareholders and creditors cannot ignore interest indefinitely.
Debt service remains a real financial obligation.
Why Taxes Are Excluded
Taxes can differ because of jurisdiction, legal structure, taxable-income timing, credits, historical losses and other factors.
Removing income taxes can improve certain operating comparisons.
However, taxes remain a real economic and cash cost over time.
EBITDA should therefore not be interpreted as an after-tax return available to investors.
Is EBITDA a GAAP Measure?
For U.S. public-company reporting, EBITDA is generally a non-GAAP financial measure rather than a GAAP subtotal.
The SEC’s non-GAAP guidance specifically discusses EBIT and EBITDA and requires appropriate reconciliation and presentation when registrants use such measures.
This does not make EBITDA invalid.
It means users should understand how it was derived and reconcile it to standardized financial statements rather than treating the number as independently standardized.
EBITDA vs Adjusted EBITDA
Standard EBITDA adds back only the items identified by its name:
Interest
Taxes
Depreciation
Amortization
Adjusted EBITDA can make additional exclusions.
A company might remove restructuring charges, acquisition costs, impairments, stock compensation or other items depending on its stated methodology.
The SEC has specifically told issuers that a metric called EBITDA should reflect only the standard interest, tax, depreciation and amortization adjustments; measures containing additional exclusions should be distinguished appropriately, such as by labeling them Adjusted EBITDA.
Therefore:
Adjusted EBITDA ≠ EBITDA Automatically
The reconciliation matters.
Adjusted EBITDA Example
Suppose standard EBITDA equals $5 million.
Management also identifies:
Restructuring charge = $400,000
Acquisition-related expense = $250,000
A company-defined adjusted EBITDA might be:
Adjusted EBITDA = $5,000,000 + $400,000 + $250,000
Adjusted EBITDA = $5,650,000
This does not make $5.65 million the standard EBITDA figure.
It is an additional non-GAAP adjustment framework whose exclusions should be disclosed clearly.
The Problem With Too Many Adjustments
Adjusted EBITDA becomes less useful when management repeatedly excludes normal economic costs.
Suppose a business excludes restructuring costs every year.
At some point, calling restructuring permanently “nonrecurring” becomes questionable as an analytical assumption.
Likewise, stock-based compensation can be noncash in the current period while still diluting shareholders economically.
The analyst should therefore examine every adjustment rather than assuming “adjusted” means more accurate.
EBITDA Is Not Cash Flow
This is one of the most important distinctions.
EBITDA does not measure actual cash generated by the business.
It generally does not reflect changes in accounts receivable, inventory, accounts payable or other working-capital balances.
It does not deduct capital expenditures.
It does not deduct debt principal repayments.
It excludes interest and income taxes even though those can require cash.
SEC-filed disclosures regularly warn that EBITDA should not be considered an alternative to cash from operating activities as a liquidity measure.
EBITDA vs Operating Cash Flow
Operating cash flow records cash generated or consumed by operating activities according to the applicable cash-flow presentation.
EBITDA is an earnings measure.
Suppose EBITDA is $2 million.
During the same period, accounts receivable increases by $1 million because customers have not paid yet.
Inventory rises by $500,000.
Those working-capital movements can materially reduce operating cash generation even though EBITDA remains strong.
Therefore:
EBITDA answers a profitability question.
Operating cash flow answers a cash-generation question.
EBITDA vs Free Cash Flow
Free cash flow goes further by incorporating specified capital investment.
A simplified relationship often used for conceptual discussion is:
Free Cash Flow ≈ Operating Cash Flow − Capital Expenditures
Suppose:
EBITDA = $10 million
Operating cash flow = $7 million
Capital expenditure = $5 million
Free Cash Flow = $7 million − $5 million
Free Cash Flow = $2 million
The company reports $10 million of EBITDA but only $2 million of free cash flow under this simplified example.
The $8 million difference is economically important.
EBITDA and Working Capital
Working capital can explain why EBITDA fails to convert into cash.
Suppose revenue rises rapidly.
EBITDA improves.
However, customers take longer to pay and inventory increases ahead of future orders.
Cash becomes tied up in receivables and inventory.
The company can therefore report strong EBITDA growth while simultaneously needing additional financing.
Profitability and liquidity are separate dimensions.
EBITDA and Days Sales Outstanding
Days sales outstanding helps reveal whether customer collections support reported operating earnings.
Suppose EBITDA rises 25%, but DSO rises from 35 days to 80 days.
The company is generating more earnings before D&A, interest and tax but waiting much longer for cash from customers.
That divergence deserves attention.
EBITDA and Inventory
Inventory can similarly absorb cash.
Days inventory outstanding and inventory turnover help show how efficiently inventory moves.
A company can have high EBITDA margins while maintaining inefficient inventory levels.
The accounting profitability of a sale does not determine how long cash was tied up before that sale occurred.
EBITDA and Supplier Payments
Days payable outstanding affects when the company pays suppliers.
Longer legitimate payment terms can preserve cash without changing EBITDA immediately.
This illustrates again why EBITDA and liquidity should not be treated as equivalent.
The cash conversion cycle brings inventory, receivables and supplier-payment timing together.
EBITDA and Capital Expenditure
Capital expenditure is arguably the most important omission when evaluating EBITDA for asset-intensive businesses.
Suppose Company A and Company B each report $20 million of EBITDA.
Company A requires only $1 million of annual maintenance capital expenditure.
Company B requires $12 million just to maintain existing productive capacity.
Their headline EBITDA is identical.
Their cash economics are dramatically different.
Any serious EBITDA analysis should therefore review the assets required to produce those earnings.
EBITDA and Maintenance Capex
Not all capital expenditure is the same.
A company may spend money to maintain existing operations or invest for future expansion.
Maintenance capex aims to sustain current productive capacity.
Growth capex expands the business.
The distinction is not always clean, but it matters when evaluating EBITDA.
If a company needs heavy recurring maintenance spending, ignoring depreciation can overstate the amount of earnings economically available after maintaining its asset base.
EBITDA and Asset-Light Businesses
EBITDA can be particularly intuitive for asset-light businesses with minimal depreciation and amortization because the difference between EBITDA and EBIT may be small.
Suppose:
EBITDA = $5 million
D&A = $100,000
EBIT = $4.9 million
The two measures tell relatively similar profitability stories.
Capital expenditure and working capital still need separate analysis.
EBITDA and Asset-Intensive Businesses
For an asset-heavy company:
EBITDA = $10 million
D&A = $5 million
EBIT = $5 million
Half of EBITDA disappears once depreciation and amortization are recognized.
That does not mean EBIT is automatically the superior metric.
It means the difference contains economically relevant information.
Analysts should ask how much recurring capital investment is required to maintain the assets producing EBITDA.
EBITDA and Interest Coverage
Interest coverage is commonly calculated from EBIT rather than EBITDA in its basic form:
Interest Coverage = EBIT ÷ Interest Expense
However, lenders sometimes use EBITDA-based coverage or leverage measures under specific agreements.
For example:
Debt-to-EBITDA = Debt ÷ EBITDA
or company-specific interest-coverage definitions.
These contractual calculations should not be assumed to match generic textbook ratios.
Debt-to-EBITDA
Debt-to-EBITDA compares borrowing with EBITDA.
Debt-to-EBITDA = Total Debt ÷ EBITDA
Suppose:
Debt = $12 million
EBITDA = $4 million
Debt-to-EBITDA = $12 million ÷ $4 million
Debt-to-EBITDA = 3.0×
The company carries debt equal to three times annual EBITDA under the calculation.
This is different from the debt ratio, which compares debt with assets, and the debt-to-equity ratio, which compares debt with shareholder equity.
Net Debt-to-EBITDA
Analysts also use net debt:
Net Debt = Debt − Cash and Cash Equivalents
Then:
Net Debt-to-EBITDA = Net Debt ÷ EBITDA
Suppose:
Debt = $12 million
Cash = $4 million
EBITDA = $4 million
Net Debt = $8 million
Net Debt-to-EBITDA = $8 million ÷ $4 million
Net Debt-to-EBITDA = 2.0×
This gives cash credit against gross borrowing.
The precise cash and debt definitions should remain consistent.
EBITDA and Debt-to-Equity Ratio
The debt-to-equity ratio describes balance-sheet leverage.
EBITDA adds an earnings perspective.
Suppose two companies each have a D/E ratio of 1.0.
Company A generates $20 million of EBITDA.
Company B generates $3 million.
The same balance-sheet leverage can therefore have very different implications for repayment capacity.
Still, EBITDA itself does not pay debt unless it converts into cash.
EBITDA and Degree of Combined Leverage
Degree of combined leverage uses EBIT rather than EBITDA as the central bridge between operating and financial leverage in the standard simplified model.
Depreciation and amortization remain operating expenses within EBIT.
Replacing EBIT with EBITDA mechanically would therefore change the leverage relationship.
EBITDA is useful alongside leverage analysis, but it does not replace the defined earnings measure in every formula.
EBITDA and Financial Leverage
Financial leverage examines the consequences of financing the business with debt or other fixed financing claims.
EBITDA intentionally removes interest.
That allows comparison before financing expense.
However, high EBITDA does not make leverage irrelevant.
A business with significant debt should compare EBITDA with debt, interest, capital spending and actual cash generation before determining whether borrowing is sustainable.
EBITDA and Break-Even Analysis
Break-even analysis is usually built from contribution margin and fixed operating costs rather than EBITDA itself.
However, EBITDA can provide a useful view of earnings after cash-oriented operating expenses but before D&A in a simplified operating structure.
If EBITDA approaches zero, the company’s earnings before D&A, interest and tax are becoming very thin.
The exact break-even point should remain on its dedicated page because cost behavior, not simply EBITDA, determines the required sales threshold.
EBITDA and Contribution Margin
Contribution margin measures sales remaining after variable costs.
EBITDA is further down the profitability structure after additional operating expenses.
Suppose:
Revenue = $5 million
Variable costs = $3 million
Contribution Margin = $2 million
Cash-oriented fixed operating costs = $1.2 million
EBITDA = $800,000
Depreciation = $200,000
EBIT = $600,000
Each measure answers a distinct profitability question.
EBITDA and Gross Margin
Gross margin measures gross profit relative to revenue.
EBITDA margin accounts for operating costs beyond cost of goods sold.
Suppose:
Revenue = $10 million
Gross profit = $5 million
EBITDA = $2 million
Gross Margin = 50%
EBITDA Margin = 20%
The 30-percentage-point difference reflects operating expenses between gross profit and EBITDA under the company’s classifications.
EBITDA and Operating Margin
Operating margin commonly uses operating income or EBIT relative to revenue.
Because EBIT normally deducts depreciation and amortization while EBITDA does not, EBITDA margin is often higher.
Suppose:
Revenue = $20 million
EBITDA = $5 million
EBIT = $3.5 million
EBITDA Margin = 25%
EBIT Margin = 17.5%
The gap reflects $1.5 million of D&A.
EBITDA and Net Profit Margin
Net profit margin includes financing and tax effects that EBITDA excludes.
A company can therefore show a strong EBITDA margin but a weak net margin when interest is heavy.
Suppose:
Revenue = $10 million
EBITDA = $3 million
D&A = $500,000
Interest = $1.5 million
Tax = $250,000
EBITDA margin:
30%
Net income:
$3 million − $500,000 − $1.5 million − $250,000 = $750,000
Net margin:
$750,000 ÷ $10 million = 7.5%
The company looks far less profitable after financing and tax.
EBITDA and Business Valuation
Business valuation frequently uses enterprise-value-to-EBITDA multiples.
EV/EBITDA = Enterprise Value ÷ EBITDA
Suppose:
Enterprise value = $50 million
EBITDA = $5 million
EV/EBITDA = $50 million ÷ $5 million
EV/EBITDA = 10×
This means the enterprise value equals ten times the EBITDA used in the calculation.
It does not prove the business is worth ten times EBITDA in every transaction.
Growth, risk, margins, capital expenditure, customer concentration, debt, industry conditions and comparable transactions all affect valuation.
Why Enterprise Value Is Paired With EBITDA
Enterprise value represents the operating business available to both debt and equity capital providers under a common valuation framework.
EBITDA is calculated before interest expense, so it is also measured before the capital structure divides operating economics between lenders and shareholders.
That makes EV/EBITDA conceptually more consistent than comparing enterprise value with a post-interest earnings measure such as net income.
EBITDA Multiple Example
Suppose a comparable-business analysis suggests an 8× EV/EBITDA multiple and the subject company produces $4 million of sustainable EBITDA.
A simplified enterprise-value estimate is:
Enterprise Value = EBITDA × EV/EBITDA Multiple
Enterprise Value = $4,000,000 × 8
Enterprise Value = $32,000,000
If relevant net debt is $10 million:
Illustrative Equity Value = $32,000,000 − $10,000,000
Illustrative Equity Value = $22,000,000
This is a simplified illustration, not a complete valuation.
The appropriate EBITDA, multiple, debt adjustments and other claims all require analysis.
EBITDA vs EBIT in Valuation
Suppose:
Enterprise value = $40 million
EBITDA = $5 million
EBIT = $3 million
EV/EBITDA = 8×
EV/EBIT ≈ 13.3×
The difference exists because EBITDA adds back D&A.
For a capital-intensive company, EV/EBIT can highlight the cost of asset consumption more directly.
For companies where D&A differs materially because of acquisition accounting or asset age, EBITDA can help normalize certain comparisons.
Neither multiple should be used without understanding why the denominator differs.
EBITDA and Acquisition Analysis
Acquirers often evaluate EBITDA because financing structure and tax circumstances can change after a transaction.
A buyer may refinance debt.
Corporate tax circumstances can differ.
Acquisition accounting can create new amortization charges.
Looking at earnings before those items can therefore help compare operating performance.
However, acquisition economics also depend on capital requirements, integration costs, synergies, working capital and purchase price.
EBITDA is only one part of the transaction model.
EBITDA and Private Businesses
EBITDA is widely used in private-company analysis because owner compensation, financing choices and discretionary expenses can vary.
Analysts may make normalization adjustments when estimating sustainable earnings.
Those adjustments should be documented carefully.
Removing legitimate recurring costs simply to increase a valuation multiple can overstate economic performance.
A normalized earnings measure should aim to represent sustainable operations, not the highest possible number.
EBITDA and Economic Value Added
Economic value added asks whether a company’s operating return exceeds the cost of capital employed.
EBITDA does not deduct depreciation or the capital charge associated with assets.
A company can therefore generate positive—and even rapidly growing—EBITDA while failing to earn an adequate return on invested capital.
The distinction is particularly important for businesses requiring large amounts of capital to create that EBITDA.
EBITDA and Return on Assets
Return on assets examines profitability relative to the asset base.
A company can report strong EBITDA while using enormous assets inefficiently.
Suppose:
Company A EBITDA = $10 million on $25 million of assets.
Company B EBITDA = $10 million on $200 million of assets.
Their EBITDA is identical.
Their asset intensity is not.
A profitability measure should therefore be paired with capital-efficiency analysis.
EBITDA and Asset Turnover
Asset turnover measures revenue relative to assets.
Combining EBITDA margin and asset turnover can help explain how a company produces operating earnings.
One business may generate high margins from a slow-turning asset base.
Another may produce narrow margins but turn assets quickly.
The headline EBITDA amount alone does not reveal those differences.
EBITDA and Return on Equity
Return on equity concerns earnings relative to shareholder equity.
EBITDA is measured before interest and taxes and therefore before much of the financing structure’s effect on shareholders.
A heavily leveraged company can report high EBITDA while equity returns become weak because interest consumes much of the remaining earnings.
ROE and EBITDA belong at different levels of the financial model.
EBITDA and Cash Flow Forecasting
Cash flow forecasting should never use EBITDA as if it were forecast cash.
Suppose projected EBITDA next quarter is $2 million.
During the same quarter:
Receivables increase $500,000
Inventory increases $300,000
Capital expenditure is $600,000
Interest payments are $200,000
Taxes paid are $150,000
The resulting cash movement will differ substantially from $2 million.
A proper forecast models each cash receipt and payment according to timing.
EBITDA and Burn Rate
For startups and growth businesses, EBITDA may remain negative while the company scales.
Burn rate measures actual cash consumption rather than accounting EBITDA loss.
Suppose EBITDA is negative $500,000 per month but substantial noncash expenses are included elsewhere or working-capital movements provide temporary cash benefits.
Cash burn can differ.
The two numbers should not be substituted.
EBITDA and Cash Runway
Cash runway is based on available cash and net cash burn.
A company cannot calculate reliable runway simply by dividing cash by negative EBITDA.
Actual cash outflows can differ because of capital spending, working capital, financing, taxes and noncash expenses.
EBITDA may help explain operating trajectory, but runway requires cash-based inputs.
Negative EBITDA
EBITDA can be negative.
Suppose:
Revenue = $1 million
Operating expenses before D&A, interest and tax = $1.3 million
EBITDA = $1,000,000 − $1,300,000
EBITDA = −$300,000
The company is losing money before even accounting for depreciation, amortization, interest and taxes.
That can occur during startup expansion, temporary disruption or structural unprofitability.
Negative EBITDA should prompt investigation into revenue, contribution margin and operating expenses.
Positive EBITDA and Negative Net Income
A company can have positive EBITDA but negative net income.
Suppose:
EBITDA = $2 million
D&A = $800,000
Interest = $1 million
Taxes and other applicable net charges = $300,000
Net Result = $2,000,000 − $800,000 − $1,000,000 − $300,000
Net Result = −$100,000
The business appears profitable at the EBITDA level but loses money after asset charges and financing costs.
This situation is common enough that EBITDA should never be read as equivalent to bottom-line profitability.
Positive EBITDA and Negative Free Cash Flow
A company can also have positive EBITDA while producing negative free cash flow.
Suppose:
EBITDA = $5 million
Operating cash flow = $3 million
Capital expenditure = $6 million
Free Cash Flow = $3 million − $6 million
Free Cash Flow = −$3 million
The company generated strong EBITDA but spent more cash on capital assets than operations produced.
This example captures the central limitation of relying on EBITDA alone.
How to Improve EBITDA
EBITDA improves when revenue grows faster than cash-oriented operating expenses, gross economics improve, operating costs become more efficient, or sales mix shifts toward stronger products.
Suppose revenue grows 15% while relevant operating expenses grow only 5%.
EBITDA can expand faster than sales.
This is often described as operating leverage.
However, management should verify that EBITDA improvements convert into EBIT, cash flow and acceptable returns on capital.
EBITDA Growth
Suppose EBITDA changes:
Year 1 = $5 million
Year 2 = $6 million
Year 3 = $8 million
The trend looks positive.
The next questions are more important.
Did revenue grow?
Did EBITDA margin expand?
Was the increase organic?
Did acquisitions create it?
Were recurring expenses reclassified into Adjusted EBITDA add-backs?
Did capital expenditure rise at the same time?
Growth quality matters more than the headline percentage alone.
EBITDA Margin Expansion
Suppose revenue rises from $10 million to $12 million.
EBITDA rises from $2 million to $3 million.
Old margin:
$2 million ÷ $10 million = 20%
New margin:
$3 million ÷ $12 million = 25%
The company generated both revenue growth and EBITDA margin expansion.
That can indicate stronger pricing, gross economics or operating leverage.
Management should still determine whether the improvement is sustainable.
EBITDA Margin Compression
Suppose revenue rises 10%, but EBITDA rises only 2%.
EBITDA margin falls.
Potential causes include higher input costs, wage inflation, price discounting, unfavorable product mix, investment ahead of growth or declining operating efficiency.
Margin compression does not automatically mean management is making a poor decision.
A company may intentionally invest in new markets or capacity.
The purpose of the ratio is to expose the trade-off.
Common EBITDA Mistakes
The first mistake is treating EBITDA as cash flow.
Another is ignoring capital expenditure.
A third is assuming depreciation is meaningless merely because it is noncash in the current period.
Analysts can also confuse EBIT and EBITDA.
Comparing standard EBITDA from one company with heavily adjusted EBITDA from another can distort conclusions.
Another common problem is applying an EBITDA multiple without considering debt, capital intensity or sustainable earnings.
Finally, EBITDA should not be assumed to be a standardized GAAP result.
The definition and reconciliation need review.
Limitations of EBITDA
EBITDA removes real economic considerations.
Interest is a real cost for leveraged businesses.
Taxes matter.
Assets wear out or become obsolete.
Capital expenditures consume cash.
Working capital can absorb substantial liquidity.
The measure can also be modified through company-specific adjustments.
SEC guidance therefore treats EBITDA within the non-GAAP reporting framework and requires appropriate reconciliation rather than allowing it to replace standardized financial results.
EBITDA’s strength is comparability at a particular level of earnings.
Its weakness is everything it intentionally leaves out.
How to Analyze EBITDA Properly
Start by verifying the definition.
Determine whether the figure is standard EBITDA or Adjusted EBITDA.
Reconcile it with net income or the nearest comparable financial-statement measure.
Then compare EBITDA with EBIT.
Calculate EBITDA margin.
Review depreciation and amortization.
Analyze capital expenditure.
Compare EBITDA with operating cash flow and free cash flow.
Then examine debt-to-EBITDA, interest obligations and maturity schedules.
Review working-capital requirements.
Finally, determine whether the capital invested in the business generates acceptable economic returns.
The useful question is not:
“How much EBITDA do we have?”
It is:
“How much sustainable operating earnings does the business produce before these adjustments, what investment is required to sustain those earnings, and how much of that EBITDA ultimately converts into cash and value?”
Frequently Asked Questions
What does EBITDA stand for?
EBITDA stands for earnings before interest, taxes, depreciation and amortization.
What is the EBITDA formula?
A common formula is:
EBITDA = Net Income + Interest + Taxes + Depreciation + Amortization
How do you calculate EBITDA from EBIT?
EBITDA = EBIT + Depreciation + Amortization
What is EBITDA margin?
EBITDA Margin = EBITDA ÷ Revenue × 100
It expresses EBITDA as a percentage of revenue.
What is the difference between EBIT and EBITDA?
EBIT includes depreciation and amortization expense. EBITDA adds those expenses back.
Is EBITDA the same as operating income?
No. Operating income generally includes depreciation and amortization, while EBITDA removes them. The exact reconciliation depends on the financial-statement presentation.
Is EBITDA the same as net income?
No. Net income generally reflects depreciation, amortization, interest and income taxes, while EBITDA excludes all four.
Is EBITDA cash flow?
No. EBITDA does not account fully for working-capital changes, capital expenditure, interest, taxes or debt principal payments.
Is EBITDA a GAAP measure?
In U.S. public-company reporting, EBITDA is generally treated as a non-GAAP measure and should be reconciled appropriately when presented.
What is Adjusted EBITDA?
Adjusted EBITDA begins with EBITDA and makes additional company-defined adjustments. Those adjustments should be identified clearly because adjusted measures can differ substantially across companies.
Can EBITDA be negative?
Yes. Negative EBITDA means operating expenses before interest, taxes, depreciation and amortization exceed revenue under the calculation.
Can EBITDA be positive while net income is negative?
Yes. Depreciation, amortization, interest, taxes and other applicable expenses can reduce positive EBITDA to a net loss.
What is EV/EBITDA?
EV/EBITDA = Enterprise Value ÷ EBITDA
It is a valuation multiple comparing enterprise value with EBITDA.
What is debt-to-EBITDA?
Debt-to-EBITDA = Total Debt ÷ EBITDA
It compares debt with the company’s EBITDA under the selected definitions.
Is higher EBITDA always better?
Not automatically. Higher EBITDA can still accompany weak free cash flow, excessive capital expenditure, high debt or poor returns on invested capital.
Final Perspective
EBITDA provides a widely used view of profitability before four specific items:
Interest + Taxes + Depreciation + Amortization
The basic calculation is:
EBITDA = Net Income + Interest + Taxes + Depreciation + Amortization
or:
EBITDA = EBIT + Depreciation + Amortization
Its usefulness comes from removing financing, taxation and D&A from the initial operating comparison.
Its limitations come from those same exclusions.
Depreciation may be noncash today, but assets still require investment.
Interest is excluded, but lenders still expect payment.
Taxes are excluded, but businesses still pay taxes.
Working capital is absent.
Capital expenditure is absent.
Debt principal is absent.
That makes EBITDA a useful analytical layer—not a complete description of financial performance.
The strongest analysis therefore moves beyond the headline number and asks:
How much of EBITDA becomes EBIT? How much becomes operating cash flow? How much survives capital expenditure? How much debt does it support? And how much sustainable economic value does the capital employed actually create?
Those questions place EBITDA in its proper role: an important operating-performance measure that becomes far more useful when connected with the rest of the financial statements.




