


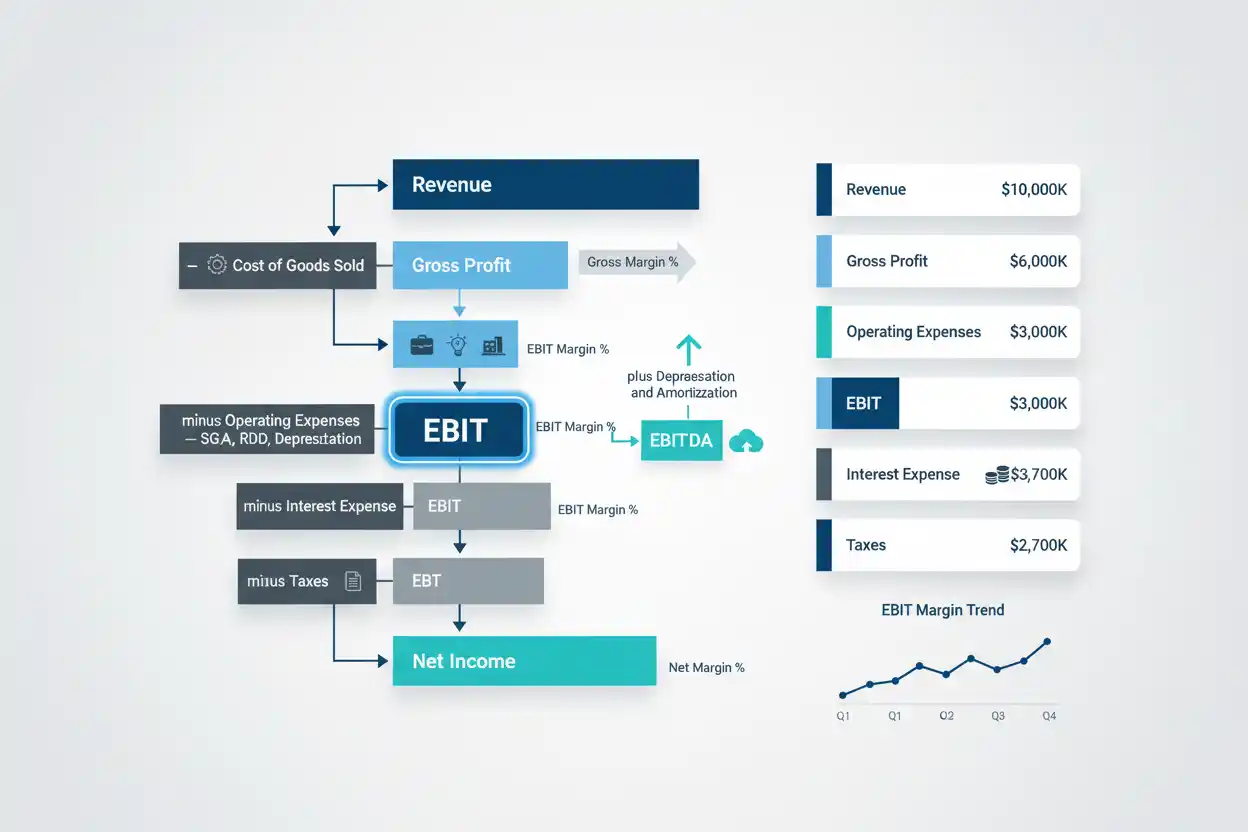
EBIT means earnings before interest and taxes. It measures business earnings before deducting interest expense and income taxes, helping analysts examine operating profitability separately from financing structure and tax effects.
One common formula is:
EBIT = Revenue − Operating Expenses Excluding Interest and Income Tax
EBIT can also be derived from net income:
EBIT = Net Income + Interest Expense + Income Tax Expense
Suppose a company reports $400,000 of net income, $80,000 of interest expense and $120,000 of income tax expense.
EBIT = $400,000 + $80,000 + $120,000
EBIT = $600,000
The company generated $600,000 of earnings before the effects of interest and income taxes under this calculation.
EBIT is useful because financing choices can make two otherwise similar businesses report different net income. A company funded heavily with debt can incur much more interest than an equity-funded competitor. Tax rates can also differ because of jurisdictions, loss carryforwards, credits and other circumstances.
Removing those two items gives analysts a clearer, though still incomplete, view of operating earnings.
Within business finance, EBIT also connects directly with EBITDA, operating margin, interest coverage, financial leverage and business valuation.
What Does EBIT Mean?
EBIT stands for earnings before interest and taxes.
The name explains the basic concept.
Start with the company’s earnings and examine the result before financing interest and income taxes are deducted.
Interest is separated because it reflects, in part, how a company finances itself.
Taxes are separated because tax expense depends on taxable income, jurisdiction, tax rules and other factors that do not necessarily describe the underlying operating economics.
EBIT therefore asks:
How much accounting earnings did the business generate before interest expense and income taxes?
The answer can help compare companies whose debt structures and tax positions differ.
However, EBIT is not cash flow. It can include noncash expenses such as depreciation and amortization, and it does not automatically capture working-capital movements or capital expenditures.
EBIT Formula
There are several valid ways to derive EBIT depending on the information available.
From operating activity:
EBIT = Revenue − Cost of Goods Sold − Operating Expenses
In this formulation, interest and income tax are not deducted.
From net income:
EBIT = Net Income + Interest Expense + Income Tax Expense
From EBITDA:
EBIT = EBITDA − Depreciation − Amortization
These formulas can produce the same conceptual measure when the financial-statement classifications and inputs are consistent.
However, unusual items, non-operating income, company-specific presentation and non-GAAP adjustments can complicate the comparison.
The analyst should understand where the underlying numbers came from rather than simply applying a formula mechanically.
Basic EBIT Example
Consider a business with:
Revenue = $2,000,000
Cost of goods sold = $1,000,000
Operating expenses = $500,000
Interest expense = $100,000
Income tax expense = $120,000
First calculate gross profit:
Gross Profit = $2,000,000 − $1,000,000
Gross Profit = $1,000,000
Then deduct operating expenses:
EBIT = $1,000,000 − $500,000
EBIT = $500,000
Interest and income tax come after the EBIT calculation.
Pre-tax earnings become:
Earnings Before Tax = $500,000 − $100,000
Earnings Before Tax = $400,000
After $120,000 of tax:
Net Income = $400,000 − $120,000
Net Income = $280,000
The company therefore has:
EBIT = $500,000
Net income = $280,000
The $220,000 difference reflects the interest and tax assumptions in this simplified example.
EBIT From Net Income
Sometimes the bottom line is available more readily than a clearly labeled EBIT amount.
Suppose the income statement shows:
Net income = $750,000
Interest expense = $150,000
Income tax expense = $250,000
Then:
EBIT = $750,000 + $150,000 + $250,000
EBIT = $1,150,000
This reverses the two deductions excluded by EBIT.
The calculation assumes those line items are the relevant interest and tax expenses associated with the earnings measure.
If a financial statement contains unusual financing income, tax benefits or discontinued operations, further reconciliation may be necessary.
EBIT From EBITDA
EBITDA means earnings before interest, taxes, depreciation and amortization.
Because EBITDA removes depreciation and amortization while EBIT generally retains them:
EBIT = EBITDA − Depreciation − Amortization
Suppose:
EBITDA = $2 million
Depreciation = $300,000
Amortization = $100,000
EBIT = $2,000,000 − $300,000 − $100,000
EBIT = $1,600,000
The $400,000 difference represents depreciation and amortization.
That distinction becomes particularly important for companies with substantial property, equipment or acquired intangible assets.
EBIT vs EBITDA
EBIT and EBITDA are closely related but should not be treated as interchangeable.
EBIT includes depreciation and amortization expense.
EBITDA removes them.
Suppose:
Revenue = $10 million
Cash-oriented operating costs before D&A = $7 million
Depreciation and amortization = $1 million
Then:
EBITDA = $10 million − $7 million
EBITDA = $3 million
EBIT is:
EBIT = $3 million − $1 million
EBIT = $2 million
EBITDA therefore appears higher.
Neither figure is automatically more correct.
EBIT can be more informative when depreciation represents meaningful economic consumption of productive assets.
EBITDA can help compare operating earnings before differing depreciation and amortization charges.
The dedicated EBITDA page owns the broader EBITDA calculation, interpretation and limitations rather than duplicating them here.
EBIT vs Operating Income
EBIT and operating income are often similar, and in many straightforward income statements they can be identical.
However, they are not universally synonymous.
Operating income is based on the company’s operating-income presentation.
EBIT is conceptually earnings before interest and taxes.
Suppose a company earns material investment income or another non-operating gain before interest and taxes.
Depending on the analytical definition, that item can create a difference between operating income and EBIT.
Therefore, when a financial statement already reports operating income, do not automatically rename it EBIT without checking the classifications.
For ordinary operating analysis, the figures are often close enough that analysts discuss them together, but definition discipline matters.
EBIT vs Net Income
Net profit or net income reflects more deductions than EBIT.
A simplified relationship is:
Net Income = EBIT − Interest − Taxes
Therefore:
EBIT = Net Income + Interest + Taxes
Suppose two companies each generate $1 million of EBIT.
Company A has no debt and incurs no interest.
Company B pays $300,000 of interest.
Before tax, Company A retains $1 million while Company B retains only $700,000.
The two businesses produce the same EBIT but different earnings for shareholders.
That makes EBIT useful for comparing operating performance while keeping financing decisions separate.
EBIT vs Gross Profit
Gross profit appears earlier in the income statement.
Gross Profit = Revenue − Cost of Goods Sold
EBIT goes further by deducting operating expenses.
Suppose:
Revenue = $5 million
Cost of goods sold = $3 million
Operating expenses = $1.2 million
Gross profit:
Gross Profit = $5,000,000 − $3,000,000
Gross Profit = $2,000,000
EBIT:
EBIT = $2,000,000 − $1,200,000
EBIT = $800,000
Gross profit shows the economics after direct or reported cost of sales.
EBIT shows how much remains after the broader operating expense structure represented in the calculation.
EBIT vs Gross Margin
Gross margin expresses gross profit relative to revenue.
Gross Margin = Gross Profit ÷ Revenue × 100
EBIT can also be converted into a margin.
EBIT Margin = EBIT ÷ Revenue × 100
Suppose:
Revenue = $10 million
Gross profit = $4 million
EBIT = $1.5 million
Gross margin:
Gross Margin = $4 million ÷ $10 million × 100
Gross Margin = 40%
EBIT margin:
EBIT Margin = $1.5 million ÷ $10 million × 100
EBIT Margin = 15%
The difference reflects operating expenses below gross profit.
EBIT Margin Formula
The EBIT margin measures EBIT as a percentage of sales.
EBIT Margin = EBIT ÷ Revenue × 100
Suppose EBIT is $900,000 on $6 million of revenue.
EBIT Margin = $900,000 ÷ $6,000,000 × 100
EBIT Margin = 15%
The company generates approximately 15 cents of EBIT for every $1 of revenue.
EBIT margin is useful when comparing companies of different sizes because it normalizes earnings relative to revenue.
However, industry cost structures vary significantly, so a 15% EBIT margin cannot be judged universally.
EBIT and Operating Margin
Operating margin commonly uses operating income divided by revenue.
When operating income and EBIT are equivalent under the company’s presentation, EBIT margin and operating margin can also be equivalent.
If EBIT includes items outside operating income, the percentages differ.
This is another reason financial analysis should define the numerator rather than relying only on ratio names.
EBIT and Contribution Margin
Contribution margin measures revenue remaining after variable costs.
EBIT is calculated after both variable costs and operating fixed costs are recognized under the simplified cost-volume-profit structure.
Conceptually:
Contribution Margin − Fixed Operating Costs = EBIT
Suppose:
Revenue = $1 million
Variable costs = $600,000
Fixed operating costs = $250,000
Contribution margin:
Contribution Margin = $400,000
EBIT:
EBIT = $400,000 − $250,000
EBIT = $150,000
This relationship makes EBIT central to break-even analysis and leverage calculations.
EBIT and Fixed Costs
Fixed costs can create significant sensitivity between revenue and EBIT.
Suppose a company has high fixed operating expenses.
Once contribution exceeds those fixed costs, additional sales can produce rapid EBIT growth if the fixed-cost base remains stable.
If sales fall, however, fixed expenses remain and EBIT can decline quickly.
This is the basis of operating leverage.
EBIT therefore provides the key earnings measure for examining how the operating cost structure responds to changes in sales.
EBIT and Degree of Operating Leverage
A common degree-of-operating-leverage relationship is:
Degree of Operating Leverage = Contribution Margin ÷ EBIT
Suppose:
Contribution margin = $800,000
EBIT = $400,000
DOL = $800,000 ÷ $400,000
DOL = 2.0
A 1% movement in sales is associated with approximately a 2% movement in EBIT under the assumptions of the model.
As EBIT approaches zero near operating break-even, degree of operating leverage can become extremely high.
EBIT and Degree of Combined Leverage
The preceding degree of combined leverage article uses EBIT as the bridge between operating and financial leverage.
The sequence is:
Sales → EBIT → Earnings to Shareholders
Operating leverage describes the movement from sales to EBIT.
Financial leverage describes the movement from EBIT to shareholder earnings after fixed financing costs.
Combined leverage incorporates both.
That is why EBIT occupies a central position in leverage analysis: it represents operating earnings before interest changes the amount left for equity holders.
EBIT and Financial Leverage
Financial leverage begins below EBIT.
Suppose:
EBIT = $1 million
Interest expense = $250,000
Earnings before tax:
EBT = $1,000,000 − $250,000
EBT = $750,000
If EBIT rises 10% to $1.1 million while interest remains fixed:
New EBT = $1,100,000 − $250,000
New EBT = $850,000
EBIT rose 10%.
EBT increased from $750,000 to $850,000, approximately 13.3%.
Fixed interest amplified the earnings movement.
EBIT and Debt Ratio
The debt ratio measures debt relative to assets.
EBIT measures earnings before the interest cost of that debt.
Companies with similar debt ratios can have very different EBIT.
That difference matters because debt ultimately needs to be serviced from the economics of the business.
Suppose Company A and Company B each have $10 million of debt.
Company A produces $5 million of EBIT.
Company B produces only $750,000.
The same borrowing amount has dramatically different implications.
EBIT and Debt-to-Equity Ratio
The debt-to-equity ratio measures debt relative to shareholder equity.
Again, EBIT provides an earnings perspective that the balance-sheet ratio lacks.
A high D/E ratio combined with growing EBIT can be more sustainable than the same leverage combined with deteriorating EBIT.
However, EBIT is still not cash, so debt analysis should go further.
EBIT and Interest Coverage
Interest coverage frequently uses EBIT directly:
Interest Coverage = EBIT ÷ Interest Expense
Suppose EBIT is $2 million and interest expense is $400,000.
Interest Coverage = $2,000,000 ÷ $400,000
Interest Coverage = 5×
The company generates EBIT equal to five times its interest expense.
If EBIT falls to $600,000:
Interest Coverage = $600,000 ÷ $400,000
Interest Coverage = 1.5×
The debt balance itself did not need to change for debt-service capacity to deteriorate sharply.
EBIT and Taxes
EBIT is measured before income tax expense.
This makes it useful for comparing operating profitability across businesses with different effective tax rates.
Suppose two companies each have $1 million of EBIT and no interest expense.
Company A pays $150,000 in income tax.
Company B pays $300,000.
Their net incomes differ even though their EBIT is identical.
The difference can reflect jurisdiction, tax attributes, credits, permanent differences or other factors.
EBIT isolates performance before those tax effects.
EBIT and Depreciation
Depreciation is generally included as an expense when calculating EBIT.
Suppose:
EBITDA = $5 million
Depreciation = $1.2 million
Amortization = $300,000
EBIT = $5,000,000 − $1,200,000 − $300,000
EBIT = $3,500,000
This matters for asset-intensive businesses.
Factories, vehicles, machinery and infrastructure can require substantial investment.
Depreciation does not represent a current-period cash payment, but it can reflect the accounting allocation of asset cost over time.
Removing it entirely can make an asset-heavy business look economically different.
EBIT and Amortization
Amortization works similarly for certain intangible assets.
Acquisitions can create identifiable intangible assets whose amortization reduces EBIT.
A business with substantial acquired intangibles may therefore report a meaningful gap between EBIT and EBITDA.
Whether analysts treat that amortization as economically significant depends on the purpose of the analysis.
The financial statements should remain the starting point, while adjustments should be identified explicitly.
EBIT and Operating Cash Flow
Operating cash flow is not the same as EBIT.
EBIT is an accounting earnings measure.
Operating cash flow incorporates cash effects including working-capital changes and adjustments for noncash expenses.
Suppose EBIT is strong, but accounts receivable rises sharply because customers are paying slowly.
Accounting operating earnings can remain healthy while cash generation weakens.
Likewise, depreciation reduces EBIT but does not create a same-period cash outflow.
These differences are why EBIT cannot replace cash-flow analysis.
EBIT and Free Cash Flow
Free cash flow goes further by considering specified capital-investment requirements in addition to operating cash generation.
A company can generate $10 million of EBIT but require $12 million of annual capital expenditure to maintain and expand its productive assets.
Another company can generate only $6 million of EBIT but require minimal capital investment.
The second business can potentially generate more free cash flow.
EBIT measures operating profitability before financing and tax.
It does not determine the amount of distributable cash.
EBIT and Capital Expenditure
Capital expenditure is not normally deducted immediately from EBIT.
Instead, qualifying capital assets are generally recognized on the balance sheet and depreciated or amortized over their relevant accounting lives.
Therefore, a company can report strong EBIT while spending substantial cash on new equipment.
This distinction is particularly important for capital-intensive companies.
A high EBIT margin does not eliminate the need to examine capital expenditure.
EBIT and Working Capital
Working capital can cause operating cash flow to diverge from EBIT.
Suppose a company reports higher EBIT because sales increased.
If those sales are made on credit, accounts receivable can rise before customer cash is collected.
Inventory can also increase ahead of future sales.
Those working-capital investments consume cash without necessarily reducing EBIT in the same period.
Profitability and liquidity therefore remain distinct.
EBIT and Days Sales Outstanding
Days sales outstanding helps explain how receivables affect the conversion of EBIT-linked sales into cash.
Suppose EBIT grows 20% while DSO rises from 30 days to 70 days.
The company is generating stronger accounting operating earnings but waiting much longer to collect customers.
That can create working-capital pressure despite improved profitability.
EBIT and Inventory Efficiency
Inventory can affect EBIT through cost of goods sold, markdowns and write-downs, while inventory levels also affect cash separately.
Days inventory outstanding and inventory turnover show how efficiently stock is moving.
A company can improve EBIT by selling more inventory at attractive margins while also releasing cash from a more efficient inventory base.
Conversely, unsold inventory can consume cash before its economic weakness becomes fully visible in EBIT.
EBIT and Days Payable Outstanding
Days payable outstanding affects cash timing but normally does not change EBIT merely because the company pays an existing supplier invoice later.
Suppose an operating expense or inventory cost has already been recognized.
Paying the supplier on day 30 versus day 60 changes cash timing.
The underlying EBIT expense does not necessarily change.
This is another clear example of why operating earnings and cash movements must be separated.
EBIT and Cash Conversion Cycle
The cash conversion cycle explains how inventory, receivables and payables influence the time required to convert operating investment back into cash.
EBIT does not capture that timing.
Two companies can generate identical EBIT while one requires far more working capital because its inventory and receivable cycle is longer.
That difference can materially affect financing requirements and business value.
EBIT and Cash Flow Forecasting
Cash flow forecasting can begin with expected business activity but must translate that activity into actual receipt and payment timing.
Forecast EBIT is useful for estimating future operating profitability.
It does not tell management whether enough cash will be available for payroll next month.
A sound forecast therefore distinguishes earnings from cash.
EBIT and Economic Value Added
The master plan directly connects EBIT with economic value added.
Economic value added typically begins with operating profit after tax and compares that return with the cost of capital employed.
EBIT provides an operating earnings starting point before financing costs.
A business can generate positive EBIT while still destroying economic value if the returns generated by its capital base are insufficient relative to the required cost of that capital.
Profitability alone does not prove value creation.
EBIT and Return on Assets
Return on assets measures earnings relative to the asset base under its chosen numerator.
Analysts sometimes use operating earnings to study how productively assets generate profit before financing structure.
Suppose:
EBIT = $2 million
Average assets = $10 million
An EBIT-based operating return on assets would be:
Operating Return on Assets = $2,000,000 ÷ $10,000,000
= 20%
The exact ROA formula should remain consistent with the dedicated ROA page, but EBIT can provide useful operating context.
EBIT and Return on Equity
Return on equity focuses on earnings ultimately attributable to shareholder capital, usually after financing costs and taxes under common formulations.
EBIT appears earlier in the earnings chain.
A highly leveraged company can generate strong EBIT but much weaker net income because interest consumes a large portion of operating earnings.
Therefore, EBIT and ROE should not be compared as substitutes.
They describe profitability at different levels of the capital structure.
EBIT and Asset Turnover
Asset turnover measures revenue produced per unit of assets.
EBIT margin measures operating earnings relative to revenue.
Together, these measures can help explain how efficiently a company uses assets to generate operating profit.
A business can have low margins but high asset turnover.
Another can have high margins but low turnover.
Both can potentially generate attractive operating returns through different economic models.
EBIT and Business Valuation
Business valuation can use EBIT directly or indirectly.
Valuation multiples such as EV/EBIT compare enterprise value with operating earnings before interest and tax.
Conceptually:
EV/EBIT = Enterprise Value ÷ EBIT
Suppose enterprise value is $20 million and EBIT is $2 million.
EV/EBIT = $20,000,000 ÷ $2,000,000
EV/EBIT = 10×
That does not mean a business is automatically worth ten times EBIT.
Valuation multiples need comparison, growth, risk, margins, capital requirements and other context.
EBIT vs EBITDA in Valuation
EV/EBIT and EV/EBITDA can produce different multiples because EBITDA is normally higher by depreciation and amortization.
Suppose:
Enterprise value = $30 million
EBITDA = $5 million
EBIT = $3 million
EV/EBITDA = $30 million ÷ $5 million = 6×
EV/EBIT = $30 million ÷ $3 million = 10×
Neither multiple is inherently superior.
EBIT can be particularly useful when depreciation represents a meaningful ongoing economic cost of the asset base.
EBITDA can facilitate comparisons where D&A varies for reasons analysts want to isolate.
EBIT and Enterprise Value
Enterprise value is commonly paired with EBIT because EBIT is measured before interest expense.
That matching principle matters.
Enterprise value represents the operating business available to both debt and equity capital providers under the typical valuation framework.
EBIT is also measured before the financing split between debt and equity affects earnings.
By contrast, comparing enterprise value with net income mixes an enterprise-level value measure with an equity-level earnings measure.
EBIT and Net Profit Margin
Net profit margin reflects earnings after more expenses than EBIT margin.
Suppose:
Revenue = $10 million
EBIT = $2 million
Interest = $500,000
Taxes = $300,000
EBIT margin:
EBIT Margin = $2 million ÷ $10 million
= 20%
Net income:
Net Income = $2 million − $500,000 − $300,000
= $1.2 million
Net profit margin:
Net Profit Margin = $1.2 million ÷ $10 million
= 12%
The eight-percentage-point difference reflects financing and tax effects in this simplified example.
EBIT and Pricing
Pricing decisions can change EBIT through revenue and contribution margin.
Suppose a product sells for $100 with $60 of variable cost.
Contribution is $40.
If the company raises price to $105 while unit volume remains unchanged, contribution per unit becomes $45.
That additional $5 flows toward fixed-cost coverage and EBIT under the simplified model.
However, pricing also influences demand.
EBIT analysis can quantify the profitability effect once volume assumptions are made; it cannot predict how customers will respond.
EBIT and Cost-Plus Pricing
Cost-plus pricing establishes prices from a cost base plus markup.
A cost-plus price can produce positive gross profit while still generating inadequate EBIT if operating overhead is too high.
Suppose each product produces attractive gross margin, but the company carries expensive facilities, administration and sales infrastructure.
EBIT can remain weak.
Pricing therefore needs to support the full operating structure, not only the reported cost of goods sold.
EBIT and Break-Even Analysis
At operating break-even:
EBIT = 0
Under a simplified cost-volume-profit framework:
Contribution Margin = Fixed Operating Costs
Suppose fixed costs are $500,000 and contribution margin per unit is $25.
Break-even units:
Break-Even Units = $500,000 ÷ $25
Break-Even Units = 20,000
At 20,000 units, EBIT is approximately zero under the model.
Every additional unit contributes toward positive EBIT, assuming the cost relationships remain valid.
Negative EBIT
EBIT can be negative.
Suppose:
Revenue = $1 million
Cost of goods sold = $600,000
Operating expenses = $500,000
EBIT = $1,000,000 − $600,000 − $500,000
EBIT = −$100,000
The business has an operating loss before considering interest and tax.
Debt can make the final result worse because interest expense still needs to be deducted.
A company with negative EBIT should therefore examine whether the loss is temporary, growth-related, cyclical or structural.
Can EBIT Be Higher Than Revenue?
Under ordinary operating conditions, EBIT is normally below revenue because the company incurs operating costs.
However, unusual non-operating gains included within a broad EBIT calculation can potentially produce unusual relationships.
If EBIT exceeds revenue, analysts should examine the financial statement carefully rather than treating the result as normal operating profitability.
The classification of gains and other items becomes particularly important.
Can EBIT Be Higher Than EBITDA?
Normally EBITDA is equal to or greater than EBIT when depreciation and amortization are positive expenses.
EBITDA = EBIT + Depreciation + Amortization
Therefore, positive D&A makes EBITDA higher.
If unusual credits, reversals or company-specific adjustments create the opposite relationship, the reconciliation should be reviewed.
Can EBIT Equal EBITDA?
Yes.
If depreciation and amortization are zero:
EBITDA = EBIT
This can occur in businesses with little depreciable or amortizable asset expense.
Many companies still have at least some D&A, so exact equality is not universal.
Can EBIT Equal Operating Income?
Yes.
In a straightforward income statement with no relevant non-operating income or expense between operating income and interest/taxes, EBIT and operating income can be identical.
That is common enough that analysts sometimes use the terms interchangeably.
However, definitions should still be checked when precision matters.
What Is a Good EBIT?
There is no universal dollar amount that defines good EBIT.
A $1 million EBIT can be excellent for a small business and negligible for a multinational company.
EBIT margin provides a more comparable percentage:
EBIT Margin = EBIT ÷ Revenue
Even then, industries differ dramatically.
Software, retail, manufacturing, utilities and professional services have different cost structures and capital needs.
A useful analysis compares the company with its own history and genuinely comparable businesses.
How to Increase EBIT
EBIT can improve when revenue grows faster than operating costs, gross margin improves, variable costs decline, fixed expenses become more efficient or the sales mix shifts toward stronger contribution economics.
However, improving EBIT should not become a simplistic cost-cutting exercise.
Cutting research, customer service, maintenance or productive sales investment can increase short-term EBIT while harming future competitiveness.
Likewise, revenue growth that requires unsustainable discounts can increase sales without improving operating earnings.
The quality and durability of the improvement matter.
EBIT Growth Analysis
Suppose EBIT changes:
Year 1 = $2 million
Year 2 = $2.5 million
Year 3 = $3.2 million
EBIT is growing.
The next question is why.
Revenue may be increasing.
Gross margin may be improving.
Fixed costs may be scaling efficiently.
A one-time operating gain can also increase EBIT temporarily.
Trend analysis should separate recurring operating improvement from nonrecurring effects.
EBIT Margin Trend Analysis
Suppose EBIT margin changes:
Year 1 = 8%
Year 2 = 11%
Year 3 = 14%
The company is generating more operating earnings per dollar of revenue.
This can indicate pricing strength, better gross margin, operating leverage or cost control.
A declining EBIT margin can indicate rising costs, price pressure, weaker sales mix or underutilized capacity.
The percentage helps distinguish earnings growth caused merely by a larger revenue base from actual improvement in operating economics.
Adjusted EBIT
Companies and analysts sometimes calculate adjusted EBIT by removing items they consider unusual, nonrecurring or not representative of core operations.
Possible adjustments can include restructuring charges, acquisition-related costs, gains or losses on disposals and other items.
Adjusted measures can be useful.
They can also become misleading when supposedly “nonrecurring” expenses occur repeatedly.
The unadjusted financial-statement measure should remain visible, and every adjustment should be explained rather than silently removed.
EBIT as a Non-GAAP Measure
Depending on how a company calculates and presents it, EBIT can be a non-GAAP financial measure rather than a formally defined line item under the applicable accounting presentation.
This means companies can sometimes define adjusted EBIT differently.
Analysts should therefore reconcile company-specific versions back to the nearest standardized financial-statement measure where possible.
The label EBIT alone does not guarantee identical calculation methodology across issuers.
Common EBIT Mistakes
One common mistake is assuming EBIT always equals operating income.
Another is confusing EBIT with EBITDA.
Analysts may also add back interest and taxes incorrectly when tax benefits or interest income complicate the income statement.
Treating EBIT as cash flow is another major error.
The measure does not directly incorporate capital expenditure, working-capital movements or debt principal payments.
Finally, a high EBIT figure should not be judged without considering company size, margins and capital employed.
Limitations of EBIT
EBIT deliberately removes interest and tax, which improves comparability in some situations but also removes real economic costs.
Interest matters to creditors and shareholders because debt must be serviced.
Taxes represent real cash obligations over time even if accounting tax expense and cash tax payments differ.
EBIT also includes depreciation and amortization but excludes capital expenditure directly.
It does not reveal working-capital requirements.
Different accounting policies and company-specific adjustments can affect comparability.
The metric is therefore best used alongside EBITDA, cash flow, leverage, margins and capital-return measures.
How to Analyze EBIT Properly
Begin by identifying how the company calculated EBIT.
Reconcile it with revenue, operating expenses and net income.
Compare EBIT with EBITDA to understand depreciation and amortization.
Calculate EBIT margin.
Review several years of trends.
Then examine gross margin and operating costs to determine what drives the result.
Compare EBIT with interest expense through interest coverage.
Connect operating earnings with debt levels.
Next, compare EBIT with operating and free cash flow.
Finally, examine whether the capital employed to generate EBIT produces an acceptable return.
The goal is not simply to find the largest EBIT number.
It is to determine whether the business produces durable operating earnings efficiently enough to support its financing, investment requirements and required return on capital.
Frequently Asked Questions
What does EBIT stand for?
EBIT stands for earnings before interest and taxes.
What is the EBIT formula?
One common formula is:
EBIT = Net Income + Interest Expense + Income Tax Expense
It can also be calculated from revenue and operating expenses before interest and income tax.
How do you calculate EBIT from EBITDA?
EBIT = EBITDA − Depreciation − Amortization
Is EBIT the same as operating income?
Often, but not always. The two can differ when non-operating items are included before interest and taxes or when company-specific definitions are used.
What is the difference between EBIT and EBITDA?
EBIT includes depreciation and amortization expense. EBITDA adds those expenses back.
Is EBIT the same as net income?
No. Net income generally deducts interest and taxes, while EBIT is calculated before those items.
Is EBIT the same as gross profit?
No. Gross profit deducts cost of goods sold from revenue. EBIT also reflects broader operating expenses.
What is EBIT margin?
EBIT Margin = EBIT ÷ Revenue × 100
It shows EBIT as a percentage of revenue.
Can EBIT be negative?
Yes. Negative EBIT means the company has an operating loss before interest and taxes under the calculation.
Can EBIT equal EBITDA?
Yes, when depreciation and amortization are zero.
Is EBIT cash flow?
No. EBIT is an accounting earnings measure and does not directly account for working-capital changes, capital expenditure or debt principal payments.
Why is EBIT useful?
EBIT helps evaluate operating earnings before financing structure and income taxes, making it useful for profitability, leverage, interest-coverage and valuation analysis.
Final Perspective
EBIT isolates one of the most important levels of business profitability:
EBIT = Earnings Before Interest and Taxes
From net income:
EBIT = Net Income + Interest + Taxes
From EBITDA:
EBIT = EBITDA − Depreciation − Amortization
Its value comes from separating operating earnings from two major factors that can differ significantly between companies: financing and taxation.
That makes EBIT useful for comparing operating profitability, calculating interest coverage, examining leverage and applying valuation multiples such as EV/EBIT.
Yet EBIT is not cash flow, and it is not the final amount available to shareholders.
Depreciation remains included. Capital expenditure is not deducted directly. Working-capital changes can consume cash. Interest still has to be paid, and taxes still matter.
The useful question is therefore not simply:
“How much EBIT did the company generate?”
It is:
“How durable is that operating profit, what assets and costs are required to produce it, how much debt must it support, and how effectively does it convert into cash and economic value?”
That is where EBIT becomes more than an income-statement subtotal and starts functioning as a meaningful business-finance measure.




